标准普尔 500 指数技术分析 - 所有人都在关注美国 NFP 报告
Fundamental Overview . . After a couple of weeks of consolidation, the S&P 500 this week found some footing and eventually extended the rally into a new all-time high following the soft US Jo...
FundamentalOverview
After a couple of weeks ofconsolidation, the S&P 500 this week found some footing and eventuallyextended the rally into a new all-time high following the soft US Jobless Claims and ISM Services PMI reports.
Overall, the data didn’tchange much in terms of interest rates expectations, but it reinforced the viewthat the Fed is going to deliver at least two rate cuts by the end of the year.The soft-landing narrative is still the main driver of the market, and the datais indeed backing it for now with ongoing disinflation and resilient economy aswe head into the easing cycle.
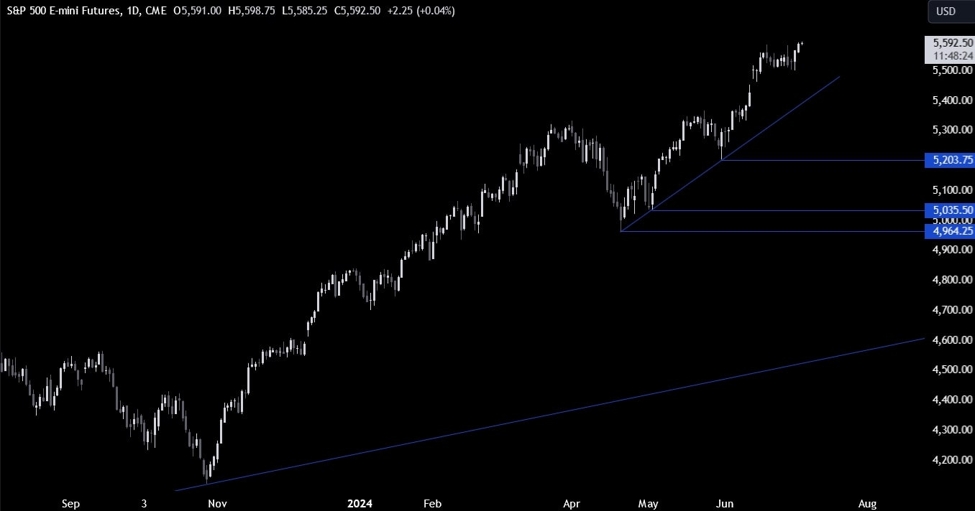
S&P 500Technical Analysis – Daily Timeframe
On the daily chart, we cansee that after two weeks of consolidation, the S&P 500 reached a new all-timehigh following some soft US data. From a risk management perspective, thebuyers will have a better risk to reward setup around the trendline. At the moment though, it’s hard toenvision such a big pullback unless we get some ugly US data.
S&P 500 TechnicalAnalysis – 4 hour Timeframe
On the 4 hour chart, we cansee more clearly the rangebound price action of the last couple of weeks withthe recent breakout. This is where the buyers are stepping in with a definedrisk below the resistancenow turned support to position for a rally into new highs. The sellers, onthe other hand, will want to see the price falling back inside the range toposition for a drop into the 5500 support.
S&P 500 TechnicalAnalysis – 1 hour Timeframe
On the 1 hour chart, we cansee that we have a bit of consolidation now around the 5587 level as the marketawaits the US NFP report. If we get bad data, the market might go into risk-offand we will likely see the sellers piling in aggressively for a selloff intothe 5500 support.
The buyers will want to seea good or benign report which could even lead to a dip-buying opportunity on a possiblepullback into the 5560 zone. The red lines define the average daily range for today.
UpcomingCatalysts
Today we conclude the week with the US NFP report where the data is expectedto show 190K jobs added in June and the Unemployment Rate to remain unchangedat 4.0%.
Disclaimer: The views in this article are from the original author and do not represent the views or position of Hawk Insight. The content of the article is for reference, communication and learning only, and does not constitute investment advice. If it involves copyright issues, please contact us for deletion.