Mantle (MNT) Gains 14%, Becomes the Day’s Top Performer
Mantle (MNT) surges 14%, fueled by strong demand, reduced sell-offs, and bullish price momentum. Could it reach its all-time high?
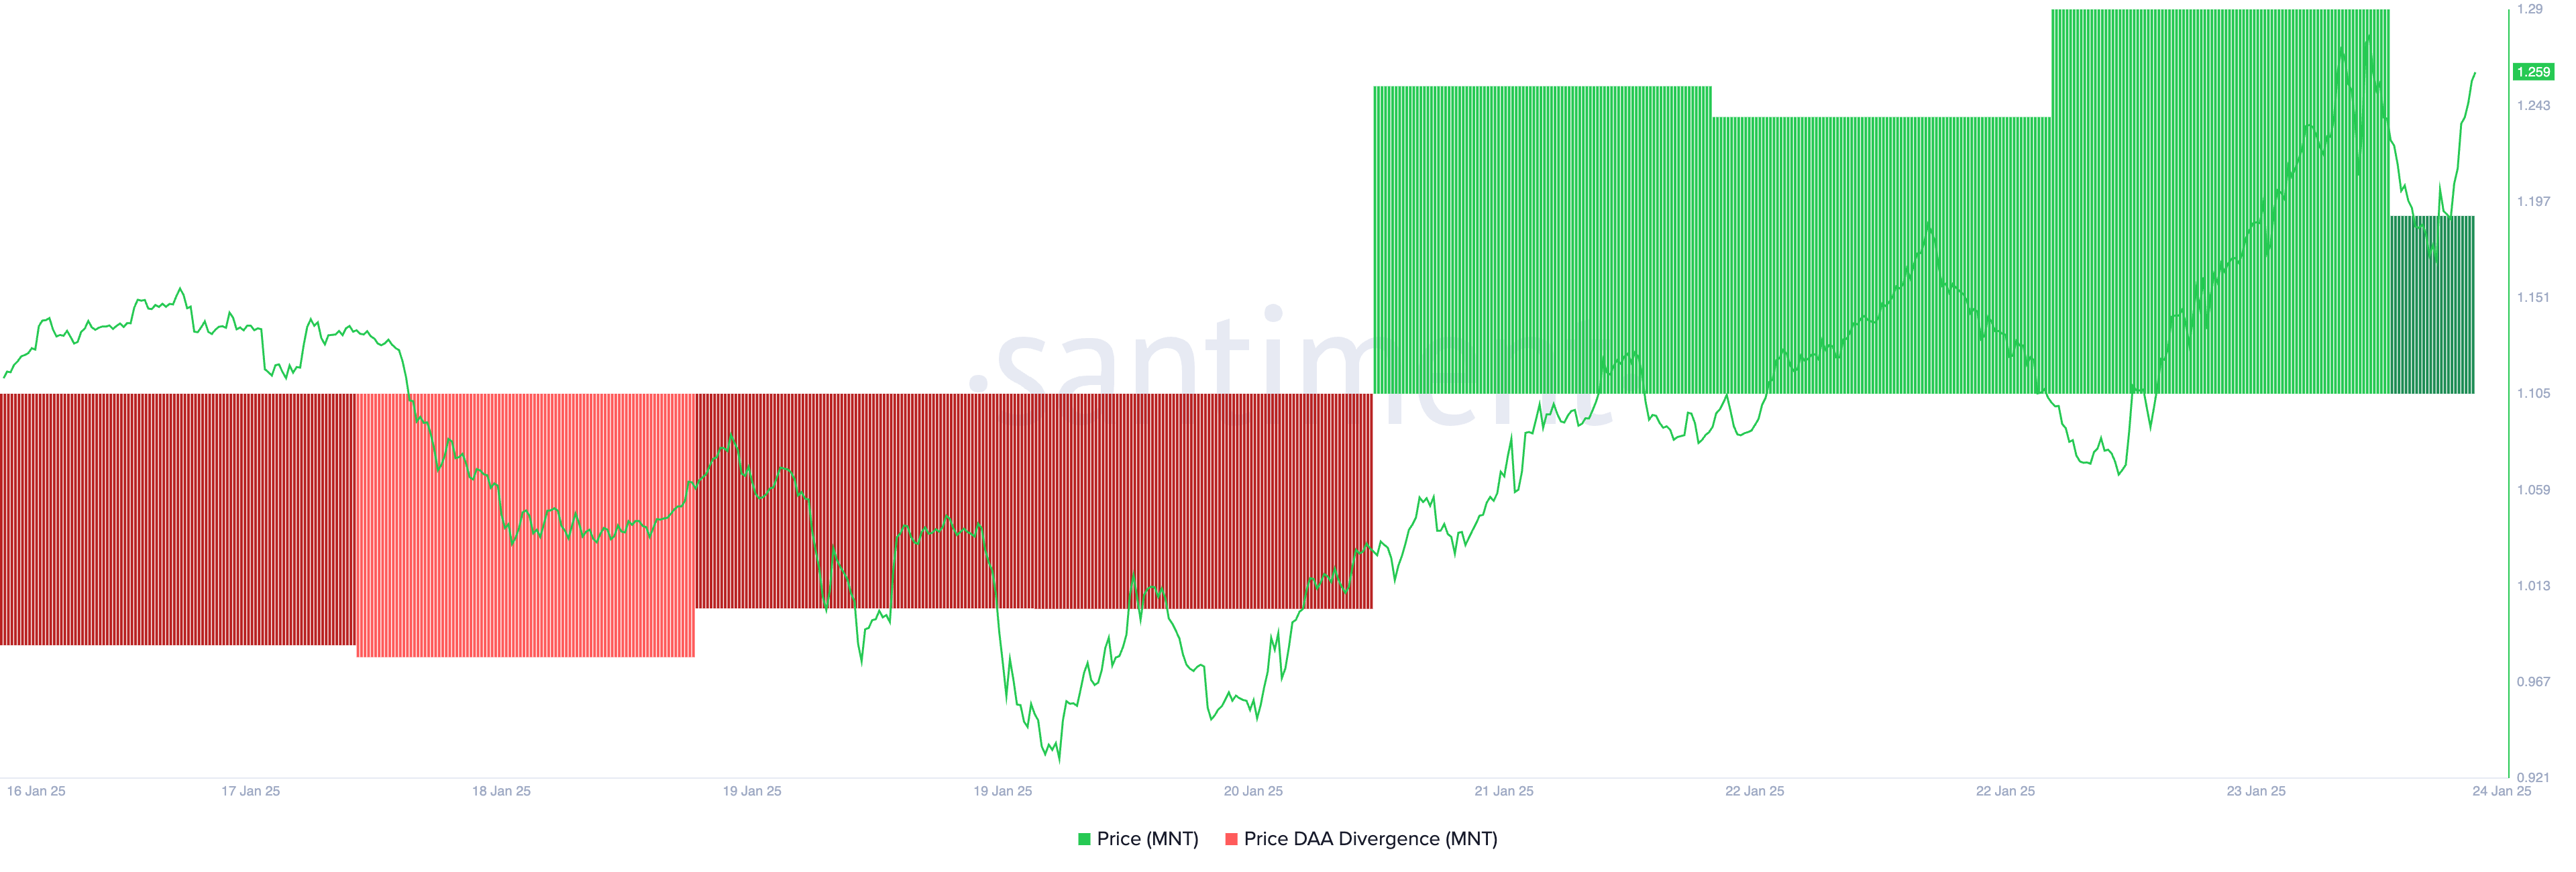
- MNT's positive DAA divergence at 54.67% signals rising user activity and increased demand for the token.
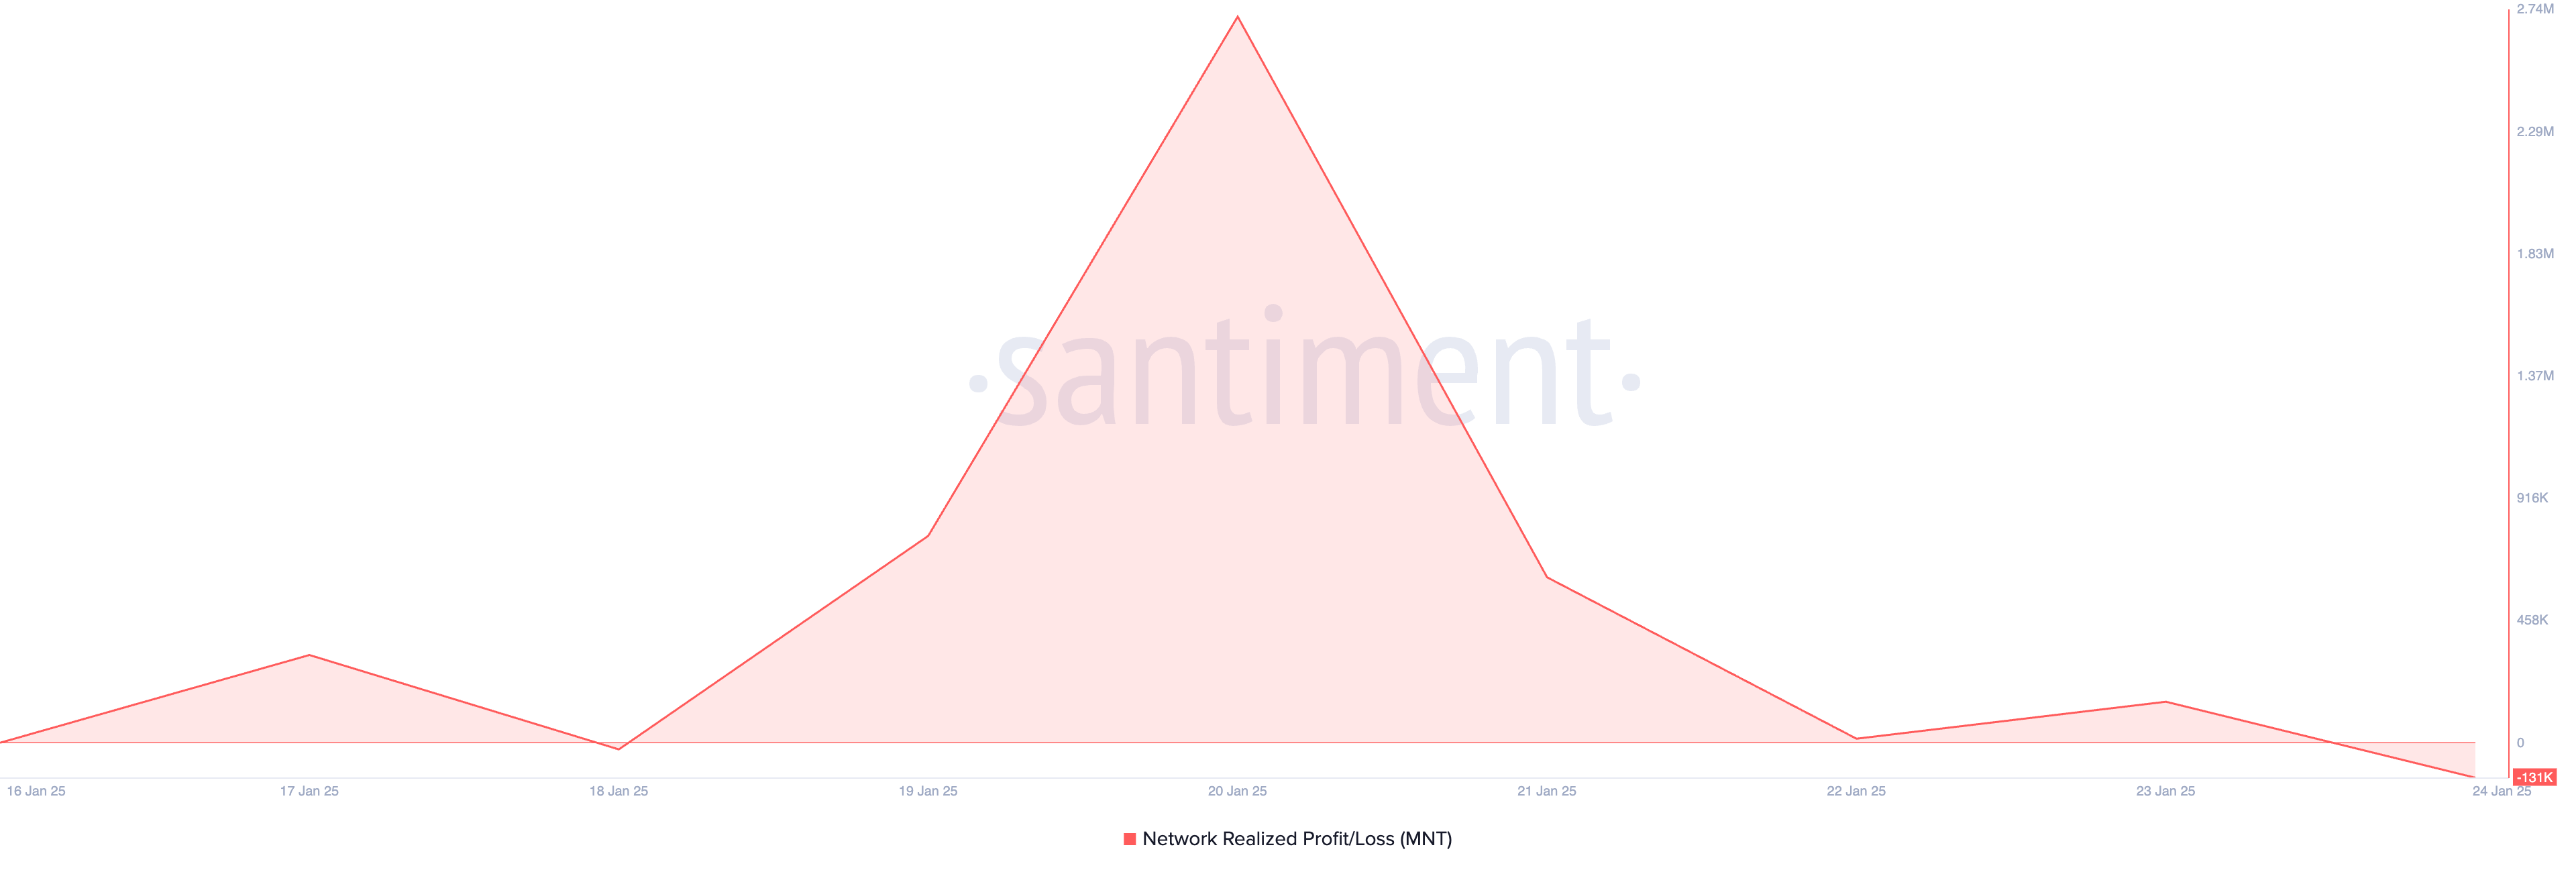
- The negative NPL indicates fewer sell-offs at a loss, reducing downward pressure on MNT's price.
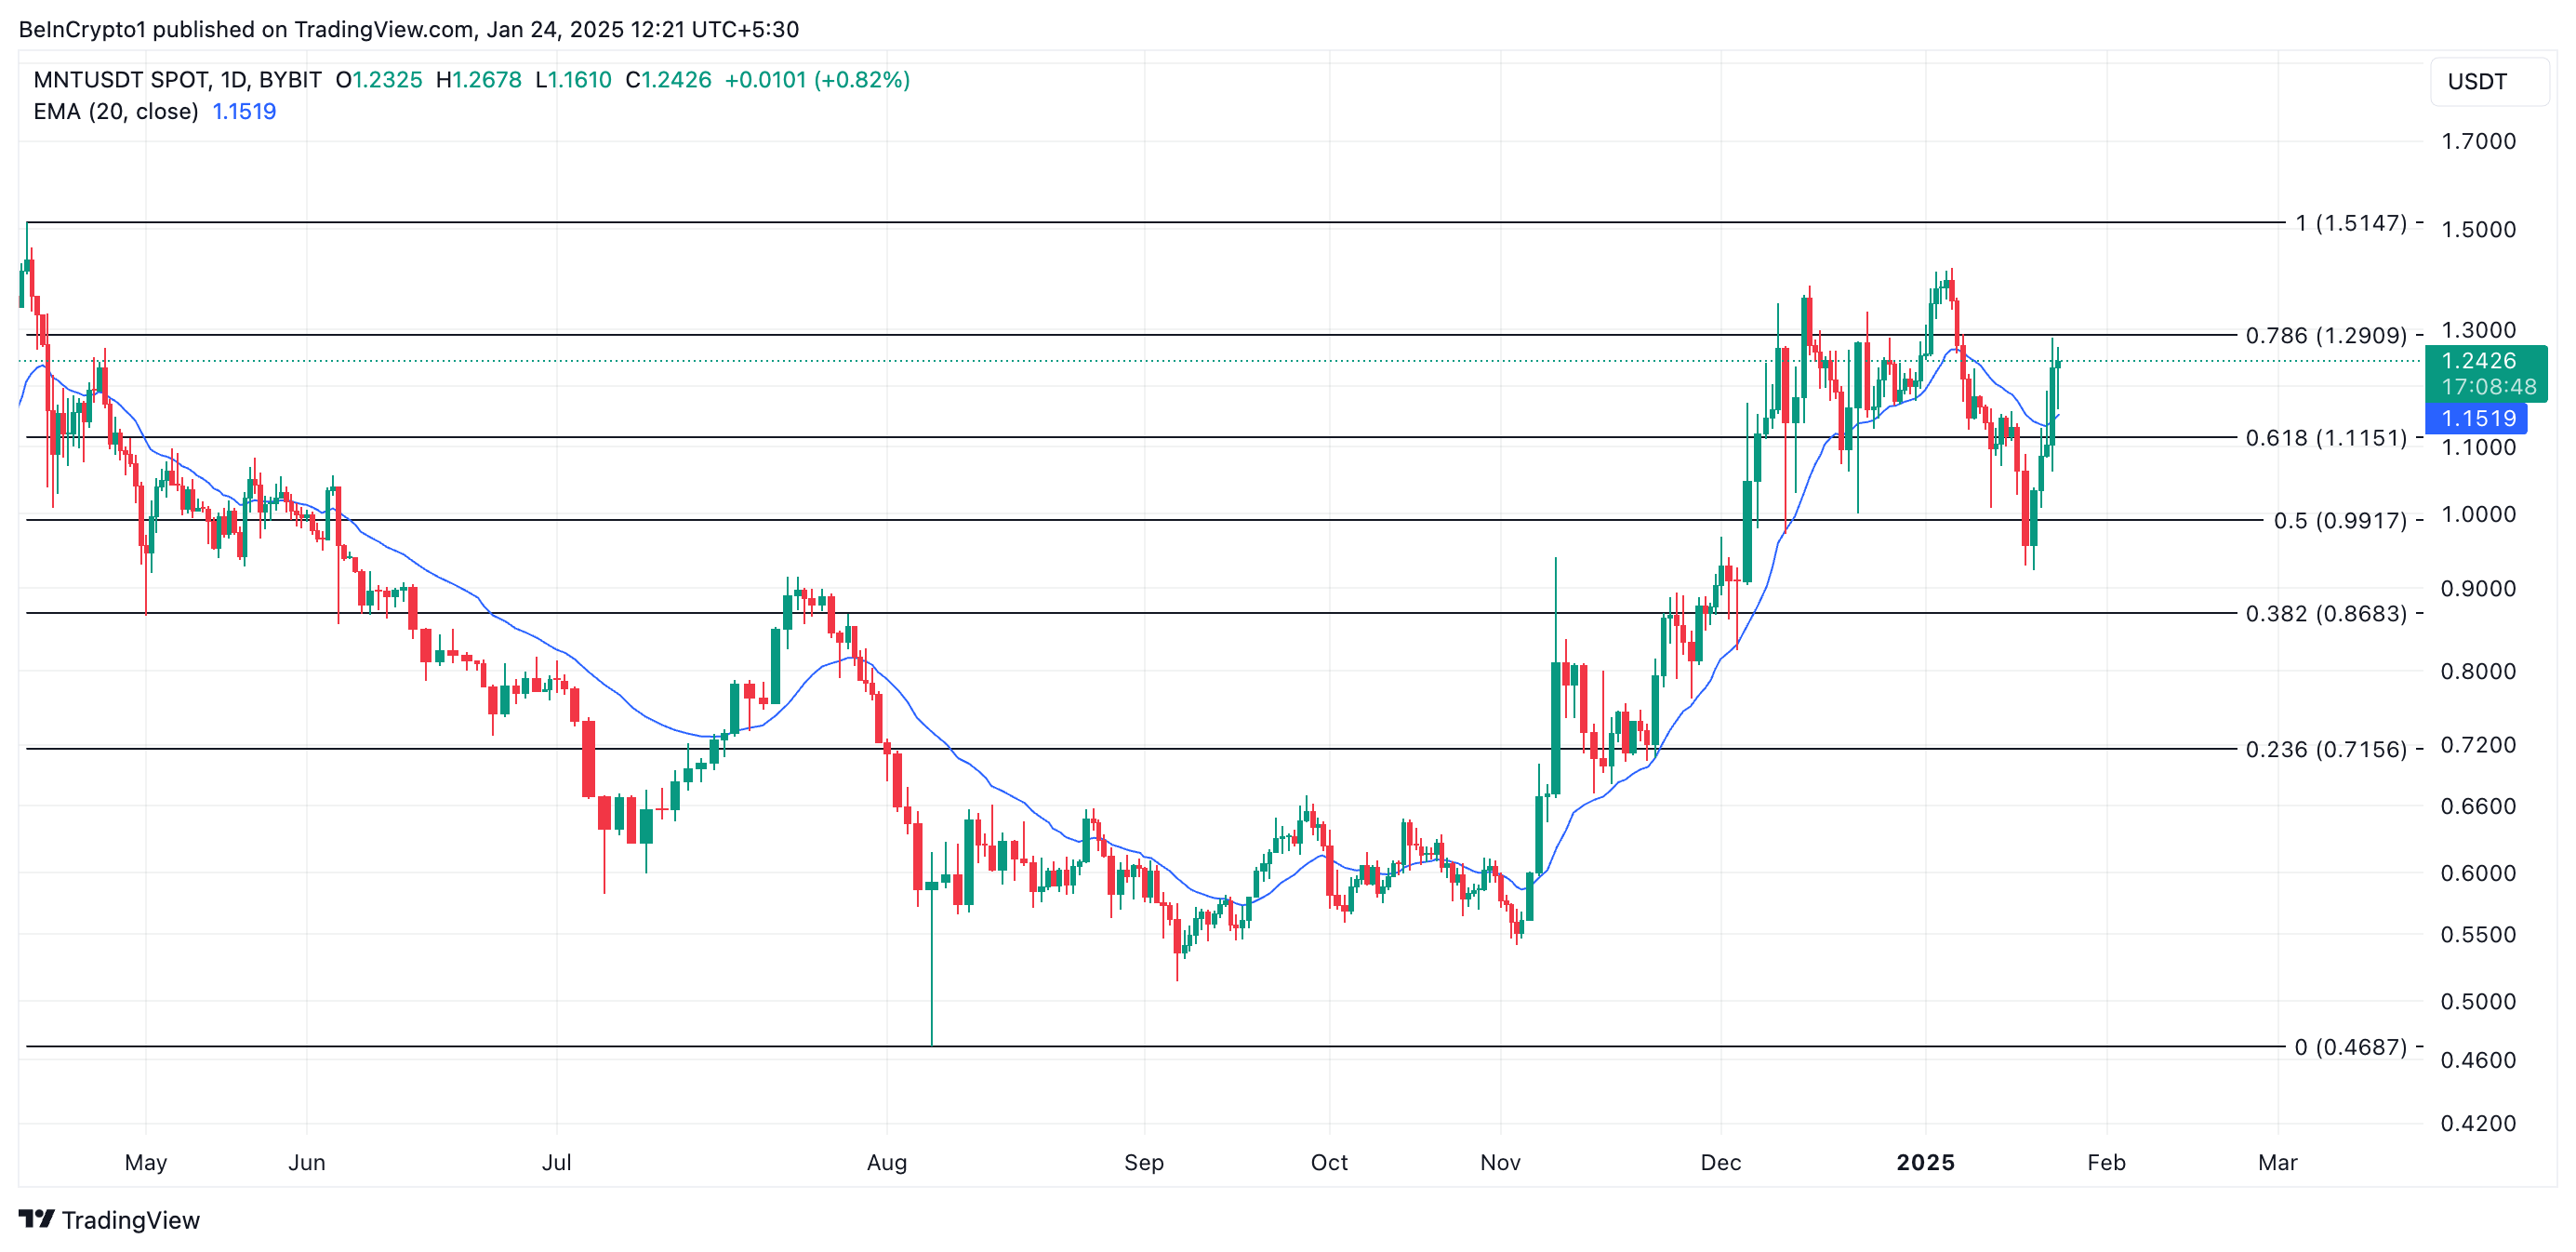
- MNT broke above its 20-day EMA, with potential resistance at $1.29 and an all-time high target of $1.51.

MNT, the native token of Mantle Network, the Layer-2 technology stack for scaling Ethereum, has experienced a 13% price surge in the last 24 hours. This has caused it to emerge as the market’s top gainer during that period, outperforming the top 100 cryptos by market capitalization.
Strengthening demand and growing investor confidence suggest that the rally may continue in the short term. Here is how.
Mantle Token Demand Rockets
According to Santiment, MNT’s positive Price Daily Active Addresses (DAA) Divergence metric reflects the growing demand for the altcoin. At press time, the metric is at 54.67%.
This is a strong buy signal, as the divergence indicates increased user activity on MANTLE. This could continue to drive up the demand for MNT and further strengthen the price rally.

Additionally, MNT’s Network Realized Profit/Loss (NPL) is below zero at -131,000, indicating reduced profit-taking activity among market participants.
An asset’s NPL measures the total profit or loss realized by all tokens or coins that changed hands on a given day, comparing their sale price to their purchase price. A negative NPL like this indicates that, on average, assets were sold at a loss.

This can deter MNT selloffs in the short term because it reflects a loss for those who are selling below their purchase price. Therefore, with fewer tokens being sold at a loss, the downward pressure in the market is reduced, strengthening the ongoing rally.
MNT Price Prediction: Can the Bullish Momentum Persist?
An assessment of the MNT/USD one-day chart reveals that the double-digit rally has propelled MNT’s price above its 20-day exponential moving average (EMA).
The 20-day EMA measures an asset’s average price over the past 20 trading days, weighing recent prices to identify short-term trends.
When an asset’s price climbs above the moving average, it is seen as a bullish signal, suggesting that the price is trending upwards and may continue to rise as market sentiment improves.

If the MNT price rally continues, its value could break above the resistance at $1.29 and head toward its all-time high of $1.51; last reached in April.
On the other hand, if selling pressure gains momentum, this bullish outlook would be invalidated. In that scenario, MNT’s price could drop to $1.11.
Disclaimer: The views in this article are from the original Creator and do not represent the views or position of Hawk Insight. The content of the article is for reference, communication and learning only, and does not constitute investment advice. If it involves copyright issues, please contact us for deletion.