Onyxcoin (XCN) Tanks 22% as Traders Bet Against a Rebound
XCN decline deepens as the price drops 22%, driven by negative funding rates and low open interest, with further losses possible.
- Onyxcoin (XCN) drops 22%, hitting a 30-day low, as bearish sentiment dominates the market.
- Persistent negative funding rates and declining open interest signal continued bearish pressure on XCN.
- If the downtrend persists, XCN’s price may fall to $0.011, with a possible rebound to $0.022 if buying activity returns.

Onyxcoin (XCN) has extended its losing streak, plunging another 22% in the last 24 hours. It now trades at a 30-day low of $0.015.
With a growing bearish bias toward the altcoin, its price may continue to drop. This analysis explains why.
Onyxcoin Traders Remain Bearish
XCN’s persistent negative funding rate is a major indicator of the bearish bias against it. According to Coinglass, the altcoin’s funding rate has been predominantly negative since December 9. At press time, this stands at -0.17%.
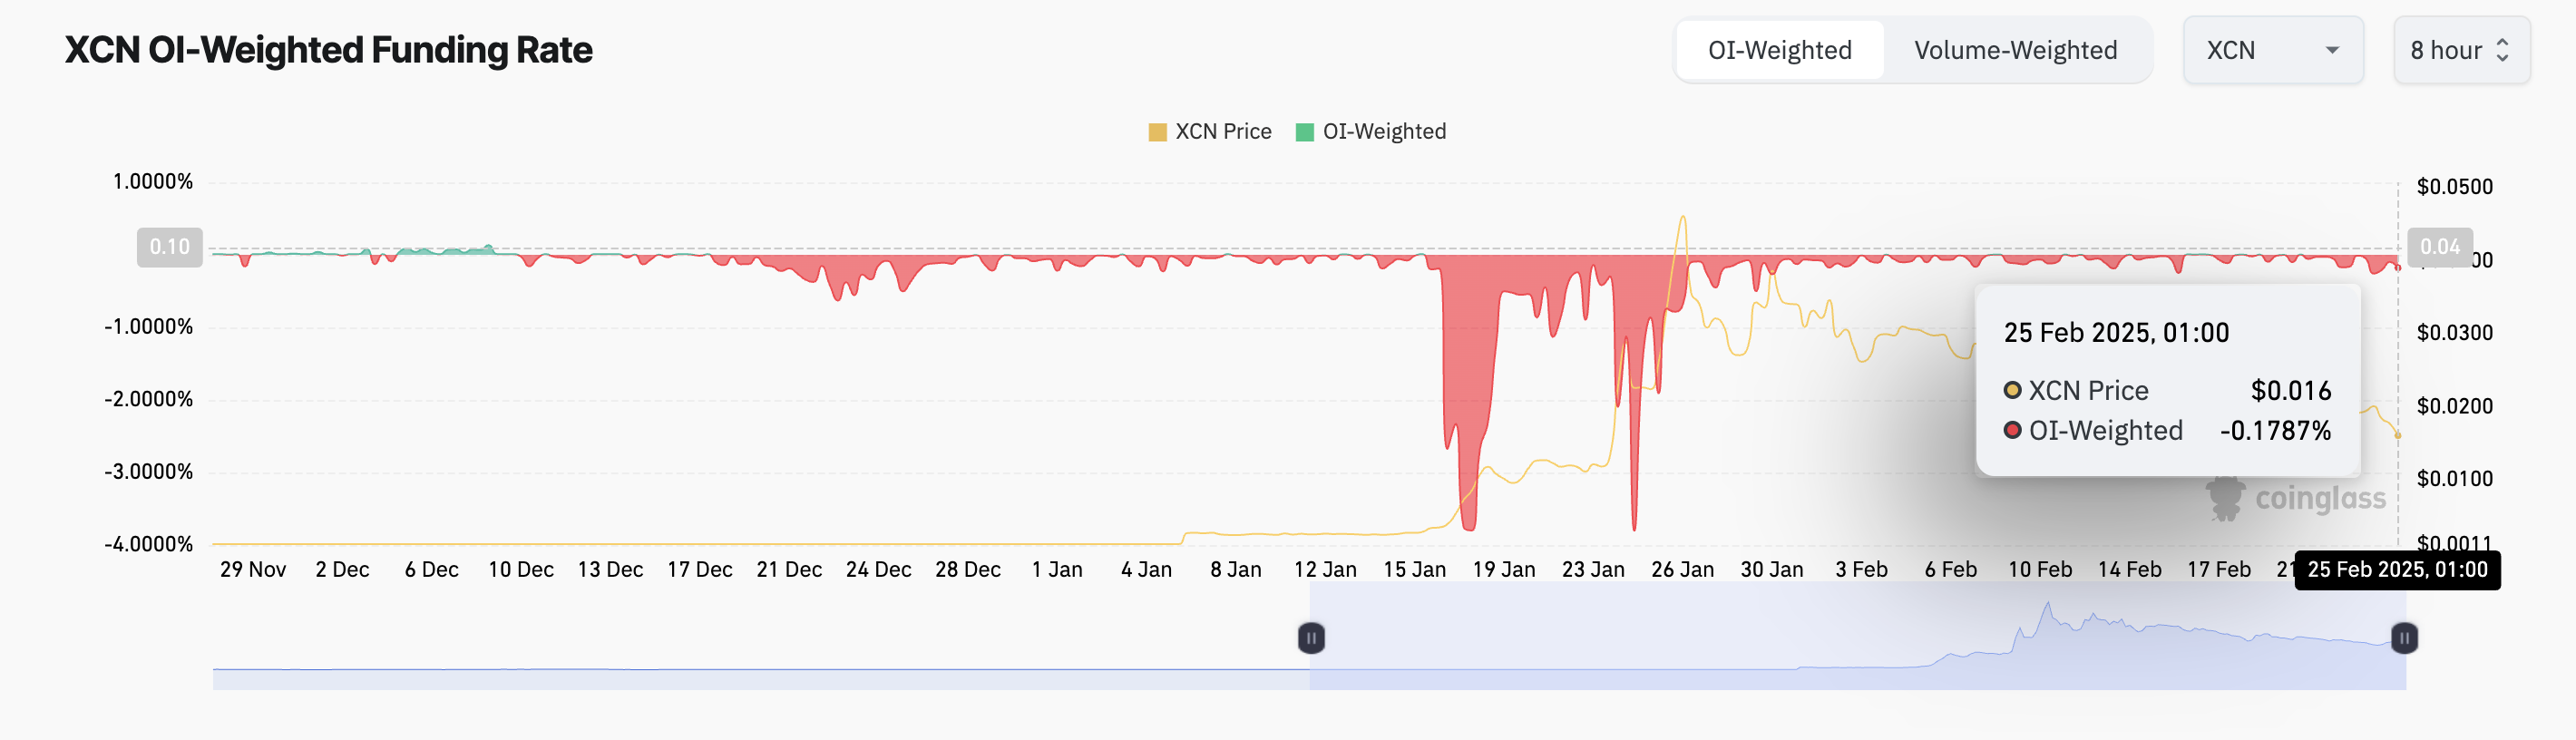
The funding rate is a periodic fee exchanged between long and short traders in perpetual futures contracts to keep prices aligned with the spot market. When it is negative, short traders are paying long traders. This indicates that most XCN traders are bearish and expect further price declines.
In addition, XCN’s open interest has been in a downward trend, highlighting the poor demand for the altcoin among market participants. Per Coinglass data, as of this writing, it stands at $6 million, marking its lowest level in 30 days.
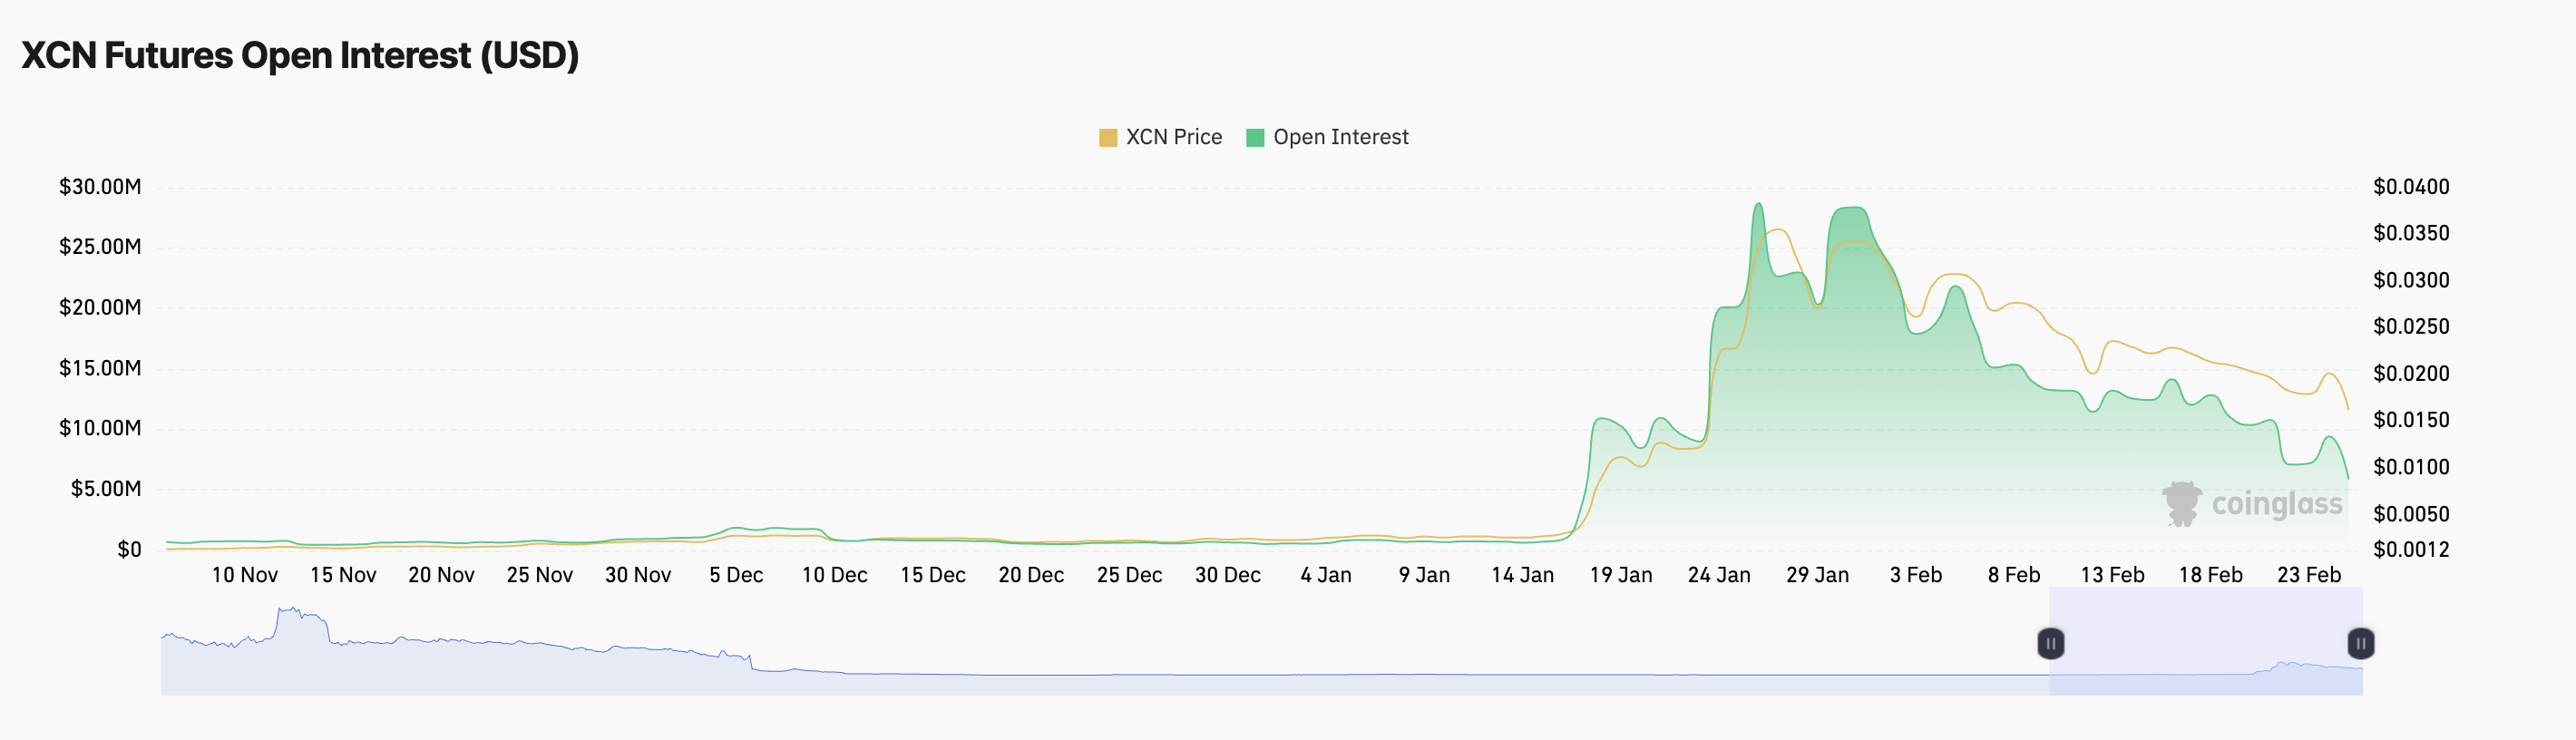
An asset’s open interest measures the total number of its outstanding derivative contracts, such as futures or options, that have not been settled. When it falls alongside the asset’s price, as in XCN’s case, it indicates weakening market participation, with traders closing their positions rather than opening new ones.
This indicates that XCN’s price decline is driven by liquidation or profit-taking rather than fresh short-selling, reducing the likelihood of a sharp short-term rebound.
Bearish Clouds Loom Over XCN
On the daily chart, XCN trades below the Leading Spans A and B of its Ichimoku Cloud indicator. This momentum indicator measures an asset’s market trends and identifies potential support/resistance levels. When an asset falls below this cloud, the market is in a downtrend.
In this case, the cloud acts as a dynamic resistance level for XCN. It confirms the likelihood of its continued price decline as long as the price remains below the cloud and demand continues to drop. If this trend persists, XCN’s value could dip to $0.011.
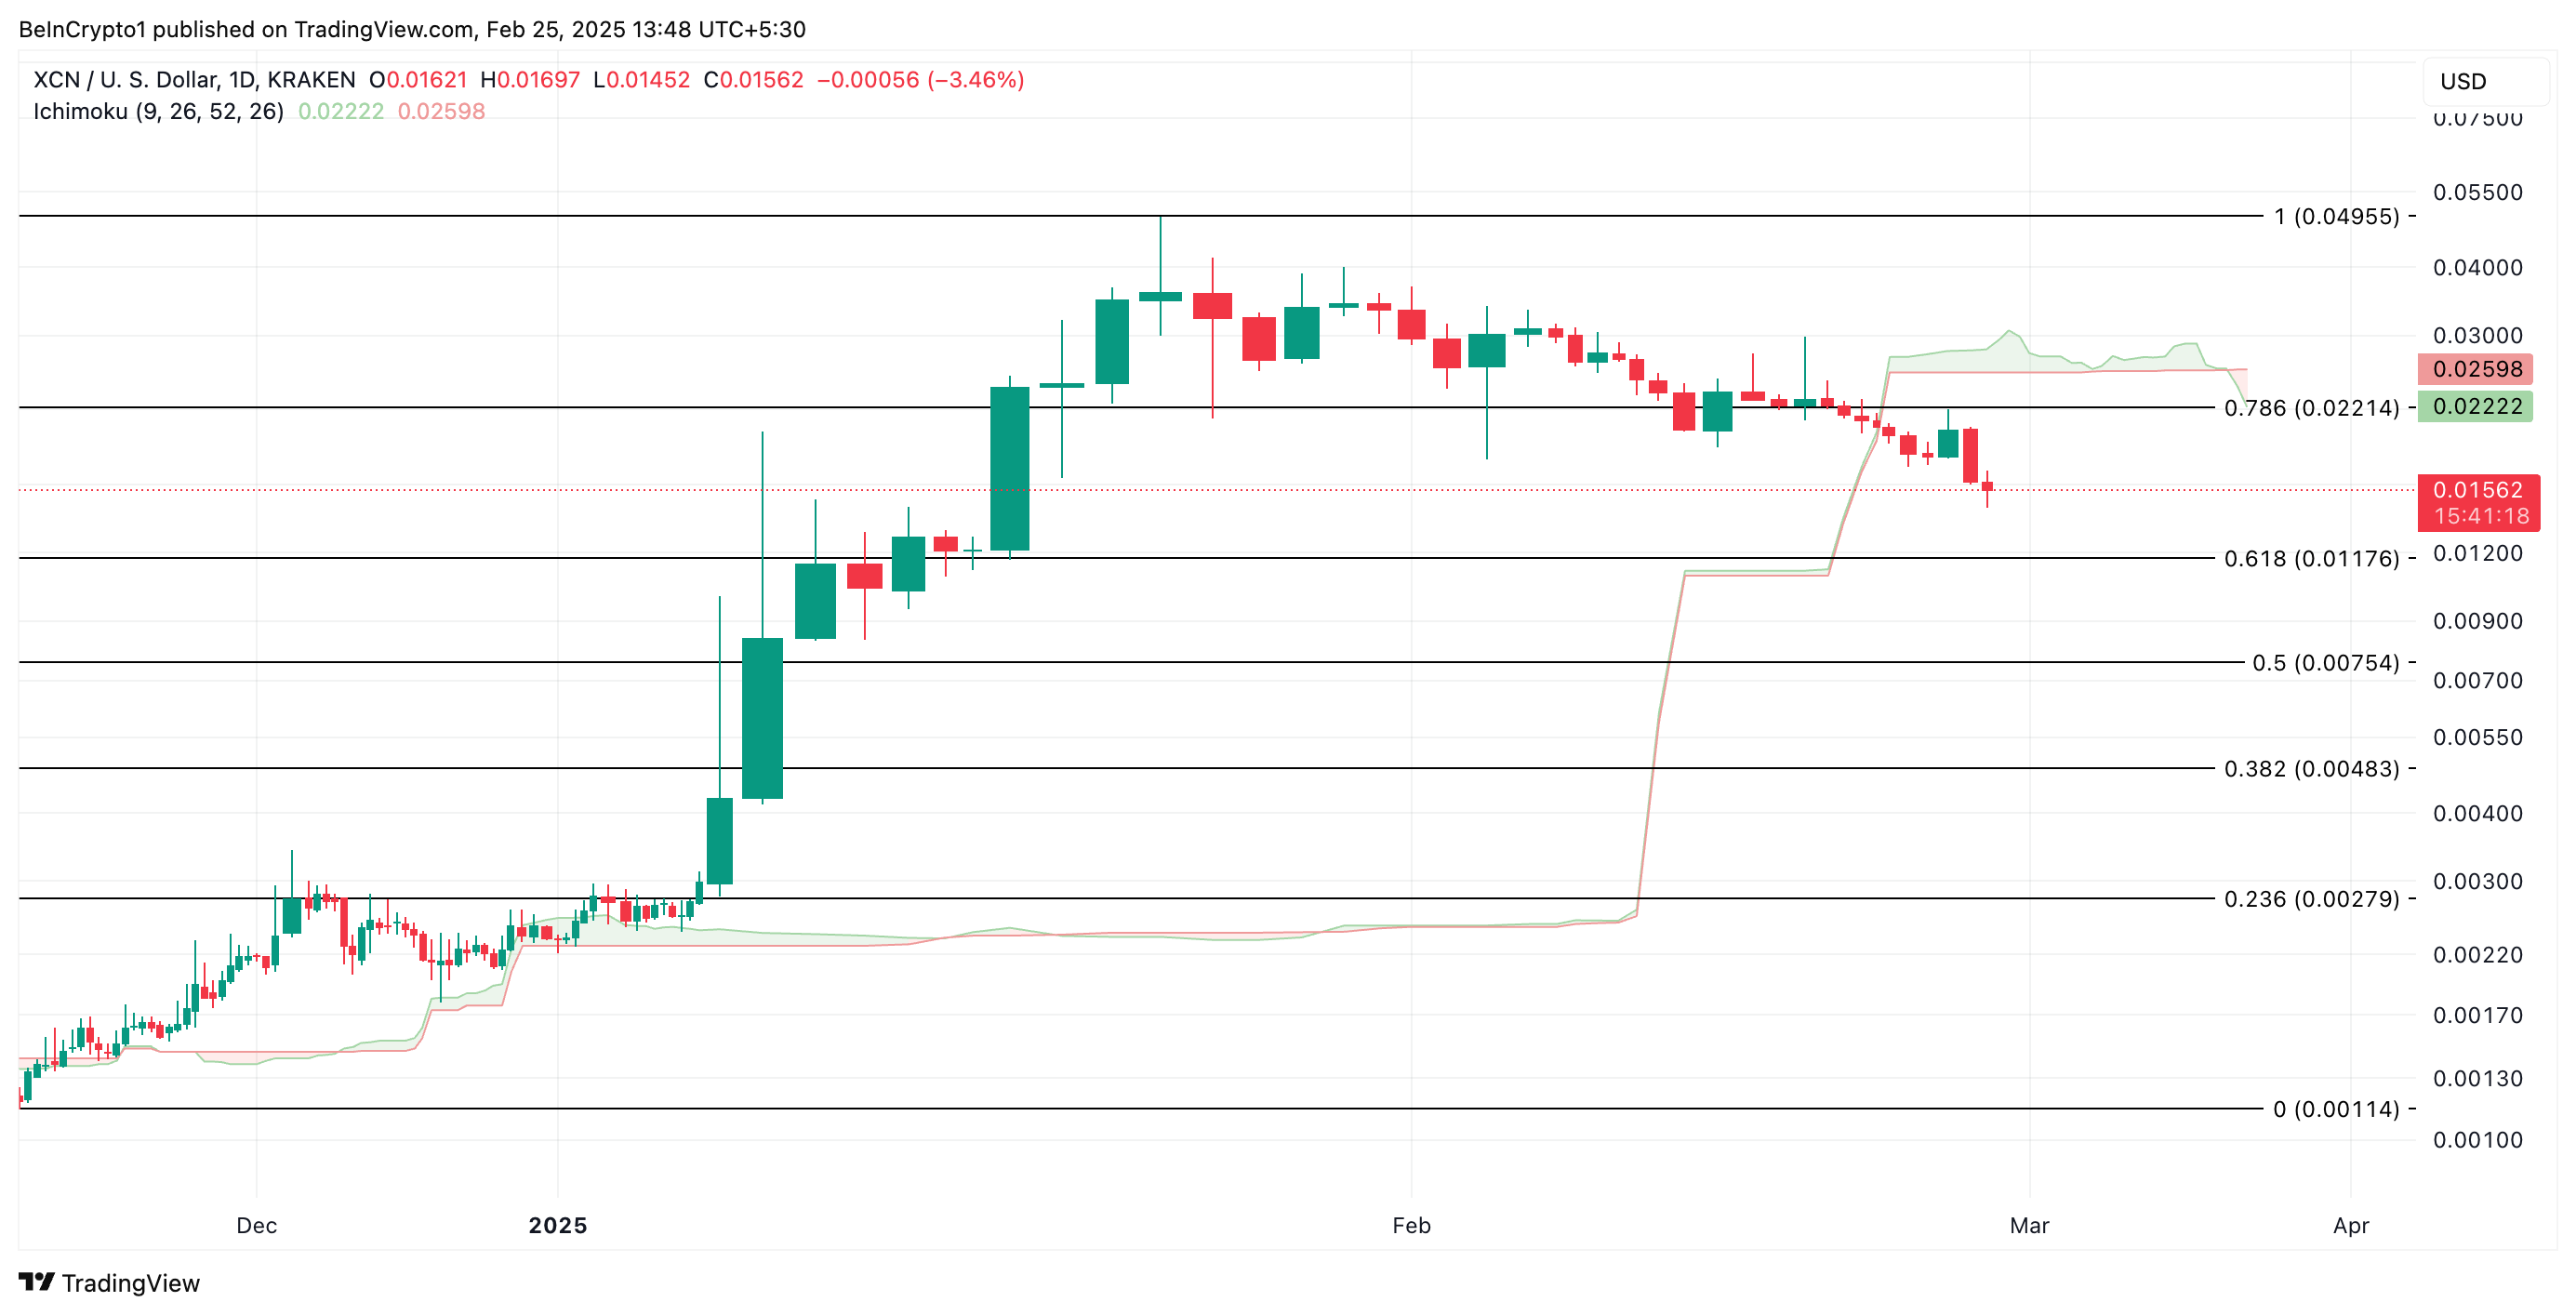
On the other hand, if buying activity resumes, XCN’s value could rocket to $0.022.
Disclaimer: The views in this article are from the original Creator and do not represent the views or position of Hawk Insight. The content of the article is for reference, communication and learning only, and does not constitute investment advice. If it involves copyright issues, please contact us for deletion.


