The AUSUSD is moving sharply lower on risk-off selling with technical breaks contributing
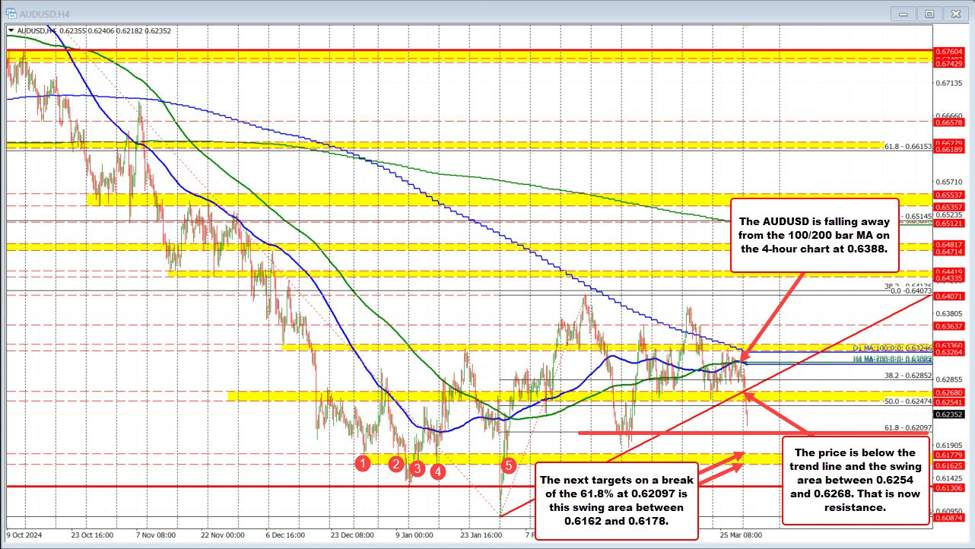
The AUDUSD chart is displaying a clear bearish trend, with the pair falling away from the 100/200 bar MA on the 4-hour chart at 0.6388.

The AUDUSD chart is displaying a clear bearish trend, with the pair falling away from the 100/200 bar MA on the 4-hour chart at 0.6388. This indicates a potential continuation of the downtrend, and traders should be aware of the key levels that may influence price action.
The price is now below the trend line and the swing area between 0.6254 and 0.6268, which is now acting as resistance. This level may attract sellers, and a rejection from this area could lead to further downside.
On the other hand, the next targets on a break of the 61.8% at 0.62097 is the swing area between 0.6162 and 0.6178. A break below this level could confirm the downtrend and lead to further losses.
Key Levels:
Resistance: The price is now below the trend line and the swing area between 0.6254 and 0.6268, which is now resistance.
Support: The next targets on a break of the 61.8% at 0.62097 and then a swing area between 0.6162 and 0.6178.
The video above will outline all the key levels and explain the importance for today and going forward.
Disclaimer: The views in this article are from the original Creator and do not represent the views or position of Hawk Insight. The content of the article is for reference, communication and learning only, and does not constitute investment advice. If it involves copyright issues, please contact us for deletion.