3 Obstacles That Could Prevent Cardano (ADA) Price from Hitting $0.40
Cardano's (ADA) price could face obstacles in reaching $0.40 due to a decrease in active addresses and high liquidity concentrations at $0.33.
- Cardano's active addresses surged on September 6, but have since dropped, indicating waning interest and potential declines.
- Dats shows that ADA's liquidity heatmap shows dense liquidity at $0.33, which could be pivotal in shaping its price trends.
- Despite a recent price jump to $0.34, the bearish MACD divergence points to a likely price reversal toward $0.30.
Last Friday marked the fifth day since the successful completion of the Chang hard fork, which was overshadowed by significant sell-offs and a decline in Cardano’s (ADA) price. Despite this, active addresses on the blockchain surged to a six-month high, signaling a potential bullish outlook as ADA briefly touched $0.35.
However, the situation has since shifted, and the token now faces challenges that may prevent it from trading higher in the near term.
Cardano Users Are Slow to Embrace Recent Changes
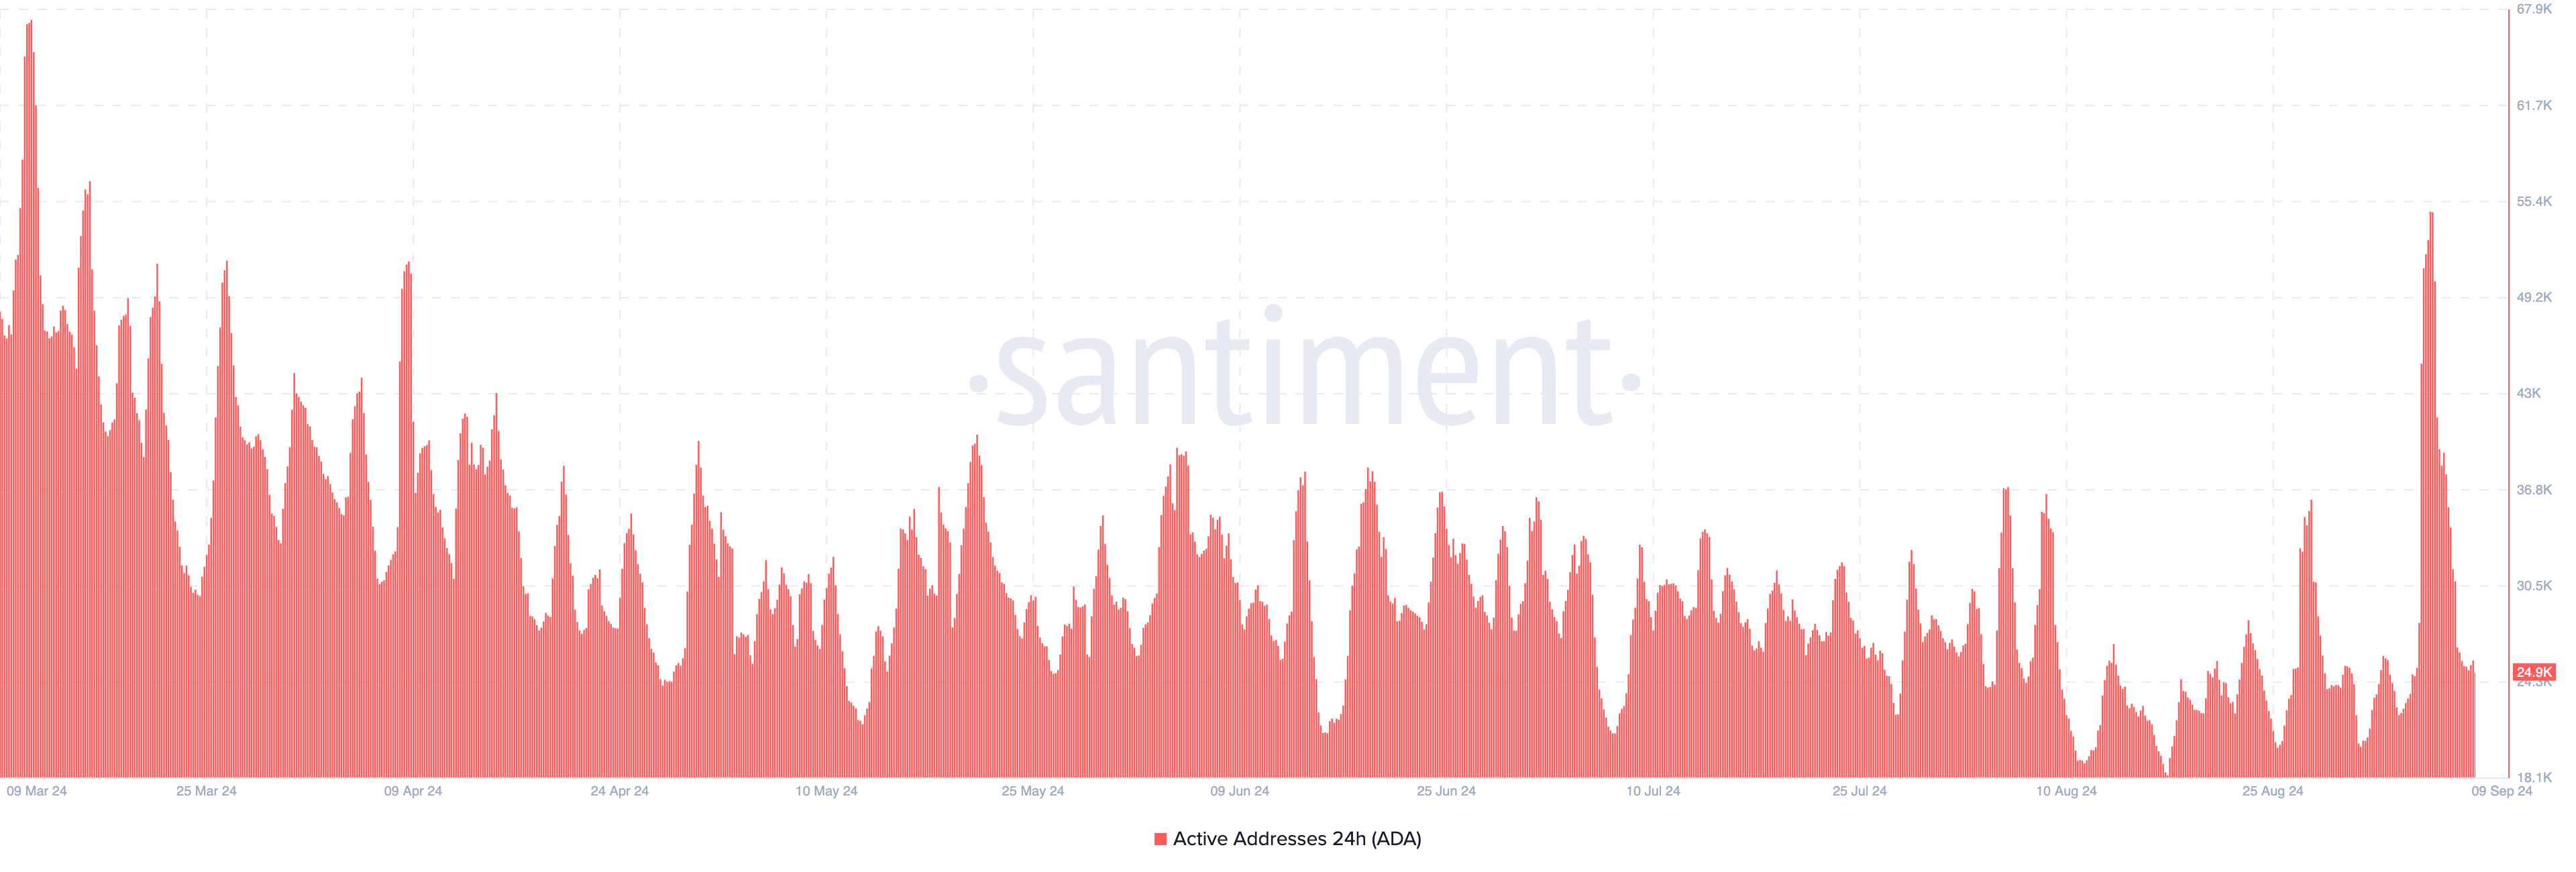
Using Santiment’s on-chain data, BeInCrypto reported that Cardano’s active addresses surged to 54,800 on September 6, indicating a delayed positive response to the Chang hard fork and fueling predictions that ADA’s price could approach $0.40.
However, 24-hour active addresses have since dropped to 24,900, reflecting a decline in user interest and engagement within the Cardano ecosystem. This sharp decrease suggests that the network’s improvements have not yet resonated with users. If this trend continues, it could lead to further declines in Cardano’s price.
Read more:6 Best Cardano (ADA) Wallets You Should Consider in September 2024
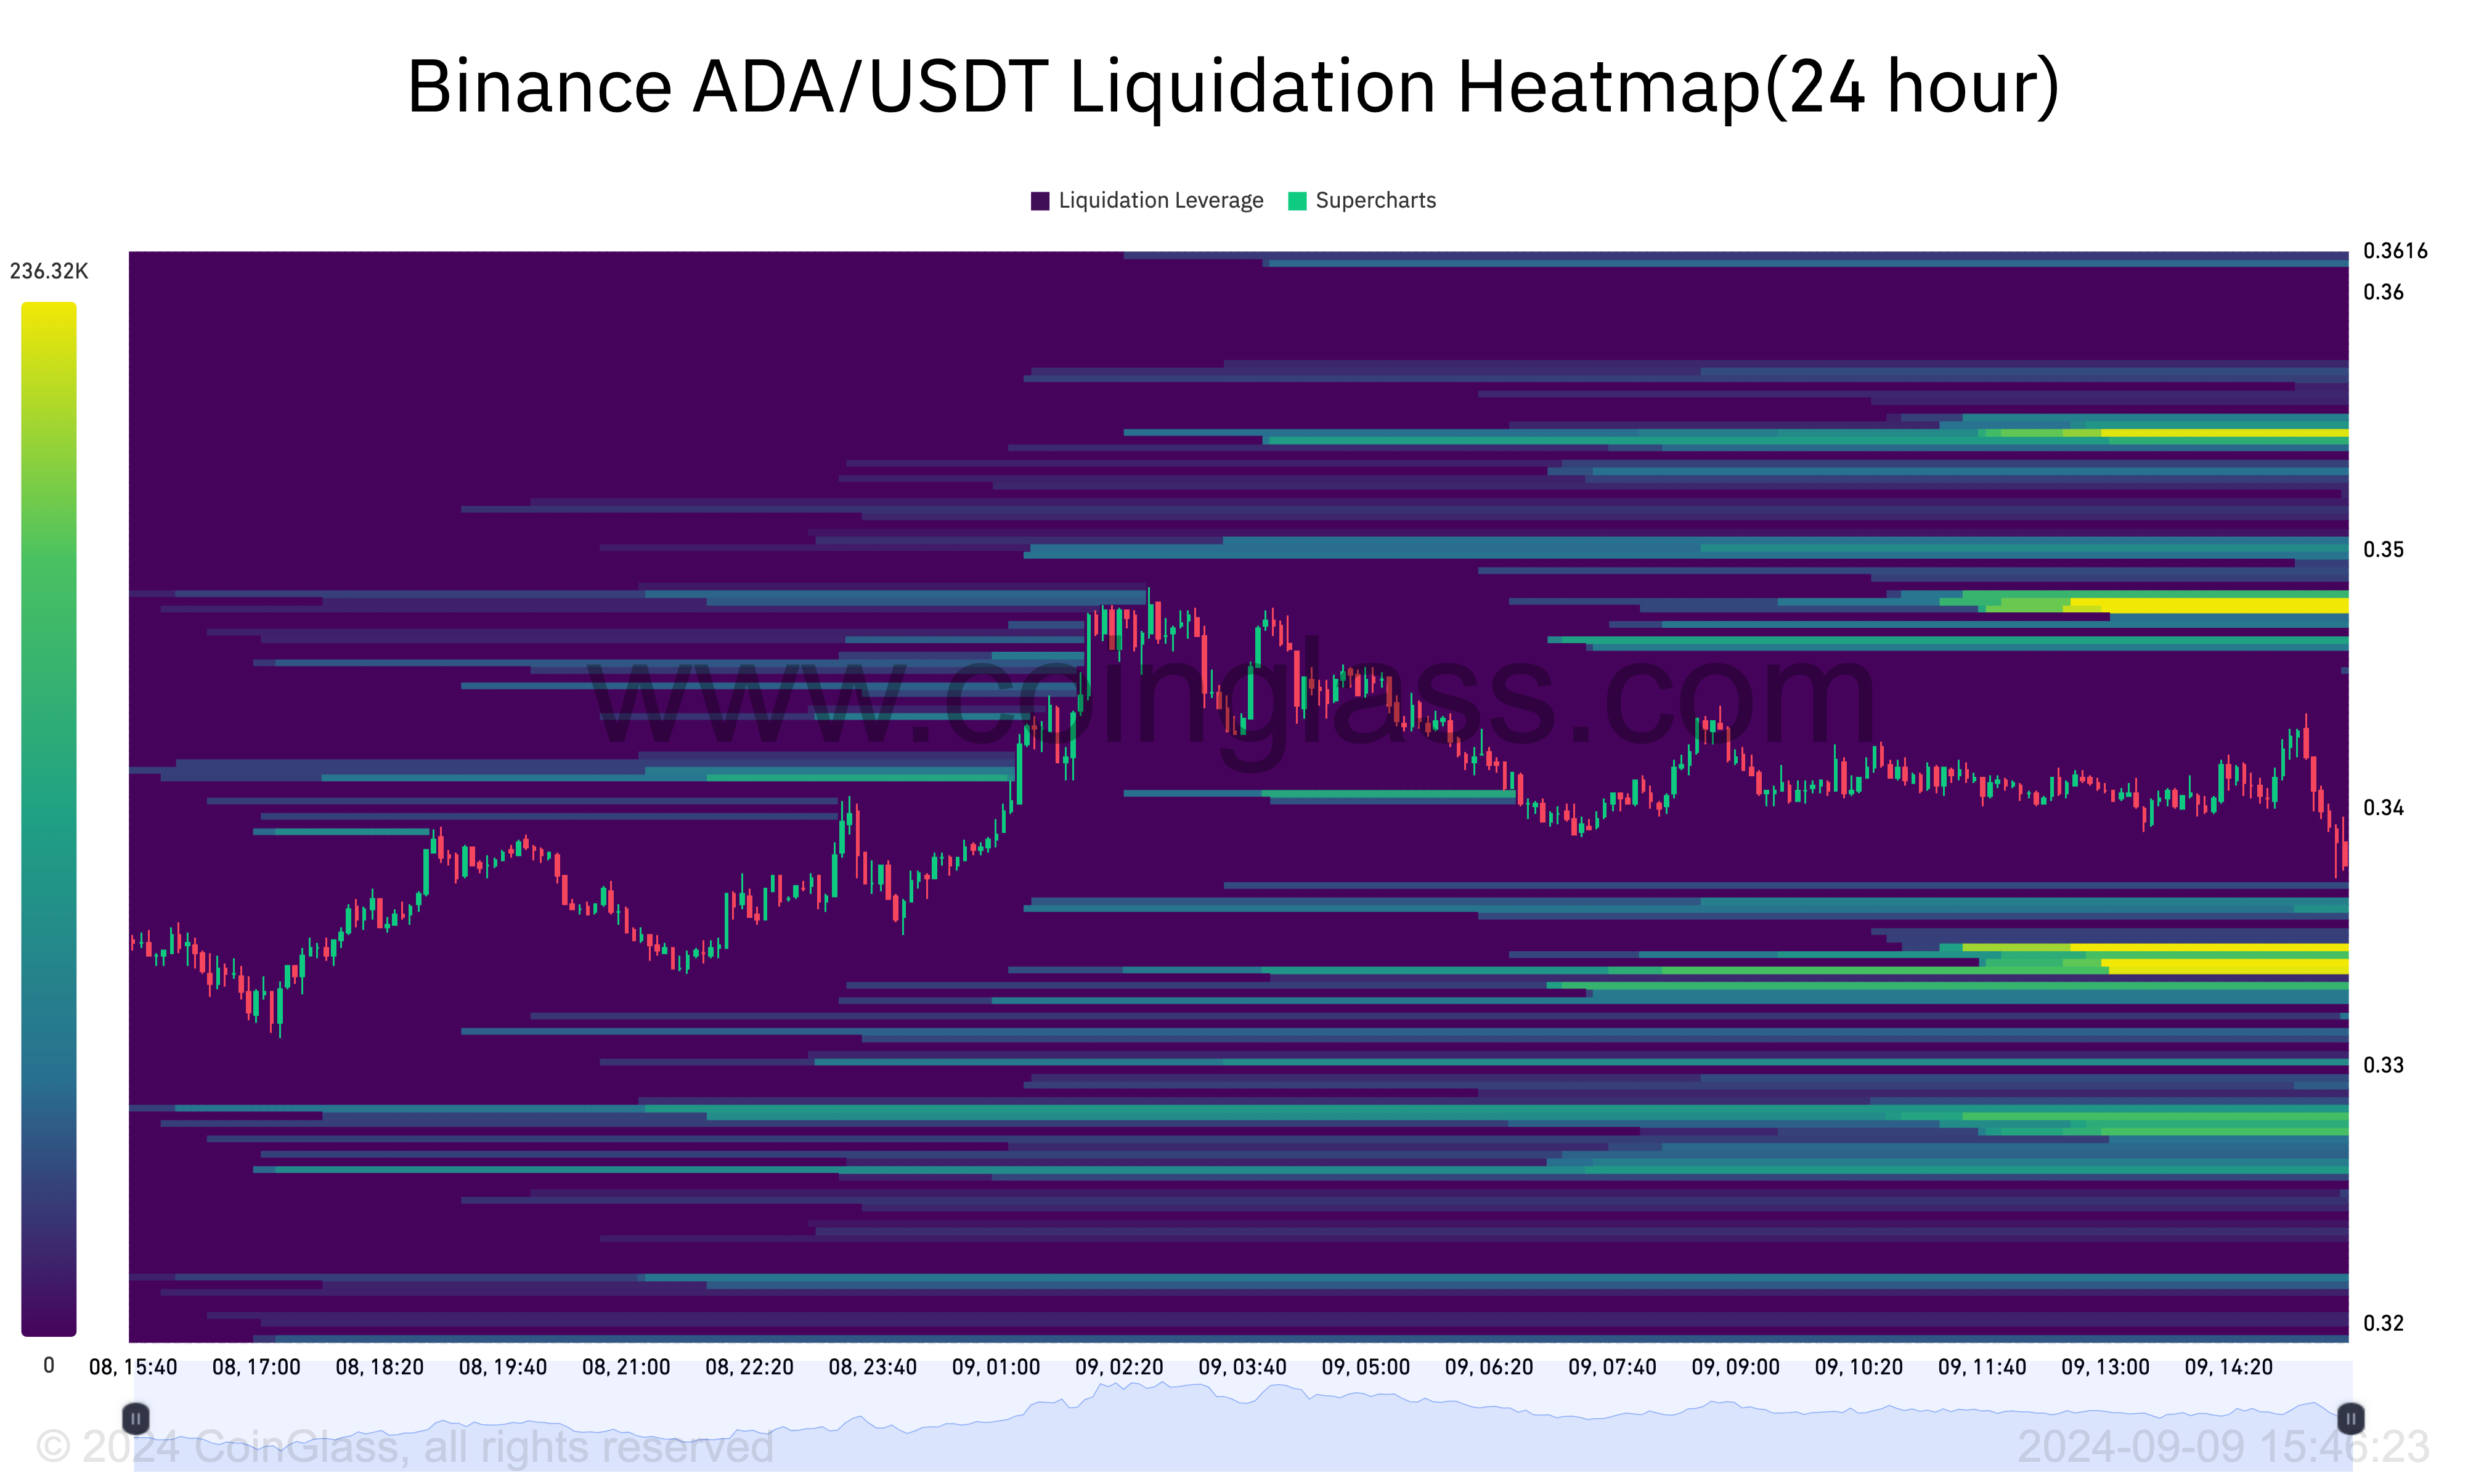
The liquidation heatmap, which spots specific levels where the price might move, supports this outlook. In simple terms, the heatmap identifies these levels of high liquidity by changing color from purple to yellow.
Thus, if there is a high concentration of liquidity at a point, then a cryptocurrency’s price might exert significant pressure to reach that level. In Cardano’s case, the liquidation heatmap shows many buy and sell orders at $0.33, $0.34, and $0.35.
However, the chart below shows that the $0.33 region appears to have the highest liquidity. As such, Cardano’s price is likely to drop in that region.
ADA Price Prediction: The Dilemma Continues
On the daily chart, Cardano’s price has formed a bearish divergence with the Moving Average Convergence Divergence (MACD) indicator, which measures momentum. A bearish divergence occurs when the MACD’s trend does not align with the price movement. Recently, ADA jumped to $0.34 following an increase between August 25 and September 6.
However, the negative MACD reading indicates that the buying volume does not support the uptrend. Therefore, a price reversal could be next. Using the Fibonacci retracement indicator, ADA’s price might attempt to retest $0.35 again. This is likely to be resisted in the same region.
Read more:How to Achieve EVM Compatibility in Non-EVM Blockchains
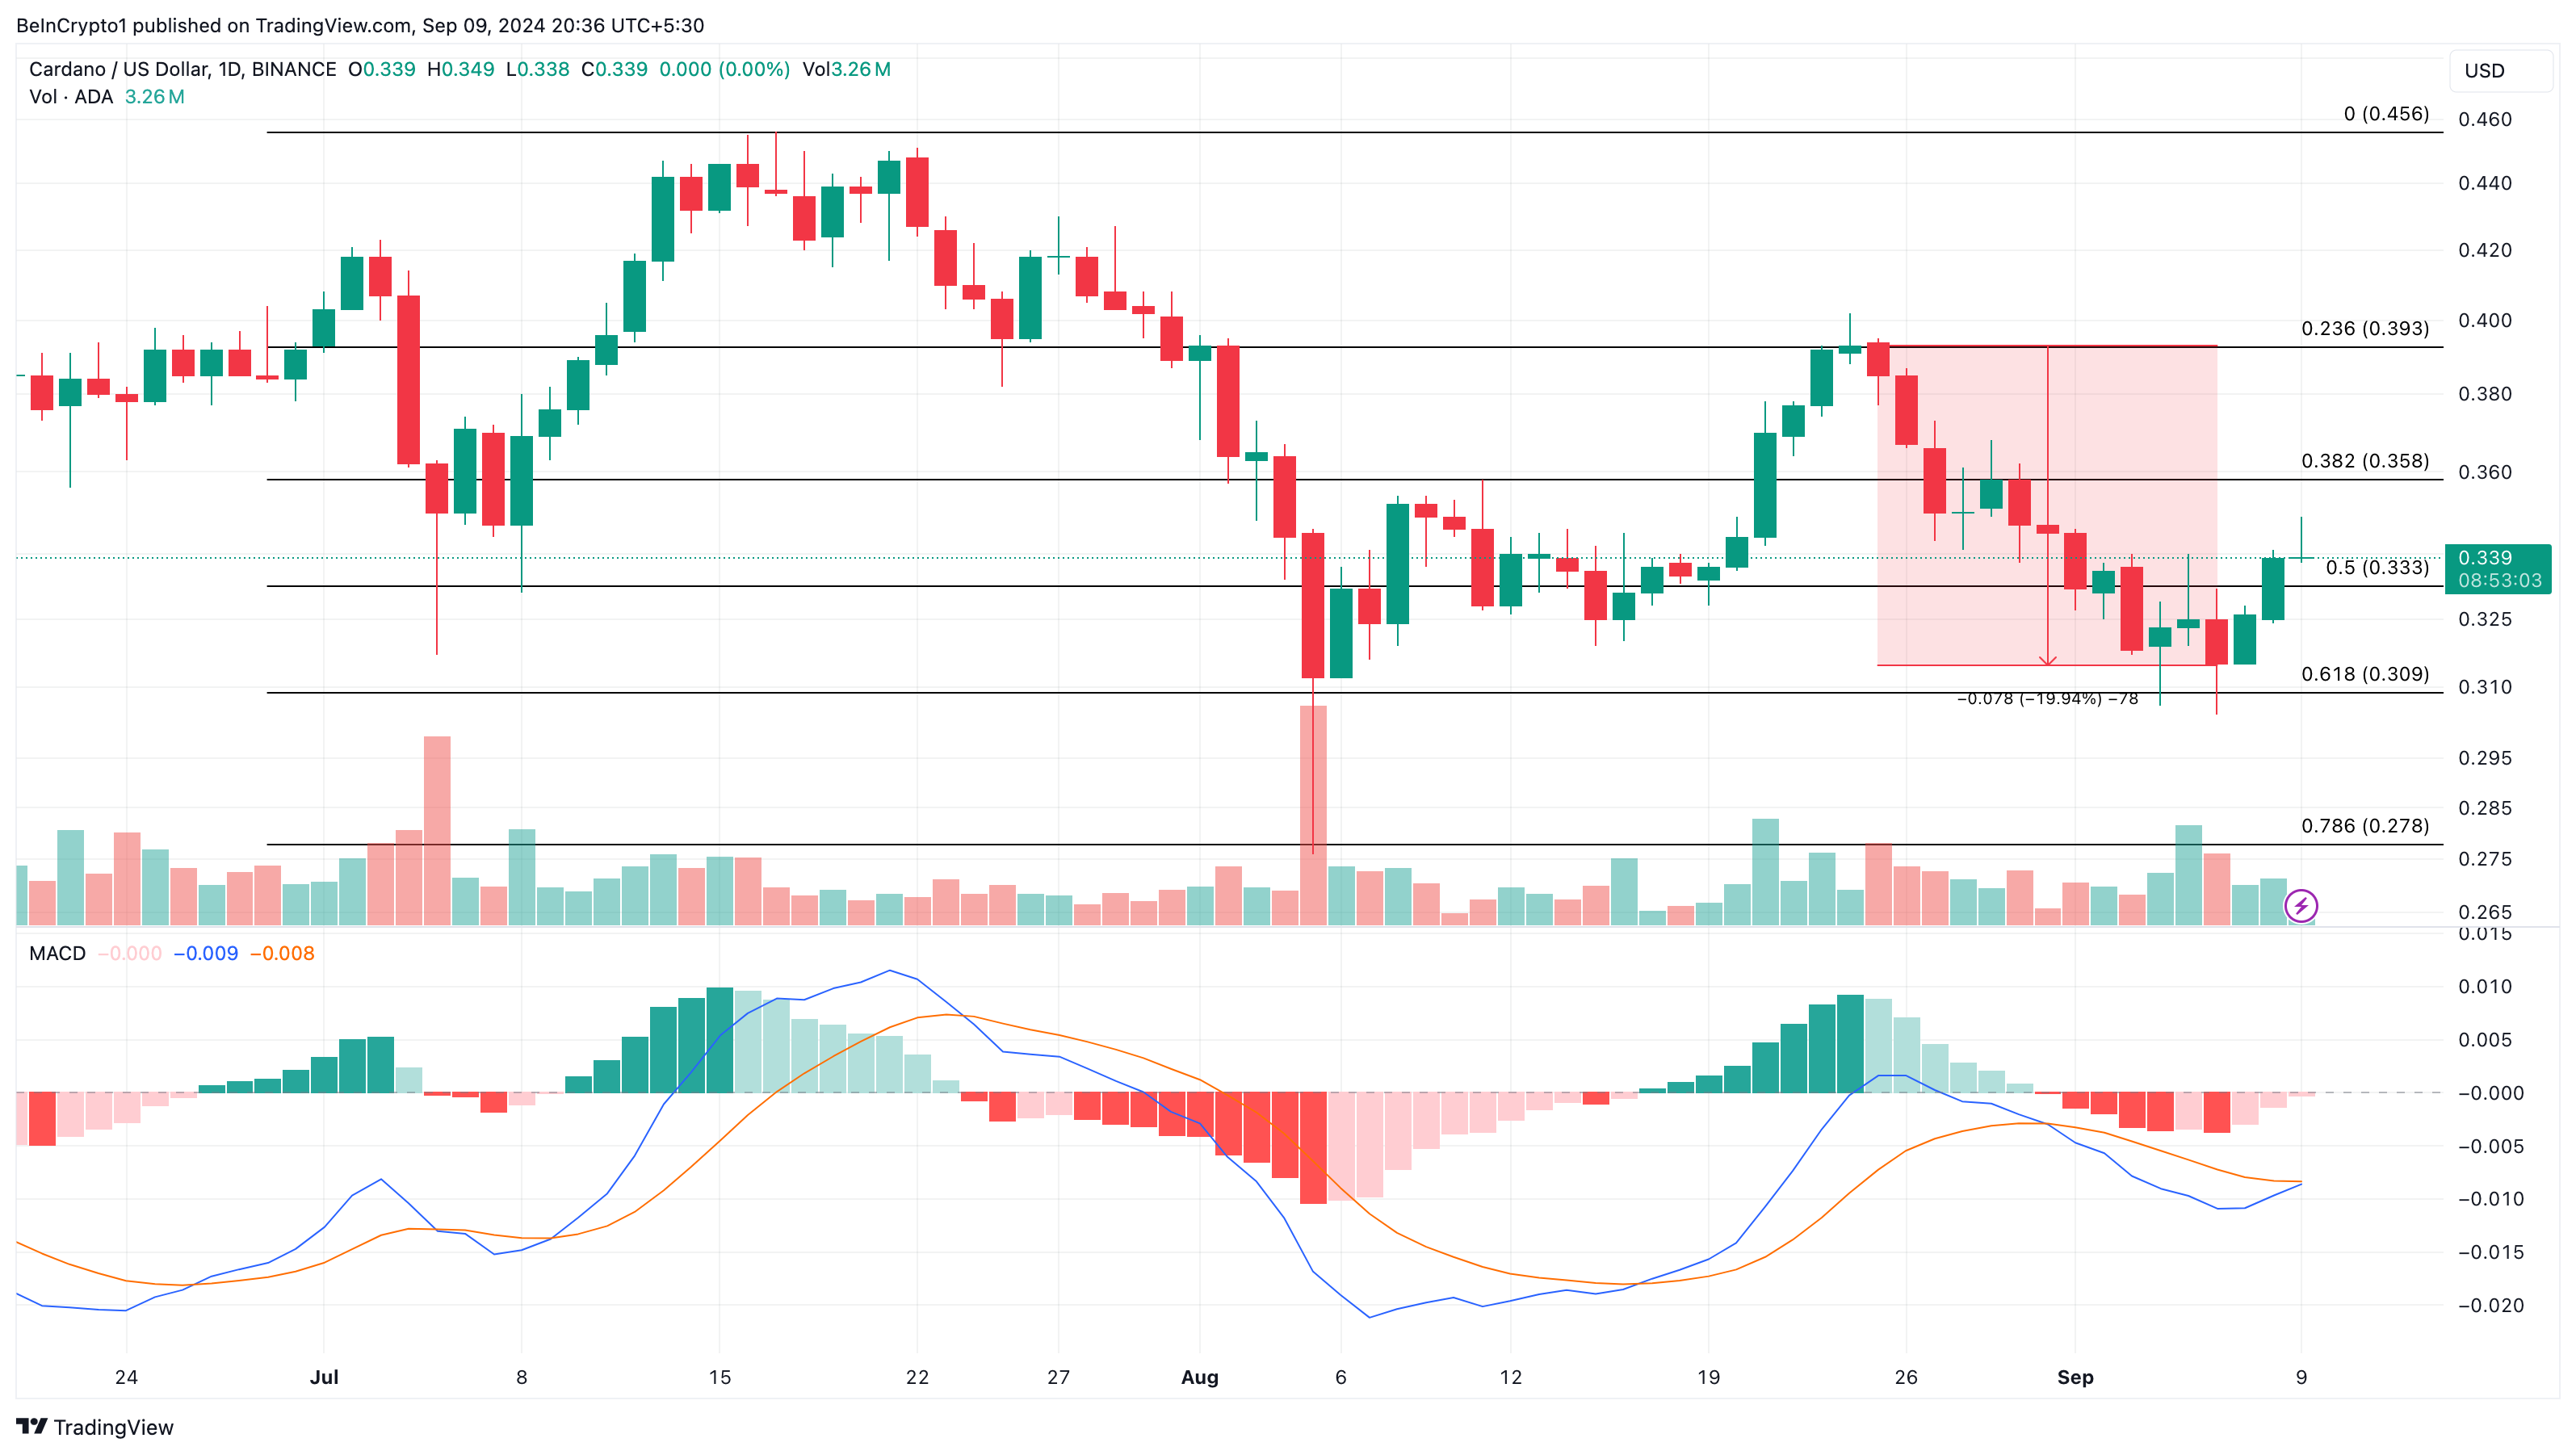
As such, a drop to $0.30 might come to pass. This prediction will, however, be invalidated if the momentum becomes extremely bullish. If that happens, Cardano might climb to $0.39.
Disclaimer: The views in this article are from the original author and do not represent the views or position of Hawk Insight. The content of the article is for reference, communication and learning only, and does not constitute investment advice. If it involves copyright issues, please contact us for deletion.


