USDCAD Technical Analysis – We are back to the bottom of the range
Fundamental Overview . . The USD yesterday weakened across the board following soft US Jobless Claims and ISM Services PMI reports.
FundamentalOverview
The USD yesterday weakenedacross the board following soft US Jobless Claims and ISM Services PMI reports. Overall, the data didn’tchange much in terms of interest rates expectations, but it reinforced the viewthat the Fed is going to deliver at least two rate cuts by the end of the year.
The CAD, on the other hand,has been under pressure mainly due to the US Dollar strength last week whichhas been influenced more by quarter-end flows rather than somethingfundamental. This week, the US Dollar is back on the defensive as the marketcontinues to trade the soft-landing narrative.
Last week, the Canadian CPI surprised to the upside, with theunderlying inflation measures risingbut remaining within the 1-3% target band. This made the market to pare back rate cutsexpectations with the probabilities now standing around 57% for no change. Wewill get another inflation report before the next BoC policy decision, but ifwe see another jump in wage growth tomorrow, then the central bank will likelyneed very good CPI figures to deliver a rate cut in July.
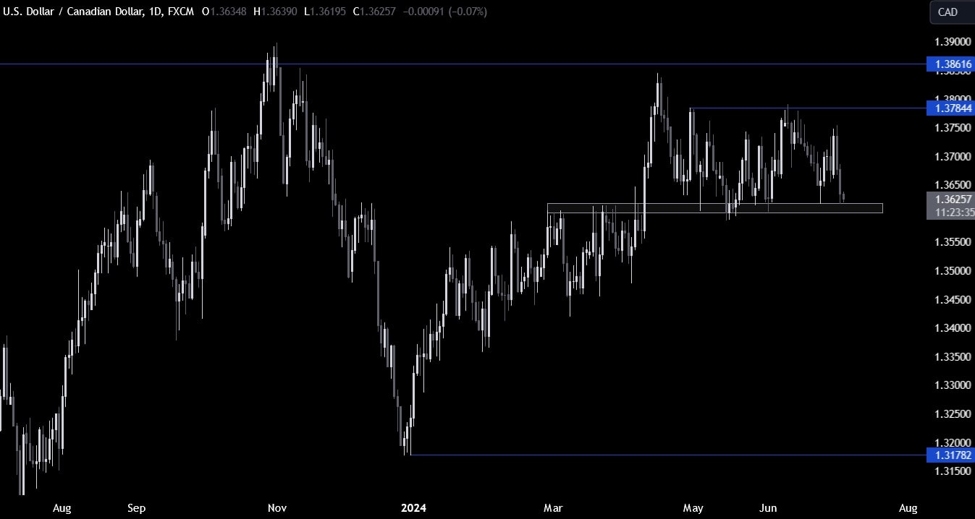
USDCADTechnical Analysis – Daily Timeframe
On the daily chart, we cansee that USDCAD is now back at the key 1.36 support zone. Again, we can expect the buyers to stepin with a defined risk below the support to position for a rally back into the1.3785 resistance. The sellers, on the other hand, will want to see the pricebreaking lower to pile in more aggressively and target a drop into the 1.34handle next.
USDCAD TechnicalAnalysis – 4 hour Timeframe
On the 4 hour chart, we cansee that the price action remains rangebound between the 1.36 support and the1.3785 resistance. There’s not much to do here and the market participants willlikely keep on “playing the range” until we get a breakout.
USDCAD TechnicalAnalysis – 1 hour Timeframe
On the 1 hour chart, we cansee that we have a downward minor trendline defining the current bearishmomentum. The buyers will want to see the price breaking higher and rally abovethe 1.3643 level to increase the bullish bets into the 1.3785 resistance.
The sellers, on the otherhand, will likely lean on the trendline to position for a downside breakoutwith a defined risk above the 1.3642 level. The red lines define the average daily range for today.
UpcomingCatalysts
Tomorrow we conclude the week with the US NFP and the Canadian labour marketreport.
Disclaimer: The views in this article are from the original author and do not represent the views or position of Hawk Insight. The content of the article is for reference, communication and learning only, and does not constitute investment advice. If it involves copyright issues, please contact us for deletion.


