SushiSwap (SUSHI) Targets $0.85 as Demand Picks Up
SUSHI has broken above the upper trend line of its descending channel, suggesting a spike in buying activity.
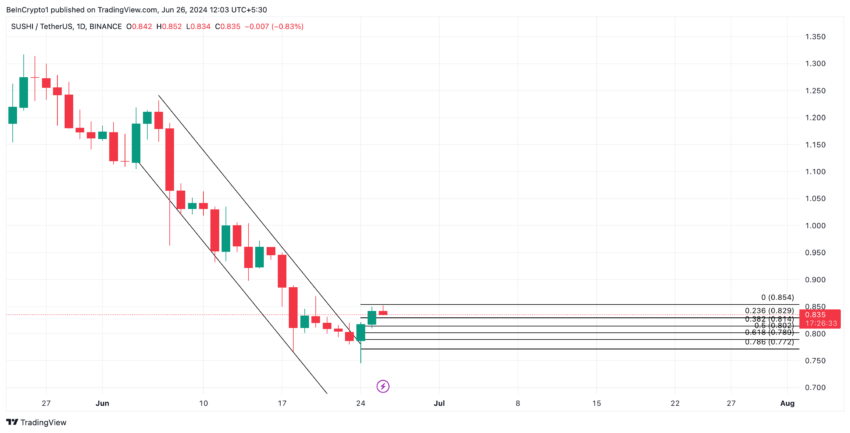
- SUSHI traded within a descending channel between June 6 and 23, signaling a spike in token distribution.
- Its price has crossed above the upper trend line of this channel, suggesting that buying activity is gaining momentum.
- If this trend continues, the token’s price will rally to $0.85.

SUSHI, the token that powers SushiSwap, an automated market maker (AMM), witnessed a price decline between June 6 and 23. The altcoin’s value decreased by 42% during that period to form a descending channel.
By June 23, selling pressure had weakened, paving the way for the bulls to re-enter. Buying momentum has since spiked, pushing the token’s value above the upper line of the descending channel.
SushiSwap Presents a Buying Opportunity
A descending channel is formed when an asset’s price creates a series of lower highs and lower lows over a period of time. It is a bearish signal that confirms sustained selling pressure.
The upper line of this channel acts as resistance, while the lower line represents support. For SUSHI, it faced resistance at $1.24 and found support at the $0.74 price level.
When an asset’s price crosses above the upper line of this channel, it is a bullish signal. It means that the downtrend might be losing momentum, and the price could trend higher. Traders often interpret this crossover as a buying opportunity.
Readings from SUHSI’s Market Value to Realized Value (MVRV) ratio confirm that now might be a good time to buy the altcoin.
SUSHI’s MVRV ratios, calculated using 30-day and 365-day moving averages, are -23.56% and -30.67%, respectively, at the time of writing.
Read More:How To Use SushiSwap: A Step-by-Step Guide
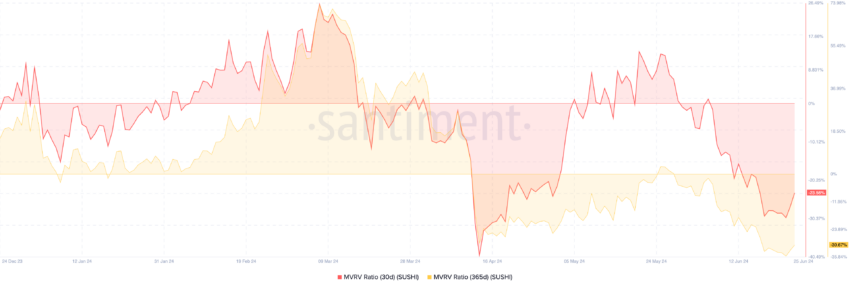
MVRV ratio tracks the ratio between an asset’s current market price and the average price at which each coin or token was acquired.
When the MVRV ratio is above one, the asset is overvalued. This means that its current market value is higher than the average purchase price for most investors.
On the other hand, when an asset’s MVRV ratio is below zero, it signifies that the asset is undervalued. This suggests that its current price is lower than the average purchase price of all its circulating tokens.
Many interpret a negative MVRV as a buy signal because it means the asset trades at a discount relative to its historical cost basis.
While some buying activity may have begun, the SUSHI market remains dominated by negative sentiments. As of this writing, the token’s weighted sentiment is -0.41.
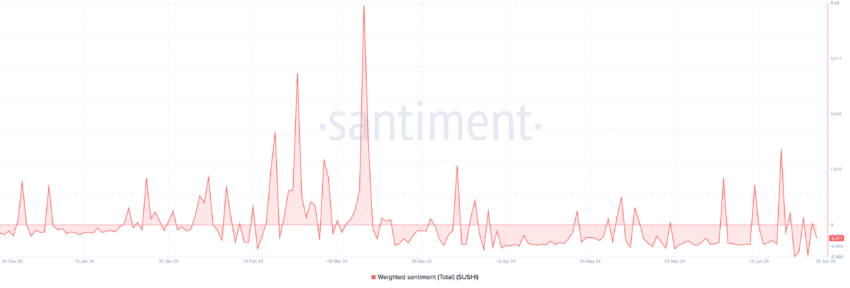
This metric tracks an asset’s positive and negative mentions across social media platforms. When its value is negative, it means that most of the asset’s mentions convey feelings of doubt and caution. This often precedes a further decline in an asset’s price.
SUSHI Price Prediction: Sellers Are Not Ready To Back Down
As of this writing, SUSHI trades at $0.83. Although the altcoin has witnessed a surge in buying activity in the past two days, the bearish bias toward it is still significant.
For example, the negative readings from its Chaikin Money Flow (CMF) show that SUHSI holders are still taking more money out of the market than they send into it.
At press time, SUSHI’s CMF is -0.14. This indicator measures how money flows into and out of an asset. A negative CMF value suggests liquidity exit and is often a precursor to a sustained price decline.
Further, SUSHI’s Relative Strength Index (RSI) is below its 50-neutral line. This indicator measures oversold and overbought market conditions by tracking an asset’s price changes.
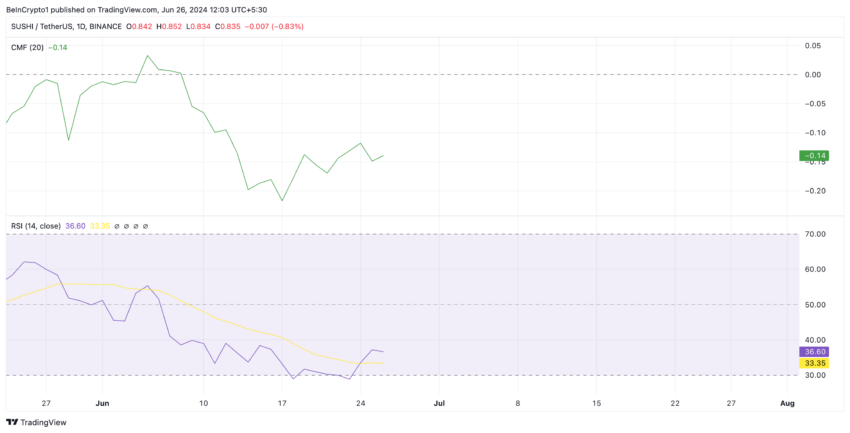
It ranges between 0 and 100. Values above 70 signal that the asset is overbought and due for a decline. Conversely, values below 30 suggest the asset is oversold and may be due for a rebound.
At 36.77 at press time, SUSHI’s RSI shows that the demand for the token is considerably lower than its supply. It suggests that selling activity outweighs buying pressure.
If this trend continues, SUSHI’s price might dip to trade at $0.82.
However, if buying momentum is sustained and the bulls regain complete control, they may be able to drive SUSHI’s price toward $0.85.
Disclaimer: The views in this article are from the original author and do not represent the views or position of Hawk Insight. The content of the article is for reference, communication and learning only, and does not constitute investment advice. If it involves copyright issues, please contact us for deletion.


