黄金技术分析 - 看涨势头正在回升
基本概述.黄金一直在关键水平附近波动 , 因为市场正在等待催化剂或关键技术突破以找到一些动力.
FundamentalOverview
Gold has been ranging near a key level as the market awaits a catalyst orkey technical breakouts to find some momentum. The bullish bias remains intactthough as we got some very good inflation data from the CPI and PPI last week which shouldsupport gold in the bigger picture as it will give the Fed more confidence tostart cutting rates at some point in the last part of the year.
The latest FOMC decision made things a bit murkier in the short term as it turnedout to be a bit more hawkish than expected, although Fed Chair Powell made it clear that theirforecasts can change as they remain very data dependent. As of now, it lookslike gold have limited downside but lots of upside as inflation abates slowlywhile risks to the growth picture increase the longer the Fed keeps policyrestrictive.
In the short-term, strong US data might weigh a bit on the market, but inthe long-term weak data is likely to trigger bigger upside moves.
GoldTechnical Analysis – Daily Timeframe
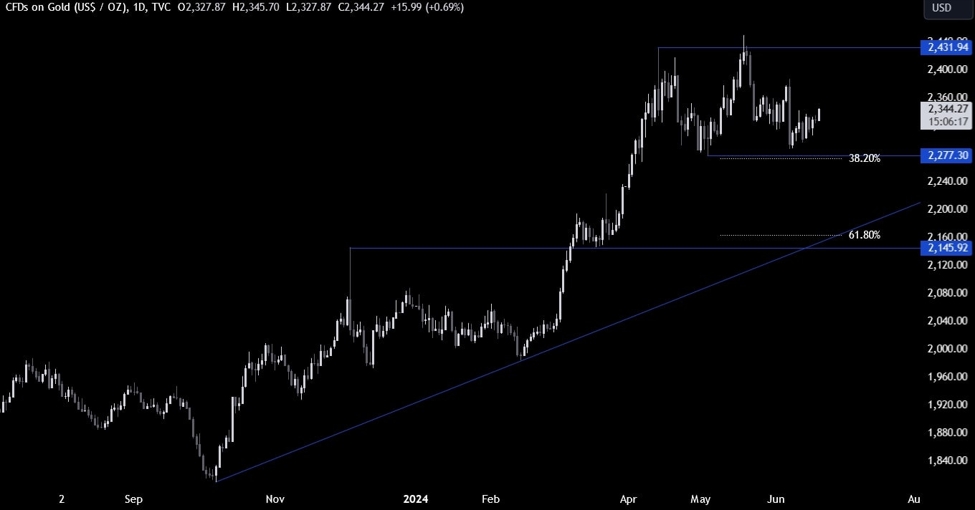
On the daily chart, we cansee that gold has been ranging around a key resistance zone around the 2325 level butmaintained the bullish bias. The buyers will need the price to break throughsome key technical levels on the lower timeframes to increase the upsidemomentum.
The sellers, on the otherhand, will want to see the price breaking below the key support at 2277 to increasethe bearish bets into the next support around the major trendline where we can also find the 61.8% Fibonacciretracement level for confluence.
Gold Technical Analysis– 4 hour Timeframe
On the 4 hour chart, we cansee more clearly the rangebound price action around the 2325 resistance zone,although the bullish momentum picked up recently with the price now testingthe trendline and the 61.8% Fibonacci retracement level.
This is where we can expectthe sellers to step in with a defined risk above the trendline to position fora break below the key support with a better risk to reward setup. The buyers,on the other hand, will want to see the price breaking higher to gain even moreconviction and increase the bullish bets into the 2387 level next.
Gold Technical Analysis– 1 hour Timeframe
On the 1 hour chart, we cansee that we have the upper bound of the average daily range for today standing right around thetrendline. Generally, the price doesn’t extend beyond these levels unless there’sa strong catalyst. If the US Jobless Claims today miss by a big margin, then wemight see a breakout, otherwise a pullback is more likely.
UpcomingCatalysts
Today we have the US Housing Starts, Building Permits and the latest USJobless Claims figures. Tomorrow, we conclude the week with the US PMIs.
See the video below
Disclaimer: The views in this article are from the original author and do not represent the views or position of Hawk Insight. The content of the article is for reference, communication and learning only, and does not constitute investment advice. If it involves copyright issues, please contact us for deletion.


