Hamster Kombat (HMSTR) Shows Signs of Recovery with New Layer-2 on TON
Hamster Kombat shows signs of recovery but faces uncertain trend strength. ADX and CMF indicators highlight mixed momentum.
- Hamster Kombat (HMSTR) gained over 10% in the past week, showing signs of recovery.
- ADX indicates weak trend strength at 21.5, suggesting uncertainty about the emerging uptrend.
- Positive CMF shows buying pressure, but momentum is fading, impacting potential price growth.

Hamster Kombat (HMSTR) recently launched a gaming-focused layer-2 on the TON blockchain, attracting attention in the Web3 gaming space.
Despite being down 38% in the last 30 days, HMSTR has shown signs of recovery, gaining over 10% in the past week. Technical indicators suggest that while momentum is building, the trend’s strength remains uncertain, making the upcoming days crucial for HMSTR’s price direction.
HMSTR ADX Shows the Current Trend Isn’t That Strong
HMSTR’s ADX is currently at 21.5, after reaching 28.4 two days ago and dropping to 18.8 yesterday. ADX, or Average Directional Index, measures the strength of a trend but not its direction.
It ranges from 0 to 100, with values below 20 indicating a weak trend and above 25 suggesting a strong trend. Currently, HMSTR’s ADX at 21.5 shows that the trend is gaining some strength, but it is still in a relatively weak zone.
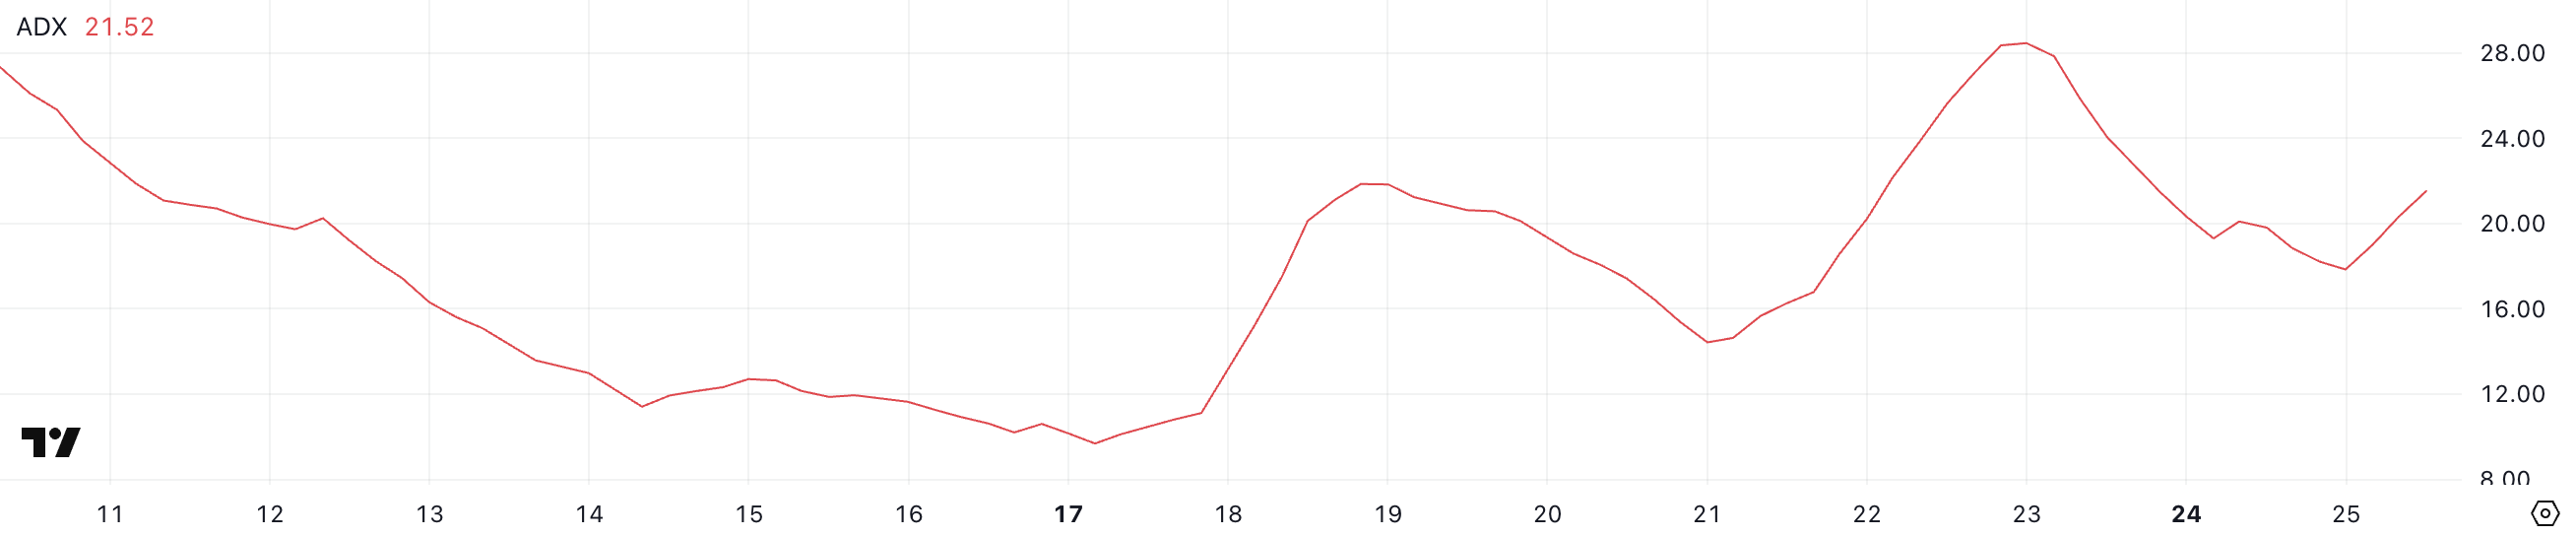
The recent increase from 18.8 to 21.5 indicates that momentum is building, supporting the possibility of an emerging uptrend, after Hamster Kombat launched its Layer-2 Blockchain on TON. However, for this uptrend to gain more confidence, ADX would need to rise above 25, confirming stronger trend strength.
If ADX continues to increase, it could indicate that the buying momentum is solidifying. Conversely, if it fails to break above 25 and starts declining again, the uptrend might lose momentum.
HMSTR CMF Is Now Positive After Three Consecutive Days In Negative Levels
Hamster Kombat’s CMF is currently at 0.13, rising from -0.25 two days ago and peaking at 0.22 yesterday. CMF, or Chaikin Money Flow, measures buying and selling pressure by analyzing volume and price movement.
It ranges from -1 to 1, with positive values indicating buying pressure and negative values signaling selling pressure. Currently, HMSTR’s CMF at 0.13 suggests that buying momentum is present but has weakened compared to yesterday’s peak.
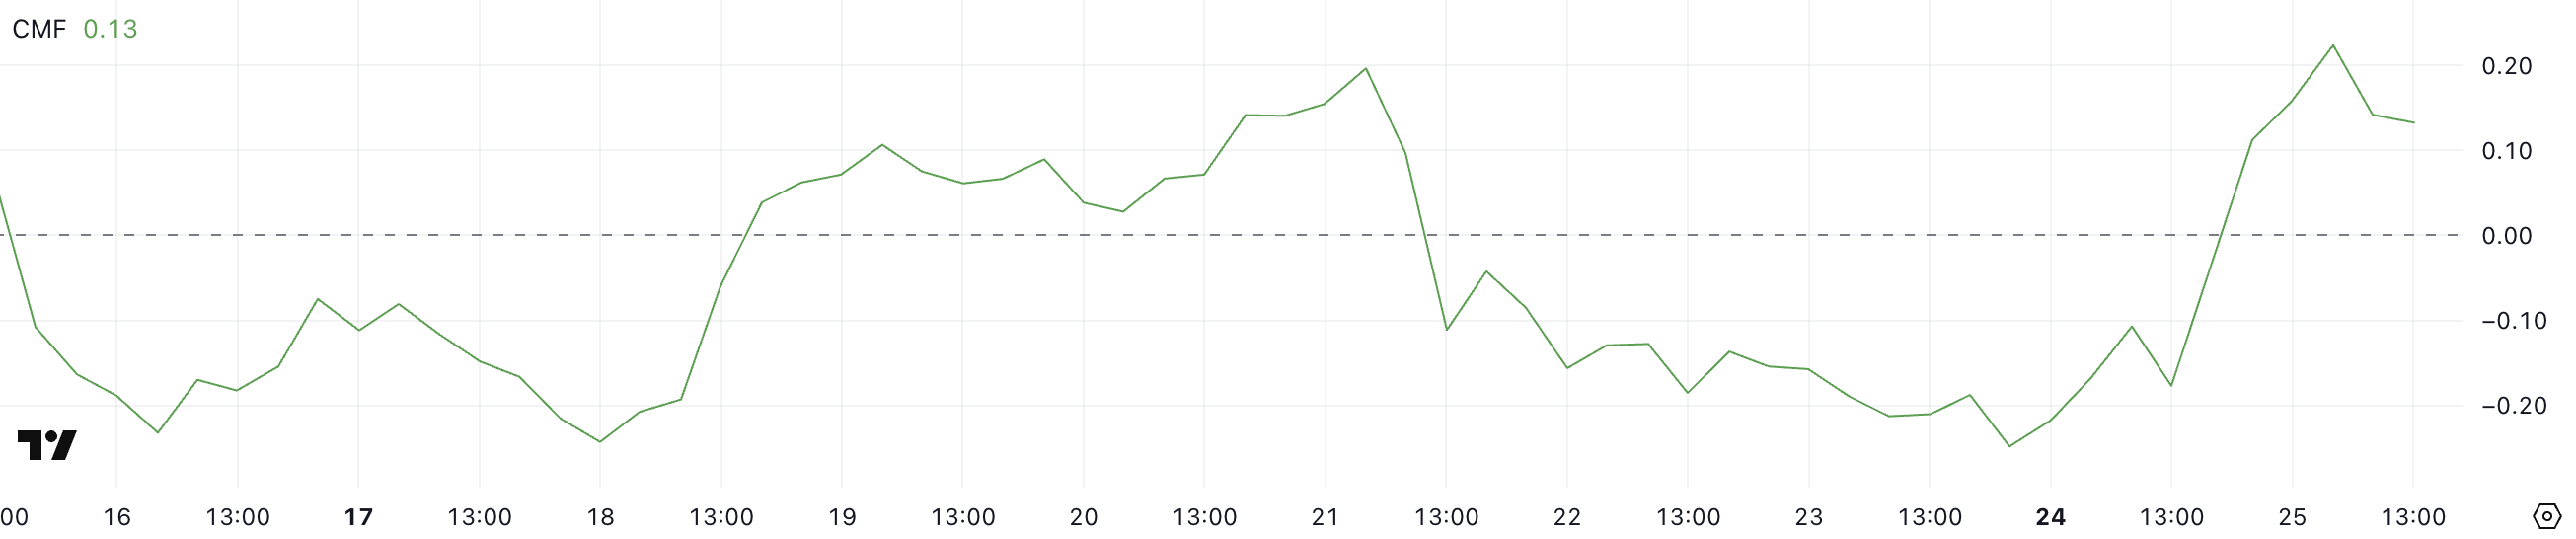
The positive CMF value indicates that buyers are still in control, supporting the possibility of continued price growth. However, the decrease from 0.22 to 0.13 shows that buying pressure is losing strength.
If CMF remains positive and starts to rise again, it could indicate renewed buying interest and further price gains for Hamster Kombat.
Conversely, if CMF continues to decline and turns negative, it would suggest that selling pressure is taking over, potentially leading to a price pullback.
Will Hamster Kombat Test $0.0028 Soon?
HMSTR’s EMA lines indicate that it is attempting to form a golden cross, where the short-term EMA would cross above the long-term EMA, signaling a bullish trend. However, this crossover hasn’t occurred yet, suggesting that the uptrend is still in its early stages.
If buying momentum continues to build, Hamster Kombat could rise to test levels around $0.0020, which are currently close to the long-term EMA lines (blue line). This level could serve as a first resistance. If that one is broken, the next one to be tested would be around $0.0023.
If this level is also broken, it could climb further to $0.0028, reaching its highest price since late January. This potential golden cross would confirm a bullish trend and support continued price growth.
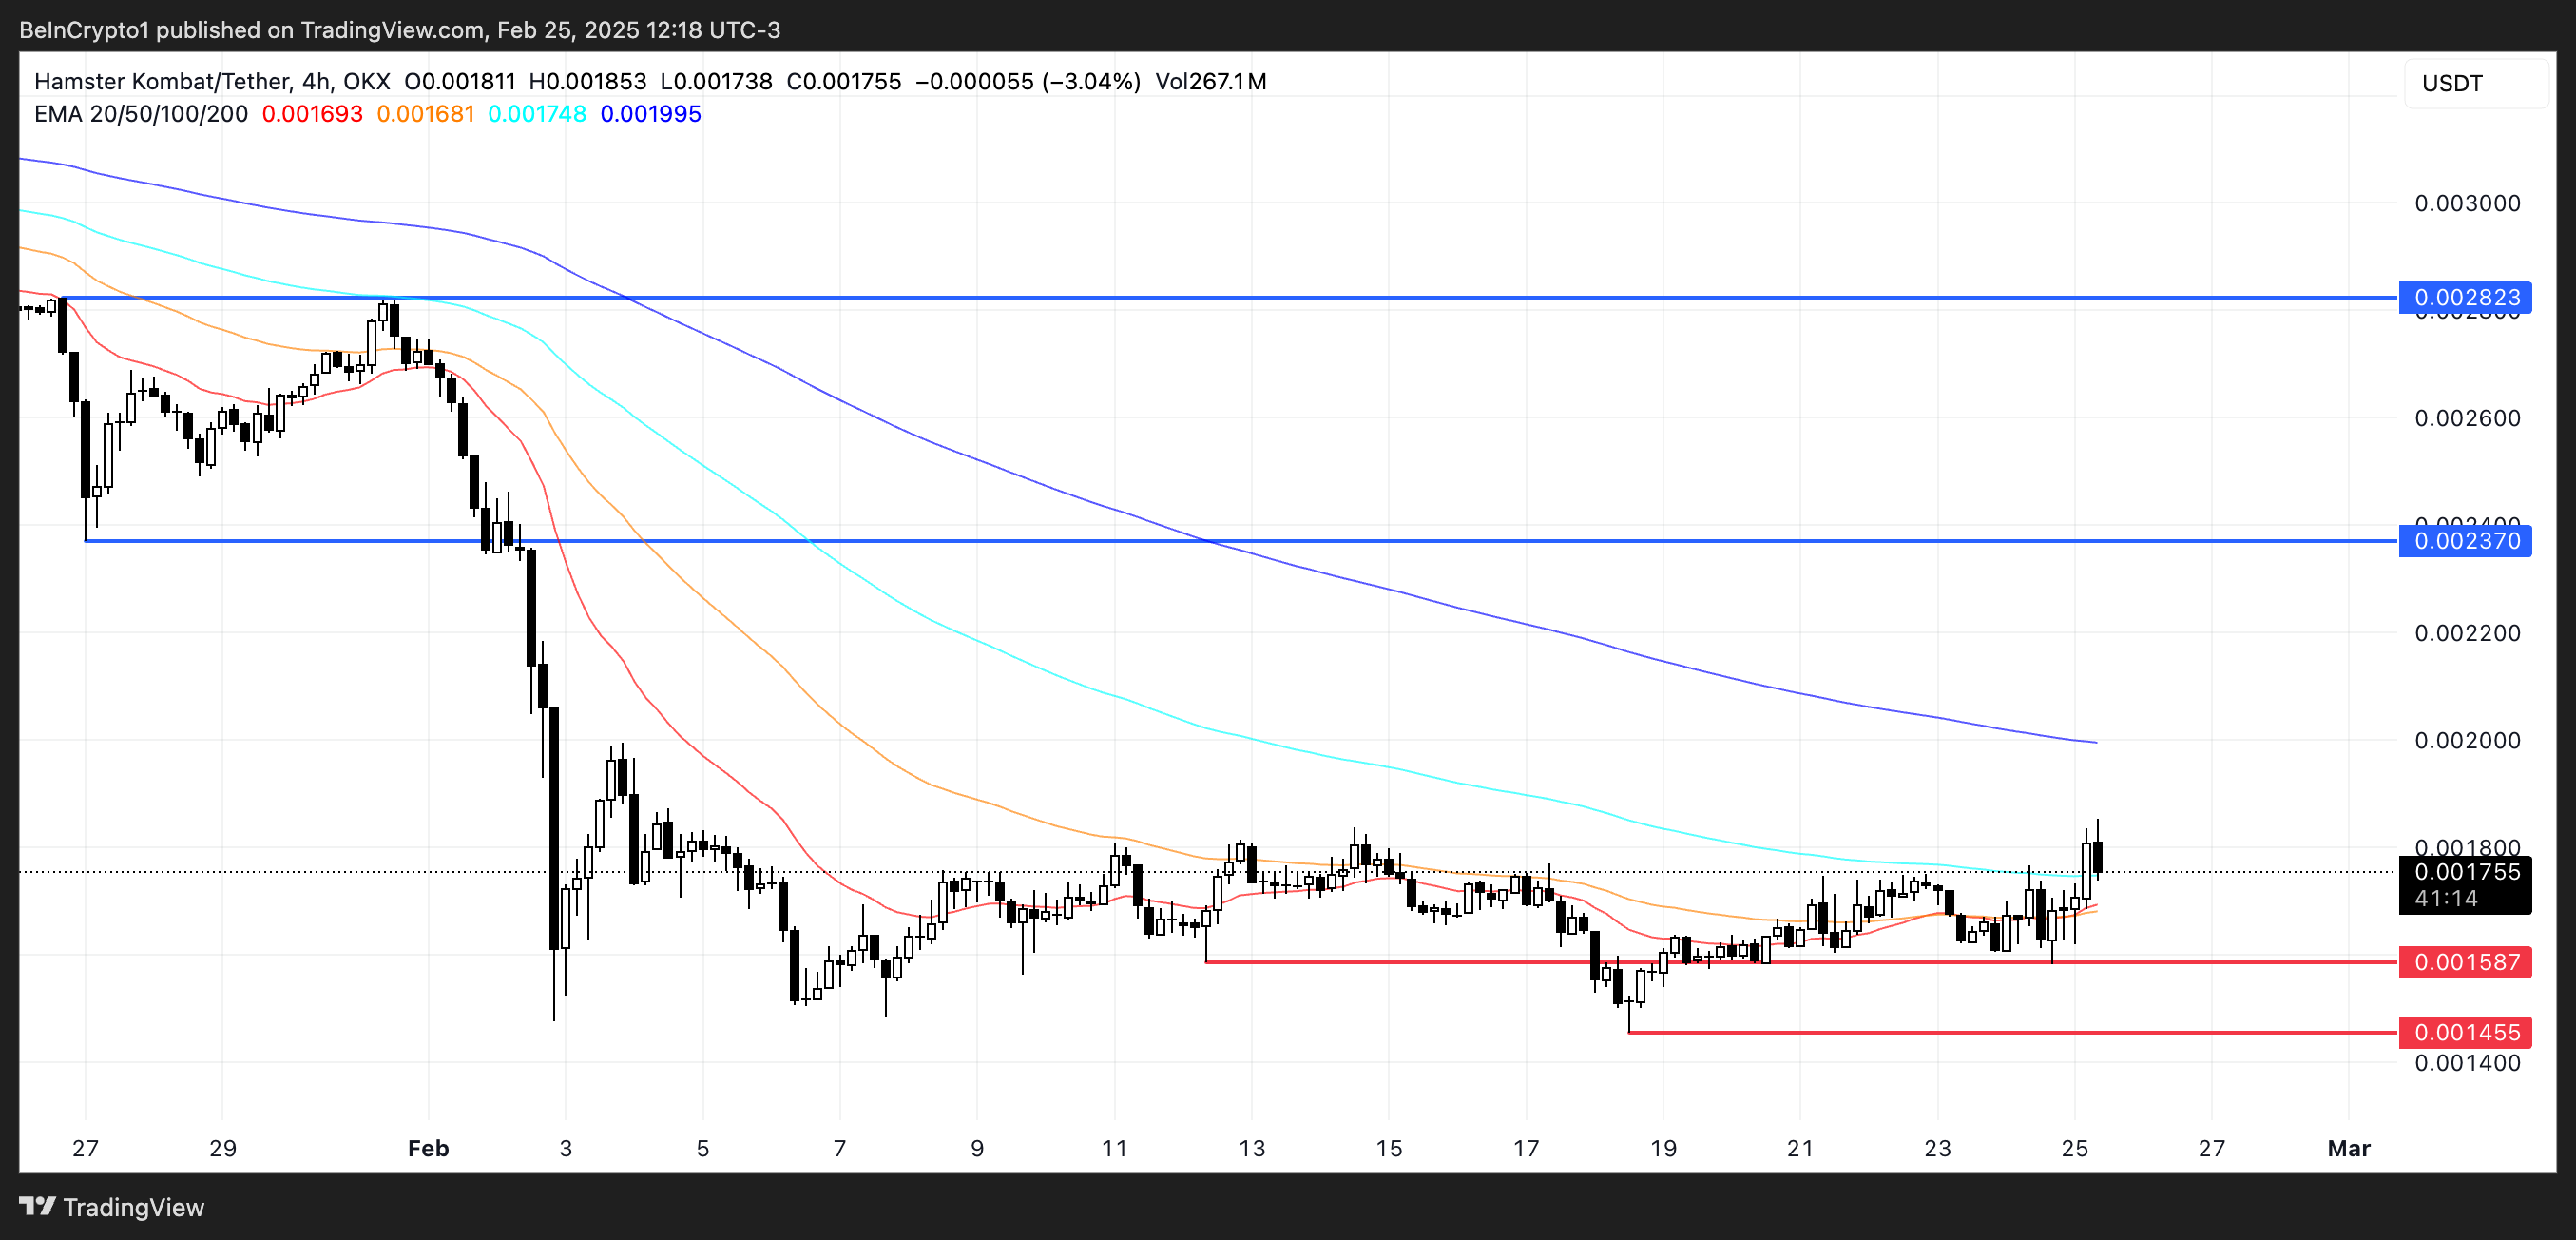
Conversely, if momentum fades and the uptrend loses strength, HMSTR could face increased selling pressure. In this case, it could test the support at $0.00158. If this support level fails, the price could drop to $0.00145.
For the bullish scenario to materialize, the short-term EMA would need to cross above the long-term EMA, confirming the golden cross. Until then, the price remains vulnerable to downside risk if bearish sentiment prevails.
Disclaimer: The views in this article are from the original Creator and do not represent the views or position of Hawk Insight. The content of the article is for reference, communication and learning only, and does not constitute investment advice. If it involves copyright issues, please contact us for deletion.


