Gold Technical Analysis – The breakout of the range triggered a rally
. Fundamental Overview . Yesterday, gold broke out of the recent range and extended the rally following some weak US data. In fact, the Continuing Claims rose to a new high and the ISM Services PMI...
FundamentalOverview
Yesterday, gold broke out of the recent range and extended the rally followingsome weak US data. In fact, the ContinuingClaims rose to a new high and the ISMServices PMI hit a new cycle low. That made the real yields to drop andgold to accelerate to the upside. This has been the case for a couple of years nowwhere a rise in real yields sees a much smaller fall in gold compared to a fallin real yields which triggers a bigger rally.
As of now, it looks like gold have limited downside but lots of upside asinflation abates slowly while risks to the growth picture increase the longerthe Fed keeps policy restrictive. In the short-term, strong US data might weigha bit on the market, but in the long-term weak data is likely to trigger biggerupside moves.
GoldTechnical Analysis – Daily Timeframe
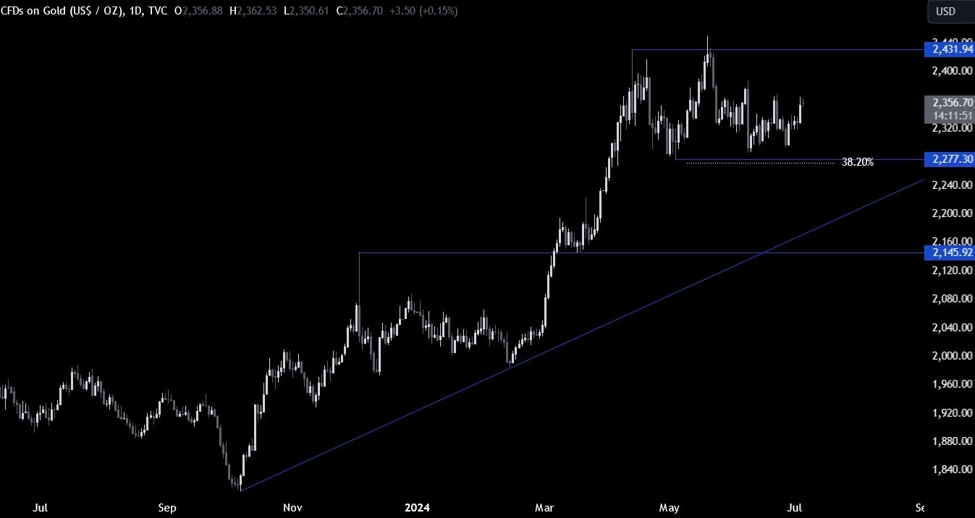
On the daily chart, we cansee that gold continues to maintain an overall rangebound price action,although the bias remains bullish. From a risk management perspective, the buyerswill have a better risk to reward setup around the key 2277 support zone where we can also find the 38.2% Fibonacci retracement level for confluence.
The sellers, on the otherhand, will want to see the price breaking below the support to change the biasand increase the bearish bets into the next support around the major trendline, although we will need very strongUS data to trigger such a big correction.
Gold Technical Analysis– 4 hour Timeframe
On the 4 hour chart, we cansee that the price yesterday broke out of the recent range between the 2320support and the 2337 resistance, and extended the rally to the 2360 level asthe buyers piled in on the breakout and increase the bullish bets on the weakUS data.
If we get a pullback fromhere, we can expect the buyers to step in around the 2340 level where we canfind the confluence of the previous resistancenow turned support and the minor trendline. The sellers, on the other handwill need to see the price falling below the 2320 level to turn the bias morebearish and extend the correction into the key 2277 support.
Gold Technical Analysis– 1 hour Timeframe
On the 1 hour chart, we cansee that the price action is now confined in what could turn out to be a bullishflag. A breakout to the upside will likely trigger another extension to theupside with the 2387 level as the target. A breakout to the downside, on theother hand, should provide the pullback into the 2340 level next. The red linesdefine the average daily range for today.
UpcomingCatalysts
Tomorrow we conclude the week with the US NFP report where the data is expectedto show 180K jobs added in June and the Unemployment Rate to remain unchangedat 4.0%.
See the video below
Disclaimer: The views in this article are from the original author and do not represent the views or position of Hawk Insight. The content of the article is for reference, communication and learning only, and does not constitute investment advice. If it involves copyright issues, please contact us for deletion.


