Gold Technical Analysis – Flash US PMIs in focus
. Fundamental Overview . After the breakout of the 2480 resistance, gold eventually extended the gains into the 2532 level as the momentum buyers piled in.
FundamentalOverview
After the breakout of the2480 resistance, gold eventually extended the gains into the 2532 level as the momentumbuyers piled in.
In the big picture, goldshould remain supported as real yields fall as we head into the Fed’s easingcycle, but in the short-term strong US data might provide pullbacks along theway.
Tomorrow, we get the FlashUS PMIs and in case the data surprises to the upside, it could lead to someweakness in gold, and it will be interesting to see if the market decides tofade it or it will trigger a bigger correction to the downside.
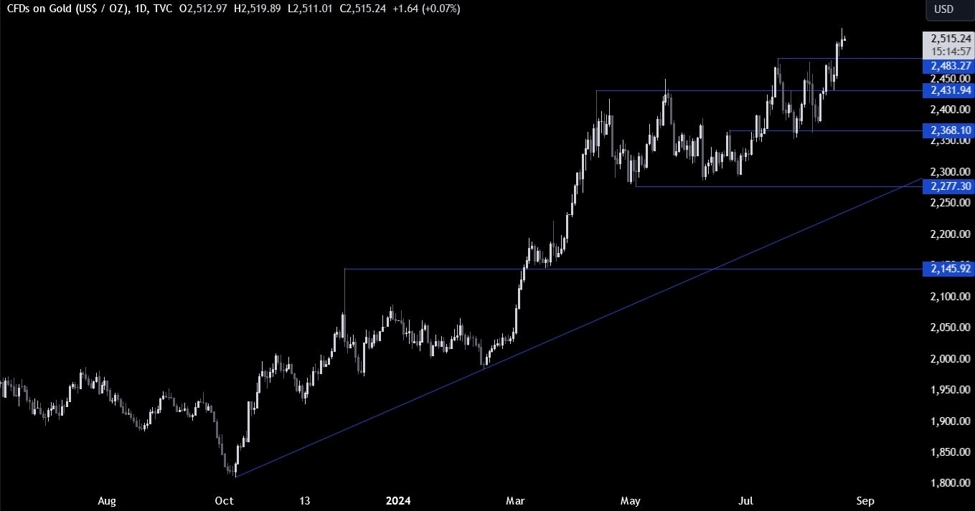
GoldTechnical Analysis – Daily Timeframe
On the daily chart, we cansee that gold recently managed to break above the key resistance zone around the 2480 level andextended the gains into the 2532 level as more buyers piled in.
The buyers are now incontrol and the breakout should give them more conviction to target new highs.The sellers, on the other hand, will want to see the price falling back belowthe 2480 level to invalidate the breakout and position for a drop into the 2360level.
Gold Technical Analysis– 4 hour Timeframe
On the 4 hour chart, we cansee that we have now have a strong support zone around the 2480 level where wecan find the confluenceof the trendlineand the 50% Fibonacciretracement level.
If were to get a pullbackinto the support, we can expect the buyers to step in with a defined risk belowthe trendline to position for new highs with a better risk to reward setup. Thesellers, on the other hand, will want to see the price breaking below thetrendline to invalidate the breakout and position for a drop into the 2360level.
Gold Technical Analysis– 1 hour Timeframe
On the 1 hour chart, we cansee that the price recently bounced on the minor upward trendline to reach newhighs but it’s now trading below it. This might be a signal that the bullishmomentum has waned a bit and a pullback into the 2480 support is more likely. Thered lines define the average daily range for today.
UpcomingCatalysts
Tomorrow we get the US Jobless Claims figures and the US PMIs. On Friday weconclude with Fed Chair Powell speaking at the Jackson Hole Symposium.
See the video below
Disclaimer: The views in this article are from the original author and do not represent the views or position of Hawk Insight. The content of the article is for reference, communication and learning only, and does not constitute investment advice. If it involves copyright issues, please contact us for deletion.


