What are the advanced tools for IC Markets MT4?
Improve your trading performance with over 20 free MT4 advanced tools from IC Markets。
Improve your trading performance with over 20 free MT4 advanced tools from IC Markets。Learn more details。
As a first-class forex broker, IC Markets offers a number of benefits to forex traders, one of which is the free gift of premium trading tools to IC Markets users。For example, you can use tools such as the correction matrix, which can clearly show the connections between different assets in a table。There is also a free drawing indicator that allows you to scribble directly on the chart。
In addition, there are more than 20 tools in their tool library, which is very convenient to use whether you are a beginner or an experienced trader。
Best of all, you can get these tools for free by simply signing up for a demo account with IC Markets。Installation is very simple, and there is a comprehensive guide to show you how to use it。
IC Markets is a company in International Capital Markets Pty Ltd..Online Forex Brokerage Company operated under。Brokers under Australian jurisdiction offer trading services in IC Markets-AU, based in Australia and licensed by ASIC。
Non-Australian traders, on the other hand, are registered under the Seychelles-based IC Markets SEY and are regulated by the SFSA.。This dual operation is ASIC's new rule, which prohibits its regulated brokers from offering trading services outside Australia.。
IC Markets, known as ECN Broker, offers clients optional trading platforms such as MetaTrader 4, MetaTrader 5 and cTrader。The broker follows market trends and includes cryptocurrencies as one of its products, enriching its already wide selection of trading assets, including currencies, indices, metals, energy, software, stocks and bonds.。
IC Markets has a medium minimum deposit of $200 compared to other ASIC regulated brokers。Market analysis materials are also regularly published on the official website of IC Markets, demonstrating its ability to provide traders with specialized market expert content。
For payment methods, IC Markets allows financing and withdrawals via wire transfers, credit cards, PayPal, Skrill, Neteller, FasaPay, UnionPay, and BitPay's Bitcoin。It also supports multiple base currencies, including the US dollar, Australian dollar, euro, British pound, Singapore dollar, New Zealand dollar, Japanese yen, Swiss franc, Hong Kong dollar and Canadian dollar.。
Since IC Markets' trading technology is equipped with highly centralized servers and extremely low latency (especially on cTrader), the broker is widely known for its ability to host high-frequency trading and order brushing capabilities。
In summary, IC Markets is a well-regulated broker with flexible base currencies and payment methods, welcoming traders from outside the country.。By the end of 2019, IC Markets had 18 foreign language websites available, including English, Korean, Indonesian, French, Spanish, Italian, Malay, German and Chinese.。
Download and set up the MT4 Advanced Trading Tool
As mentioned earlier, to get these advanced tools, you first need to create a demo account。
Just log on to the official website of IC Markets and click "Try free simulation" at the top.。
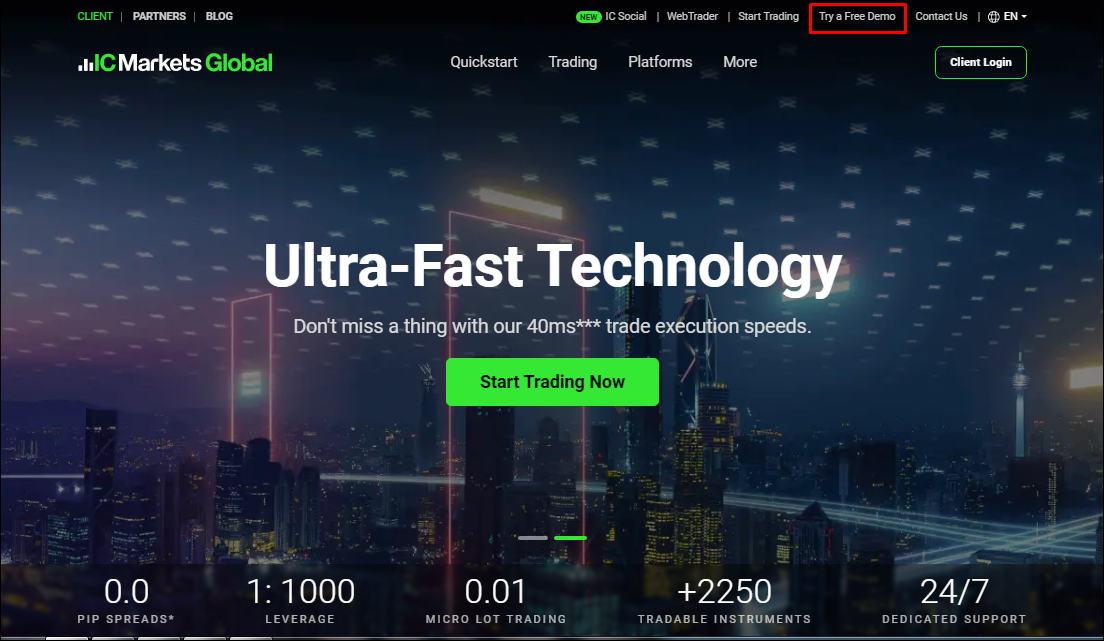
Just log on to the official website of IC Markets and click "Try free simulation" at the top.。
This will take you to the demo account registration page。Fill out the form and follow the steps until complete。
Once your demo account is ready, please log in to your client area。You can then easily download these tools from the Trading Tools section under "Advanced Trading"。After that, just download the installer to your IC Markets MT4。
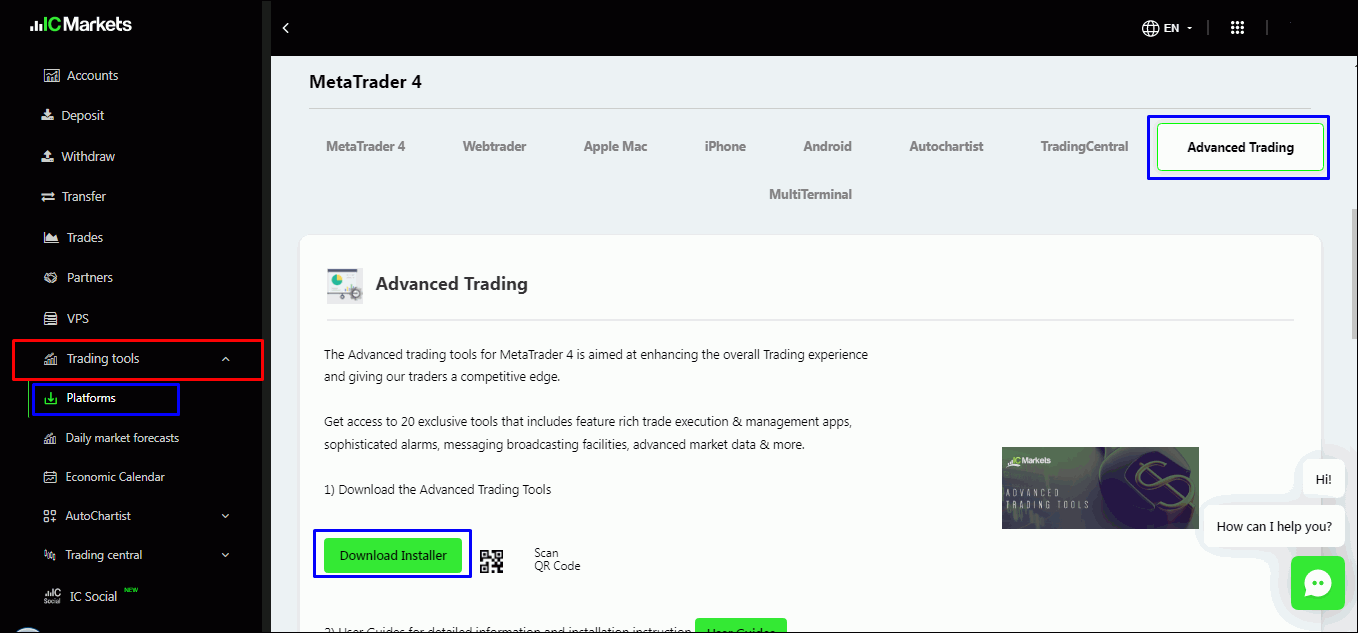
Follow the installation steps to complete the installation。Once installed, you can use all these tools on the IC Markets MT4 platform。
IC Markets MT4 Advanced Tools
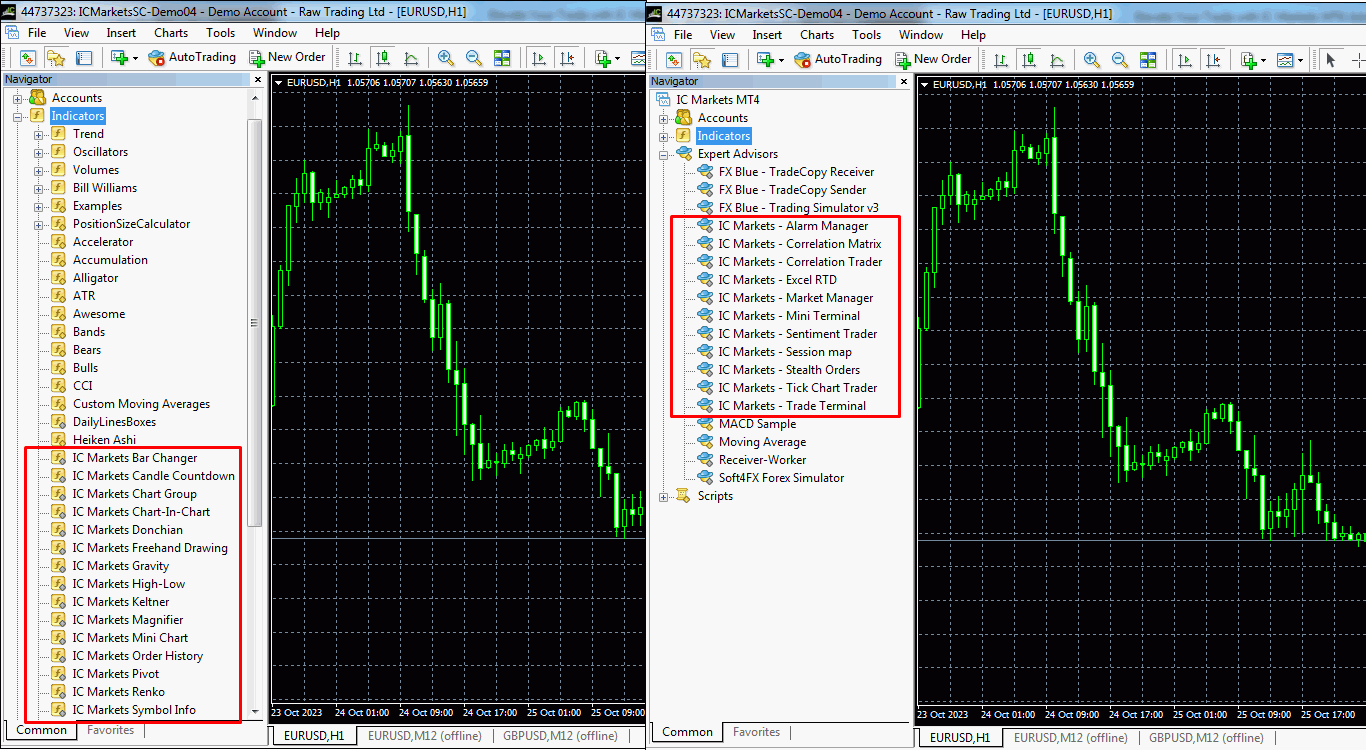
These tools come in two different forms: indicators and applications。A total of 15 indicators and 11 applications in the form of Expert Advisors (EA)。
Now, let's take a closer look at the detailed explanation of each indicator。
Indicators
Here are the 15 indicators in IC Markets MT4:
1.Bar transform indicator
Bar Changer indicator creates an offline modified version of the selected chart。Using the bar chart changer, you can do some operations on the bar chart:
- You can move the time of each bar, for example 2 hours backward。
- The price can be flipped or simplified, such as turning 1.For 23456 read 12345.6。
- You can select only specific periods of the day, such as showing only what happens between 09: 00-16: 59。
In index CFD trading, the daily time range option is mainly used to focus on important time periods。The indices are tradable 24 hours a day, but are busiest during certain core market periods。
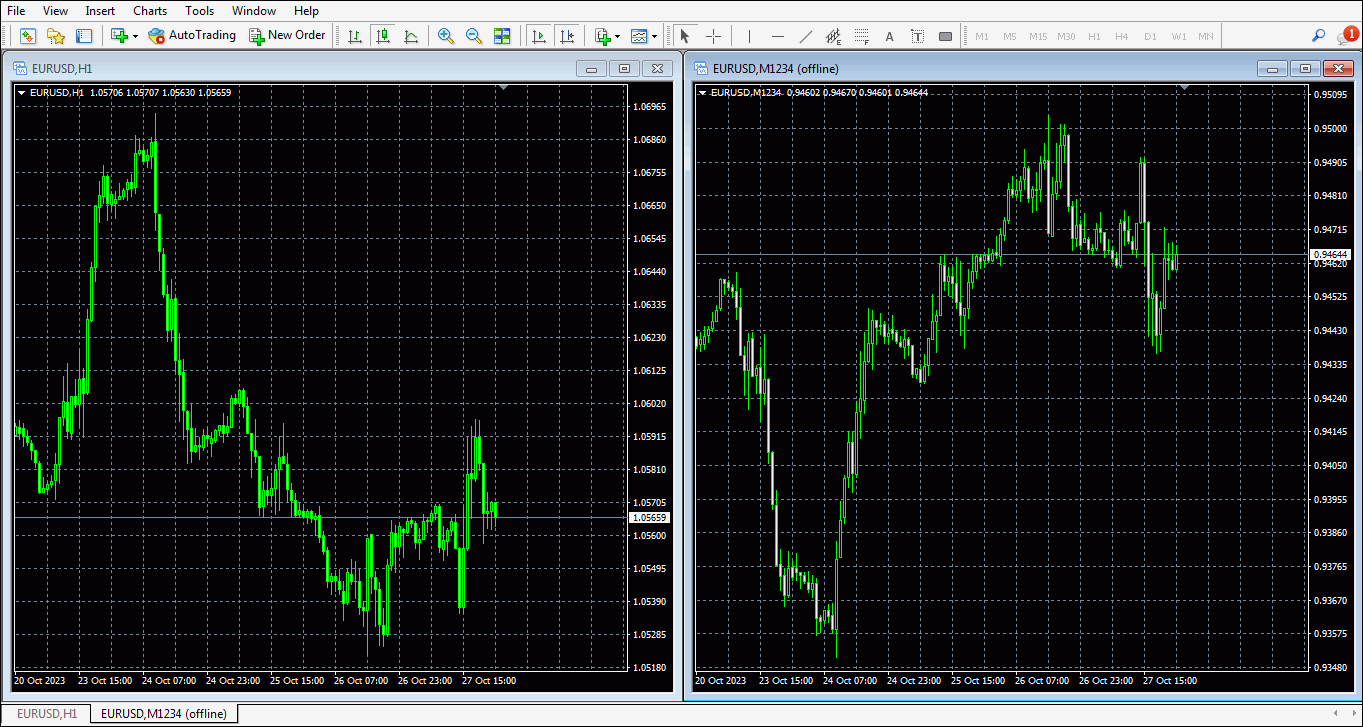
For example, in the Euro Time Frame (TF) H1 chart below, I used IC Markets' bar chart change tool to make a new online chart upside down (inverted)。
2.Candle Countdown Indicator
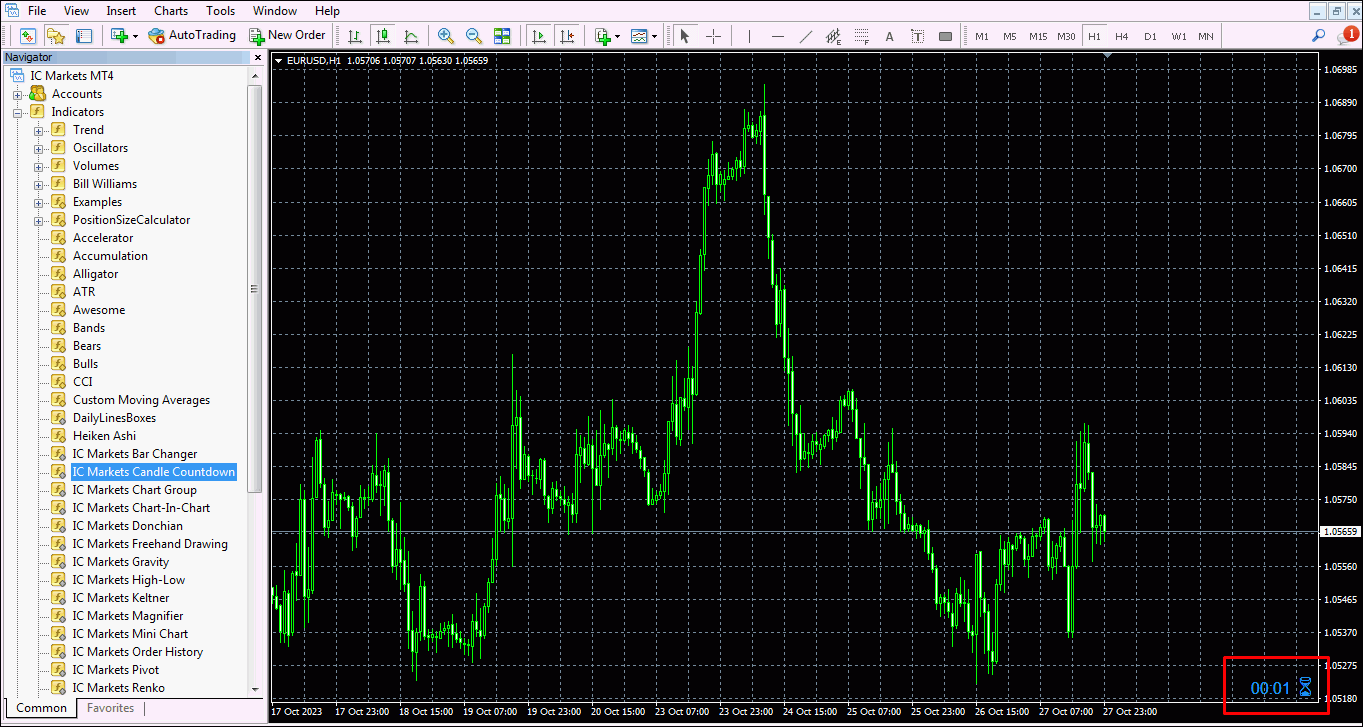
Candle chart countdown indicator on IC Markets MT4 will tell you how much time is left on the current bar chart on the chart。Usually, it follows the time frame of the chart, but you can change it through the settings。You can even set up multiple such metrics to see different bar time frames。
You can also set an alarm to give you a wake-up call at the end of the histogram.。
3.Chart Group Indicators
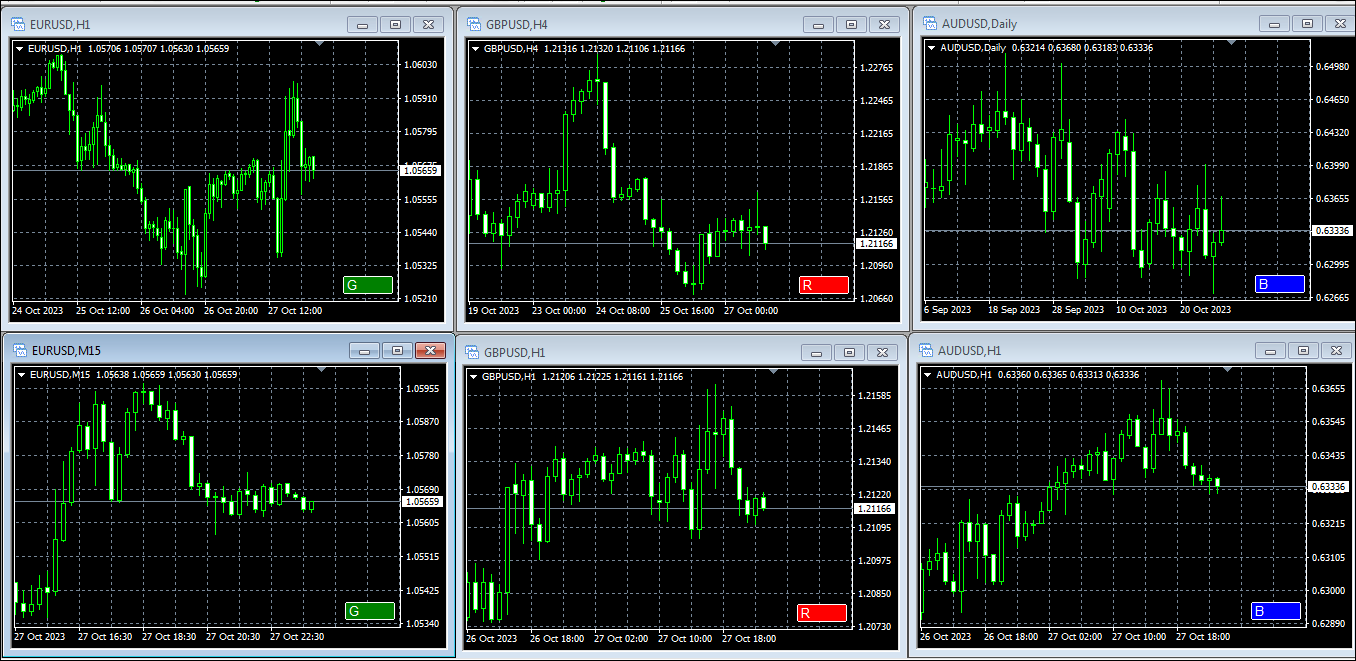
Chart group indicator brings a cool feature to professional trading platforms。It allows you to connect different charts。So, when you change the symbol on a chart, the same change happens on the linked chart。
Here's an example: Suppose you have three open charts of EUR / USD, set on the M15, M30 and H1 time frames。You use the indicator to connect them together。
Now if you change one chart to a different symbol like GBPUSD, all other charts will automatically switch to GBPUSD as well。In this way, you can easily switch symbols on multiple charts without creating a separate configuration file for each symbol in MT4。
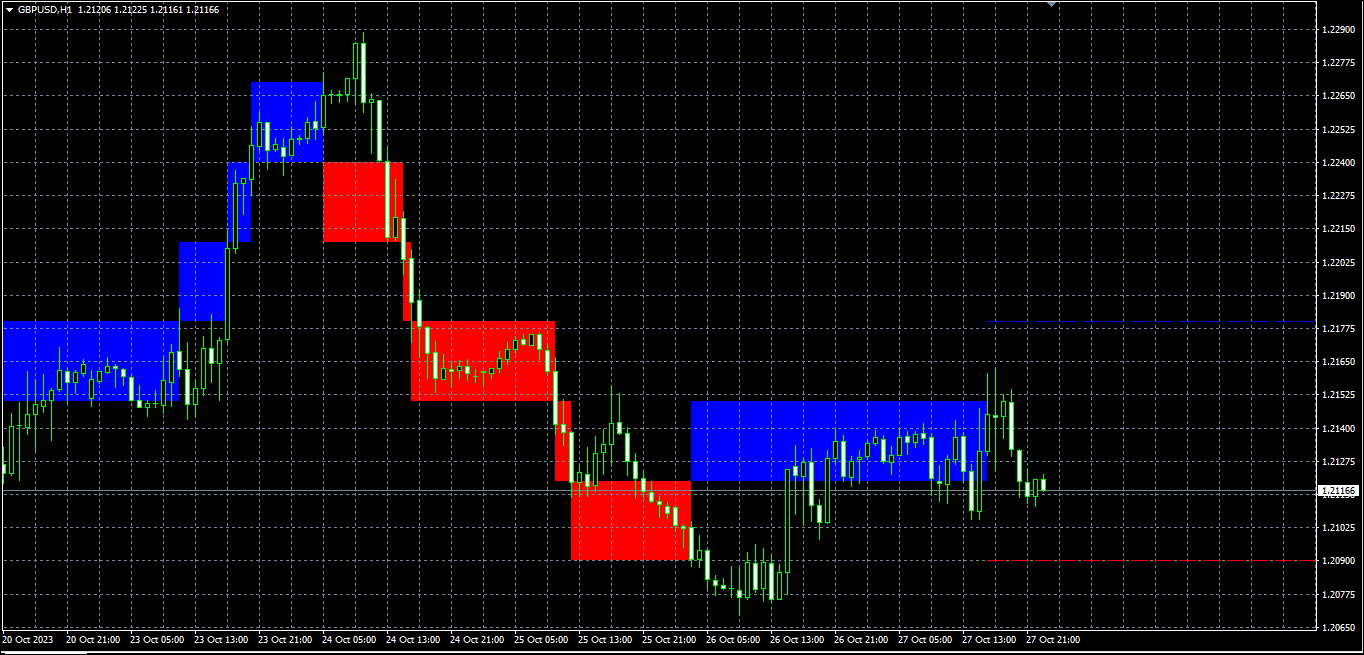
In the IC Markets MT4 chart example below, you will see three sets of linked charts, marked in green, red, and blue。Changing the symbol on any chart will change its partner chart as well.。
You can also use the indicator to synchronize time frames instead of symbols。For example, you open the chart for EUR / USD, GBP / USD, and USD / JPY。When you change the time frame of one chart, the time frame of the other two charts will also change automatically。
4.Chart indicators in charts
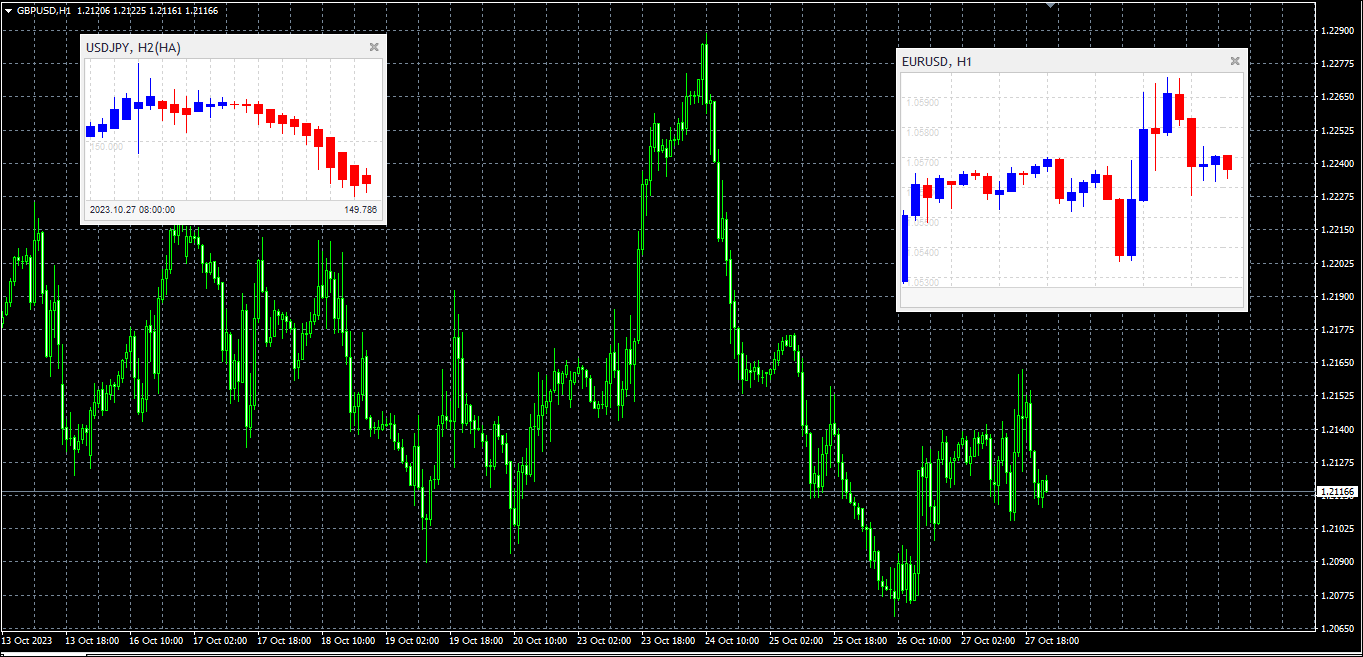
Think of the chart indicator in the chart as a small window in the main IC Markets MT4 chart, which shows the price of another symbol。You can have multiple such small windows and view more symbols at the same time。
For example, if you are looking at the main chart of the pound against the dollar, you can display the euro against the dollar and the Australian dollar against the dollar in a smaller window。You can also flip the price, such as showing USDJPY as JPYUSD。
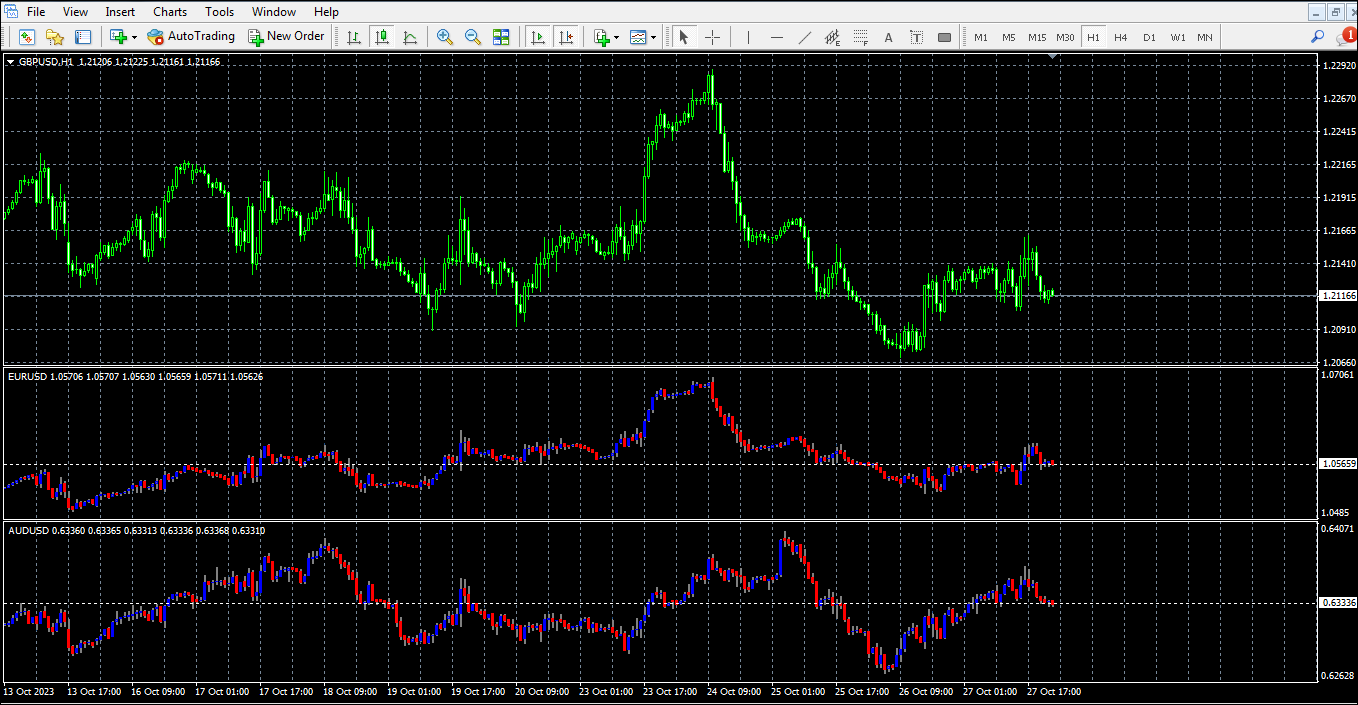
Although these smaller windows cannot display everything like ordinary MT4 charts, you can still display typical technical tools such as moving averages and envelopes。You can also choose to display details of active transactions and upcoming orders。
5.Donchian Indicators
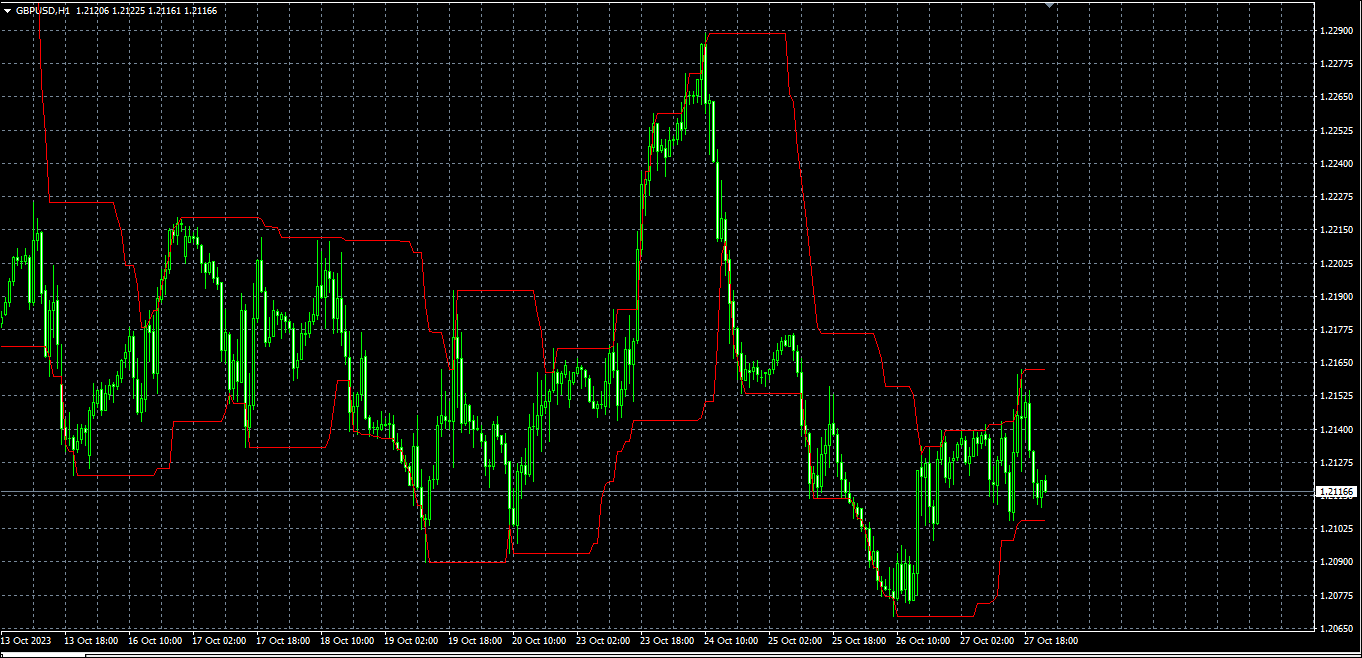
The Donchian indicator shows something called the Donchian channel。It is basically two lines, showing the highest and lowest points of the past N bar charts。
It is different from the conventional Down calculation。The indicator also offers three other options:
- Displays the average of the highest and lowest points (mean)
- Show the middle point between the highest and lowest points
- Show the lowest point instead of the highest point。
You can also widen or narrow the Down channel by a certain percentage, a specific price amount, or using multiples of ATR (Average True Range) or SD (Standard Deviation)。
If you want, you can also set it to issue a pop-up alert when the current price crosses the high or low line。
6.Free drawing indicator
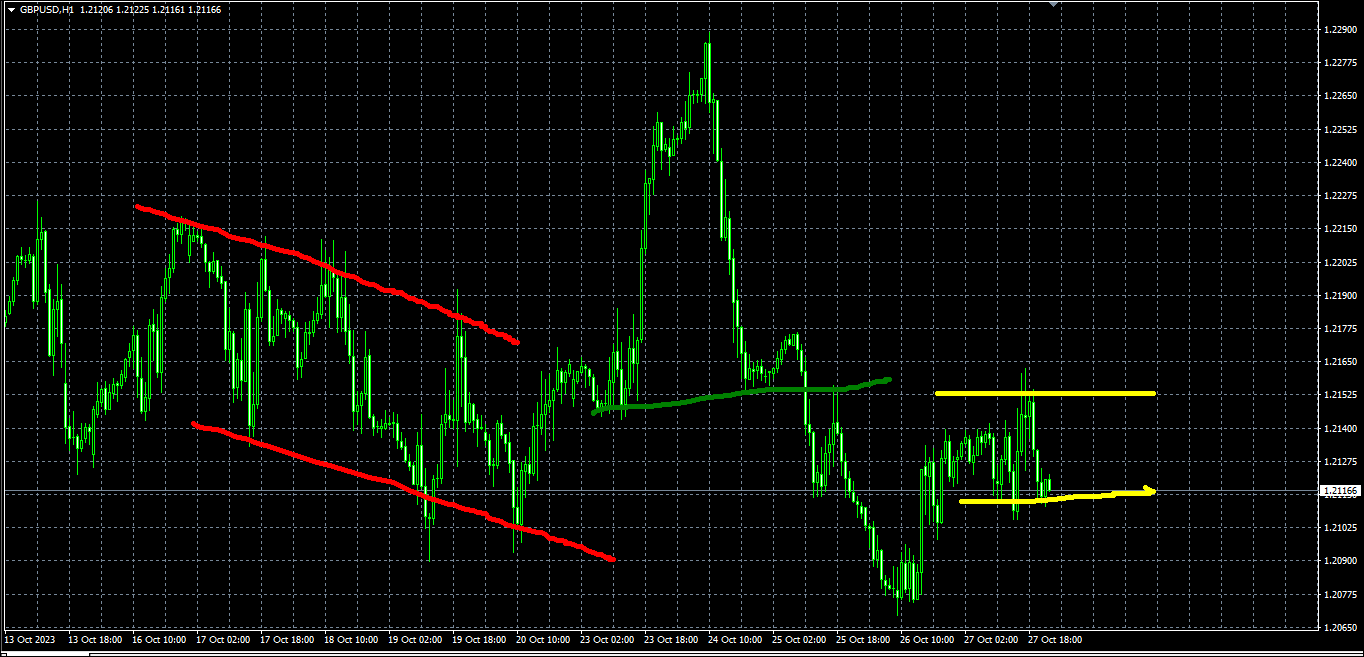
6.Free drawing indicator
Free drawing indicator allows you to draw on IC Markets MT4 charts。This is handy for tagging or highlighting content on charts, especially when doing live webinars or sharing charts with others。
To draw, simply press a key and move the mouse。You can switch colors using keyboard shortcuts and easily undo if you make a mistake while drawing。
7.Gravity index
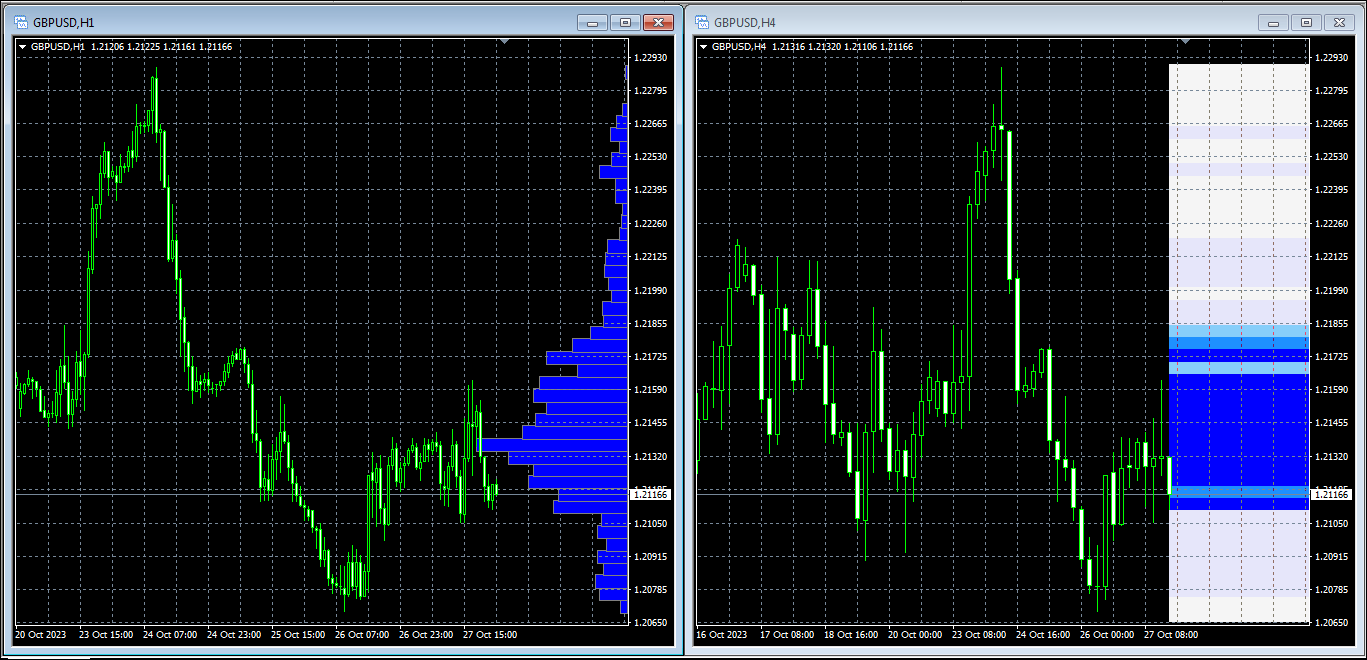
Gravity indicator shows on the chart where the price may get support or resistance。Depending on past market activity, it uses different colors to show the strength of these areas。
You have two ways to use the indicator: you can make it consider all the past data for the current time, or you can choose a starting point and see how it works in the absence of recent price fluctuations。
8.High-low indicators
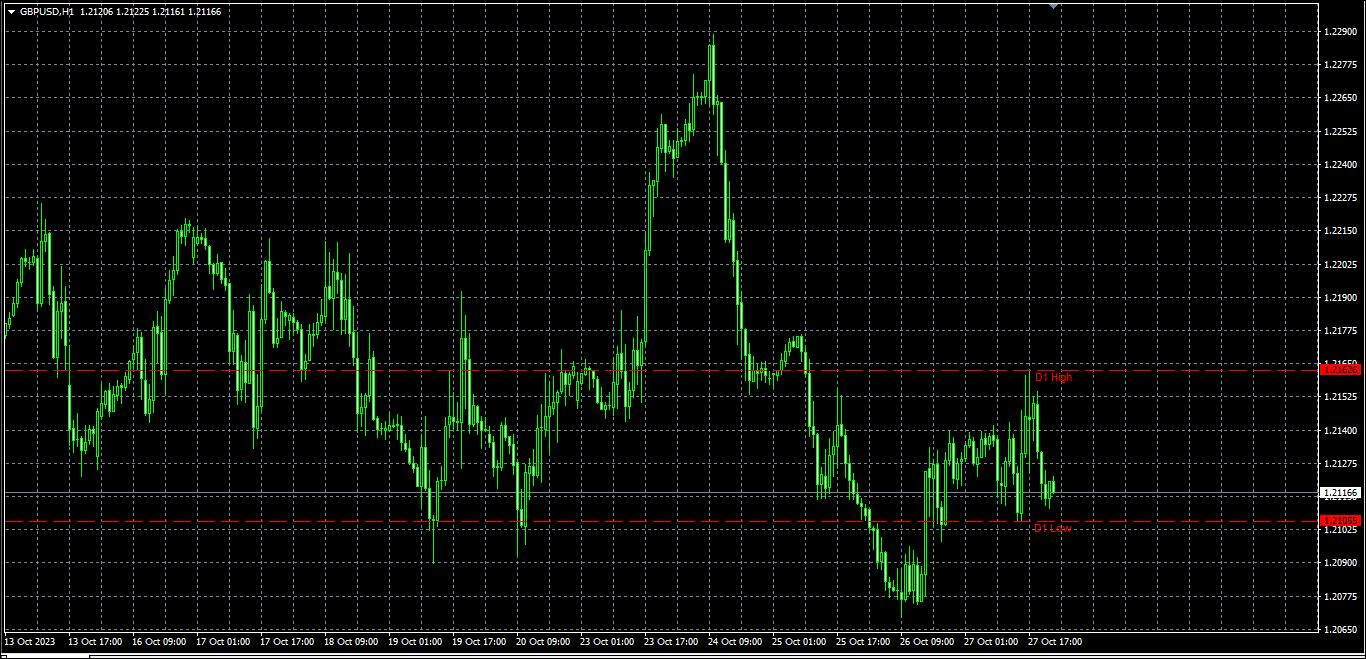
The "High and Low" indicator on IC Markets MT4 highlights the highest and lowest points on the chart. You can use this indicator under any time frame or number of bars of your choice。You can even place multiple versions of the indicator on the same chart to see different levels, such as daily and 4-hour highs and lows on the hourly chart。
In addition to highs and lows, the indicator can also show the opening and closing prices。It can be set to focus on a specific time frame within a day instead of the entire trading day。
It can also be set to alert when the current price exceeds the highest or lowest point in history。
9.Keltner Indicator
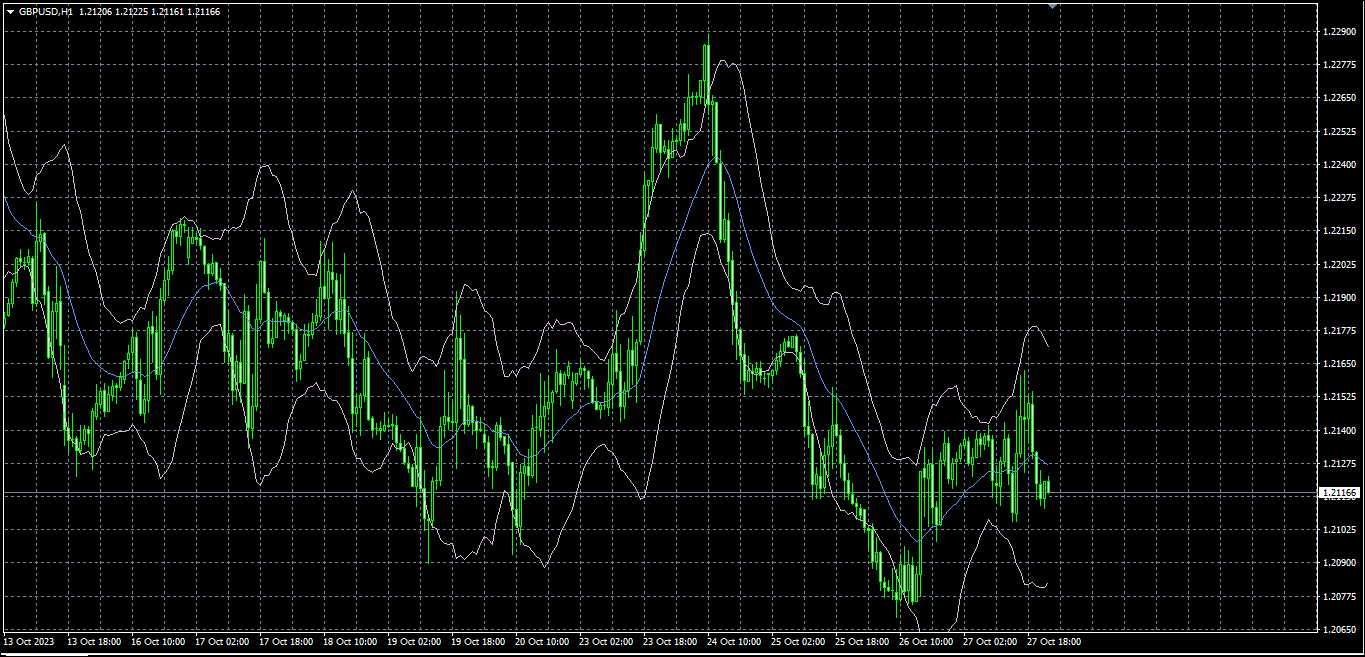
The Keltner indicator shows the Keltner channel, which is a bit like the Bollinger Bands。However, the change in channel width is not based on standard deviation, but on something called ATR。
You can set it to sound an alarm when the price exceeds the upper or lower rail of the channel, which is usually seen as a signal that the price may change direction。
10.Magnifier indicator
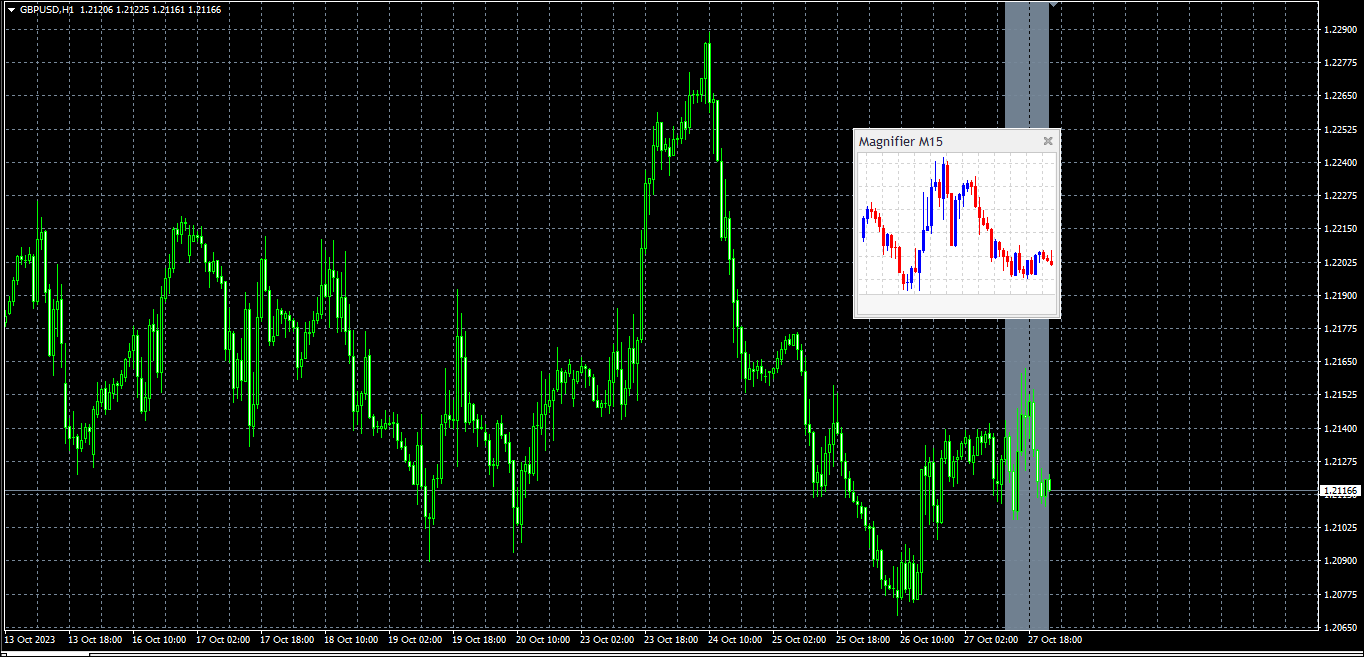
The magnifying glass indicator will generate a small window in the IC Markets MT4 main chart, you can move the window and enlarge or reduce it。This window is like a zoom-in tool that allows you to observe certain histograms closer, just like you observe M30 histograms on an H1 chart。
You only need to grab and move the magnifying glass on the chart to zoom in on different times in the past。
11.Mini Chart Indicator
Mini Chart creates a small window in your IC Markets MT4 main chart that you can move and adjust at will。Through this small window, you can view the situation in other currencies or time frames without switching to a different MT4 chart。
Mini charts offer many options such as
- different time frames, such as M4 and H3, rather than just the usual M1 or H1;
- A single-point column chart (for example, a column chart consisting of 10 points each) and a second column chart (for example, a 20-second column chart);
- Various chart types, such as Range, Renko, Kagi, and point and graph charts;
- Data transformations such as Heikin Ashi and Three Line Break。
Standard MT4 indicators cannot be used on mini charts。But it has its own selection of commonly used indicators such as moving averages and Bollinger Bands。
12.Order History Indicator
Orders put your past trades on a chart showing when you entered and exited trades as well as prices and times。It also uses colored stripes to show when you enter or exit the market。
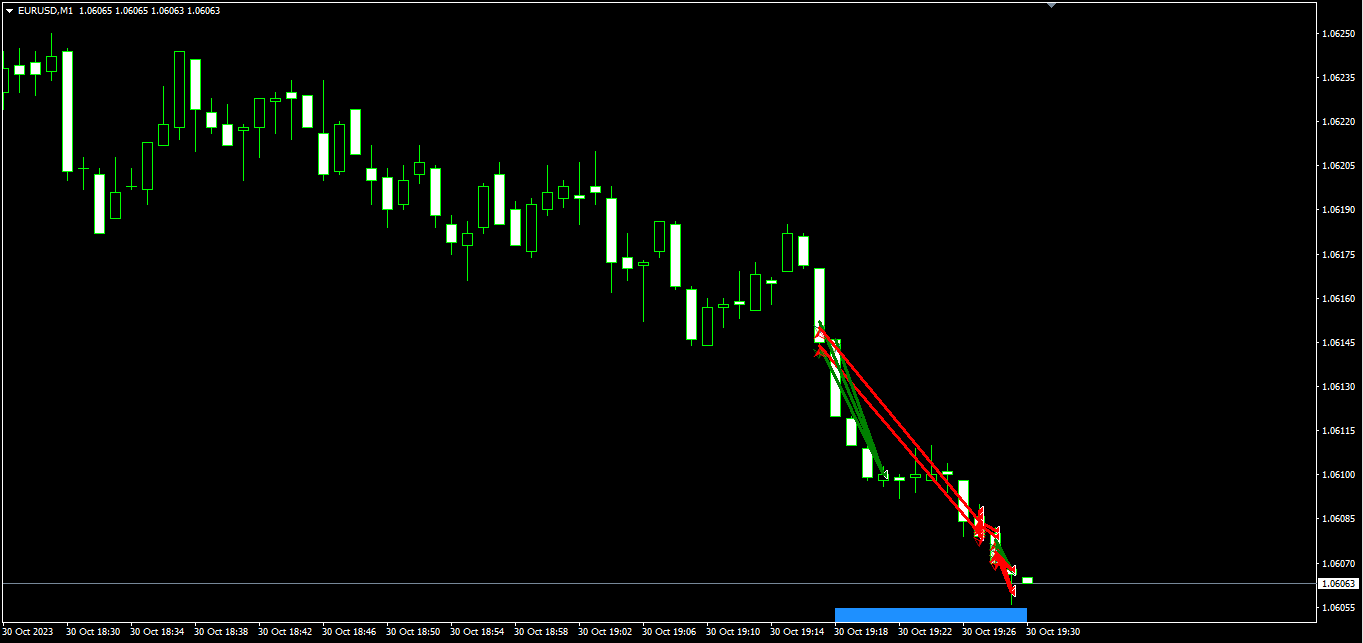
In this example, you can see a single transaction with the EUR / USD sign and a line connecting the entry and exit arrows。The blue bars at the bottom of the chart show when you opened trades in EUR / USD and the grey bars show when you opened trades in other currencies。When you switch to a different time frame (such as D1, H1, M1), it's like zooming in on your trading history。
If you hover over a past transaction, you can see all the details of that transaction。If you hover over a blue or gray ribbon, you can view the details of open trades during that time period。
13.Pivot Indicator
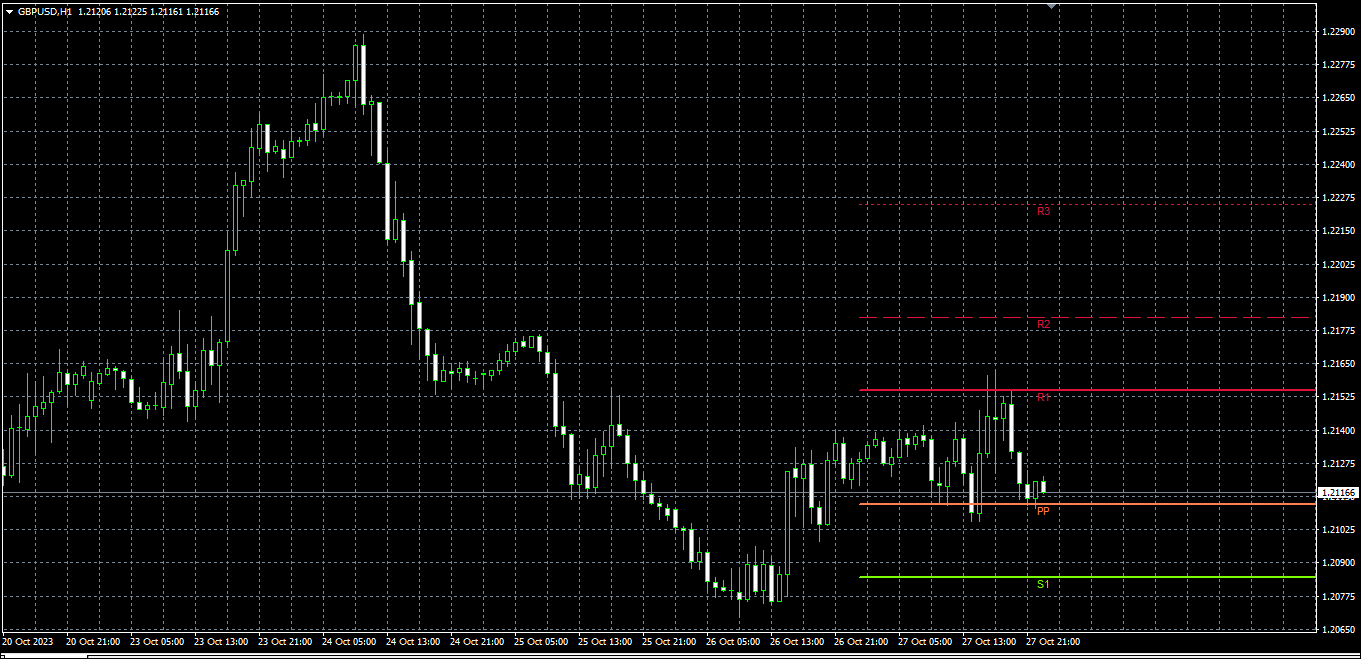
Pivot Indicator Traditional pivot calculation by viewing past price movements。It calculates a center pivot price and then gives three support levels and three resistance levels on each side (R1 to R3 and S1 to S3)。
You can use the indicator in different time frames。For example, you can see the H4 pivot level on the M30 chart。In addition, you can also set it to alert when the current price exceeds the support or resistance level。
14.Renko Indicator
Renko Bar Chart Indicator Add Renko blocks to time-based MT4 regular chart。These blocks can be drawn as a continuous line or as separate sections at the end of a new Renko block。Renko blocks can have different widths or gaps between them because they are not time-dependent and have different durations。
You can also use the indicator to create a separate offline MT4 chart showing only Renko blocks。The chart is more like a traditional Renko chart and is not time-linked like a regular MT4 chart。
15.Symbolic information indicator
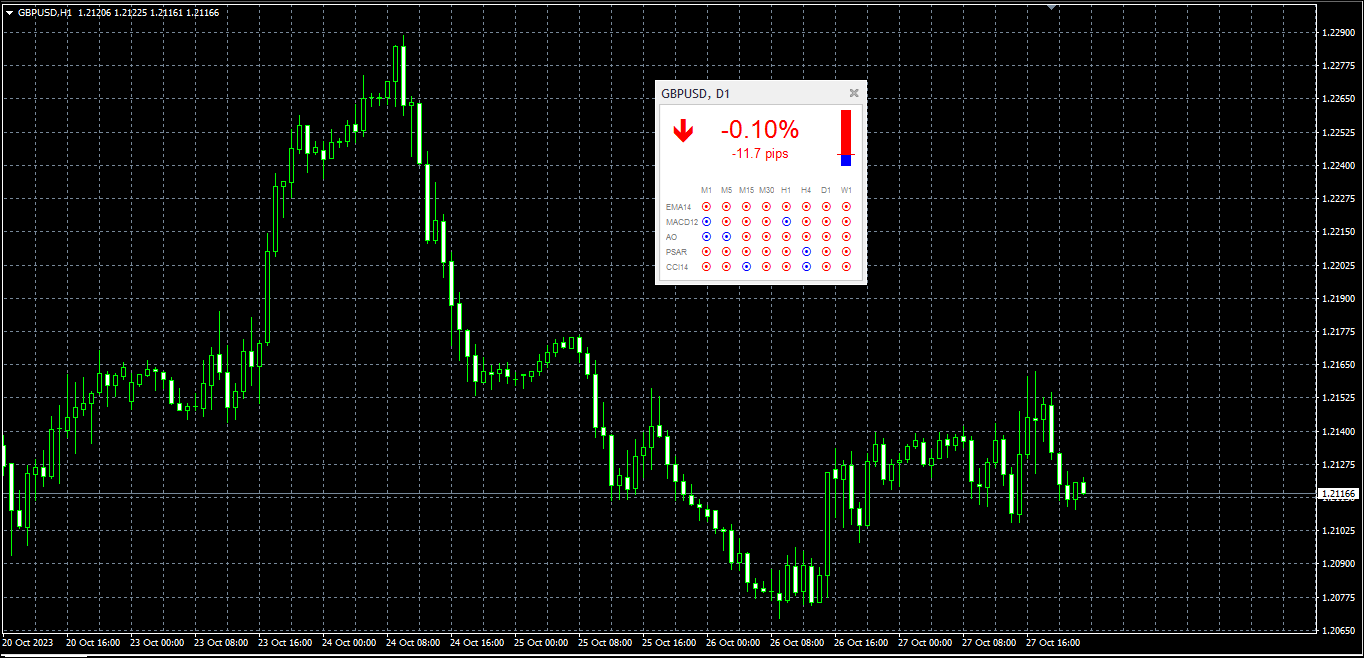
Symbol Information "indicator displays a small window in the IC Markets MT4 main chart。This window displays important information about the symbol。
It tells you how much the price has changed, how far away from the nearest highs and lows。It can also display some signals from different time frames。
You can place multiple versions of this indicator on the chart to see information for different symbols or time frames。You can also make different settings for each indicator。
Application (Smart Trading System / EA)
Here are the 11 apps in IC Markets MT4:
1.Notification Manager
Notification Manager does three main things:
- It tells you what's happening in your trading account and the market.。
- When these events occur, it can automatically take action。
- It can send updates to your followers via Twitter, email or SMS。
Think of the Alert Manager as a set of building blocks that you can use to create a personalized trading assistant。For example, you can set it to do any of the following:
- Warn when account margin usage exceeds 20%。
- Close losing trades if account shrinks more than 10%。
- Share your deals on Twitter, email or SMS。
- Place an order or close a position at a specific time, such as "2 p.m." or "30 minutes later"。
- Notifies you if there are open trades, but does not set a stop loss。
- Automated trading based on technical indicators such as RSI or moving averages。
- Remind your followers on Twitter when a tool hits a 30-day high。
- After winning 3 consecutive trades, send a message to celebrate your success。
- Remind you to stop trading after 4 consecutive losing trades, a balance drop of more than 3%, or a win-loss ratio of less than 30%。
- Notify you 10 minutes before important economic events。
- Open a new trade when the RSI is high on three different time frames。
- Order when RSI exceeds 70 or MACD signal line crossover occurs。
2.correlation matrix
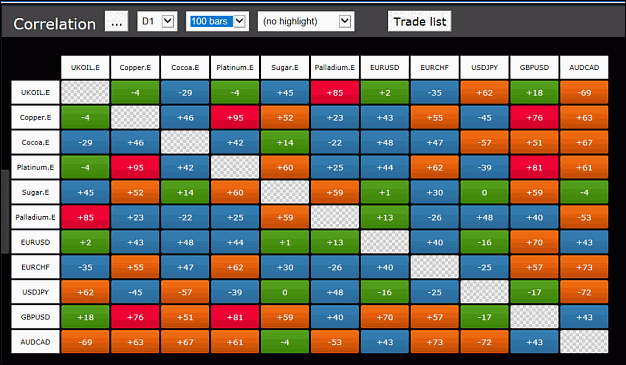
The "correlation matrix" on IC Markets is like a tool that tells you how similar two symbols are in price movements based on a certain period and number of bars (e.g., the last 100 H1 bars).。
This similarity is measured from -100 to + 100:
- + 100 means that two symbols move in the same way, called "positive correlation"。
- -100 means they move in opposite directions, such as one up and the other down, called "negative correlation"。
- 0 indicates that the symbol moves independently and there is no obvious connection。
Correlation is important because it affects your trading risk。For example, if you see a strong negative correlation between two symbols (about -95), it means that they are moving in opposite directions。So if you bet one symbol goes up and the other goes down, it's almost like making just one trade, because they balance each other out.。
It is generally a good idea to avoid making highly correlated trades。Otherwise, you could end up trading the same thing twice, or the trades cancel each other out。The correlation matrix can help you find out which symbols have strong or weak correlations to make more informed trading decisions。
3.Correlation Trader
Think of the Correlation Trader as a scaled-down version of the Correlation Matrix。It does not display many symbols, but only two symbols。
Its purpose remains unchanged。First, it can help you find symbols with strong or weak correlation。Second, it allows you to trade when you find these correlations change。
Remember to avoid highly correlated transactions。Because you could end up trading the same thing twice, or the trades cancel each other out。
4. Excel RTD
The Excel RTD application has several features:
- It can help you enter real-time data into Excel using Excel's RTD function。You don't need to deal with macros, programming, or XLL plug-ins。
- You can also send simple trading commands by VBA code in Excel。
You can use multiple Excel RTD applications for different accounts and then aggregate all account data into one spreadsheet。The app comes with a spreadsheet example where you can enter up to 5 account numbers。It will then automatically show you a dashboard with information about stocks, balances, symbol prices, and a list of open positions, all in one place。
5.Market Manager
The Market Manager has four main functions:
- It displays a "watch list" showing symbol prices and open positions。You can use it to close an existing position or open a new one。
- It provides basic information about your account such as net worth, balance and margin usage。
- It lists all open orders, including positions and pending orders。You can open each order in a separate window, make changes or close positions or orders。
- It gives you a short summary of the symbol's recent price movements。
6.Mini Terminal
The IC Markets mini terminal is like a window, you can place buy and sell orders with a large button。
You can use the boxes above the buy and sell buttons to determine the amount of the trade and set things such as stop loss, take profit or trailing stop loss。If you hold down the Ctrl key and click on these boxes, the calculator will open。
For example, suppose your trading volume is 0.25 lots, you want a stop loss that represents $100。You can hold down Ctrl + click the S / L box and let the calculator calculate how many points the $100 risk consists of。
7.Emotional trading
IC Markets Sentiment Trader shows you the percentage of traders who have bought or sold a trade.。This information does not come from price analysis, but is based on real money accounts shared on fxblue。
For example, www.fxblue.There are 5,845 real money accounts on com that buy EUR / USD and 2,378 accounts that sell EUR / USD。As a result, Sentiment Trader sees EUR / USD bullish (long) sentiment at 71%。
The list of available symbols is determined by the number of people who trade them。For trading instruments such as CADJPY, sentiment data cannot be provided because not enough traders hold open positions to calculate a meaningful percentage。
When a trader has multiple open orders for the same symbol, the sentiment calculation combines them into a net number。For example, if a trader has a buy 1.5 lots of orders, another sell 0.7 lots of orders, they will be seen as bullish。
Sentiment percentages do not take into account trade size。No matter how many traders do 0.1 hand or 50 hands, their impact on the data is the same, because www.fxblue.Some users on com have very large accounts and transaction sizes。
8.Time period map
A period map is a tool that tells you the times of important local trading sessions。This is an active time for professional traders in Sydney, Tokyo, London and New York。
It also flags upcoming news events and shares information about your trading profits and assets。It also gives you an idea of the price movements of each trading session。
Keep in mind that the time it displays is based on your computer's clock, so its accuracy depends on your computer's time。
9.Invisible Order
IC Markets stealth orders are a way to keep your buy and sell levels secret in the market。The app does not set orders that others can see, but immediately buys or sells at the current market price when the level of your choice is reached。
This means that there will be no orders in the market that others can see.。You can also use it to set hidden stop loss or take profit levels and automatically close positions when the price touches these levels。
The application has four main functions:
- Hidden entry: This is like limit orders and stop orders, you can create a set of orders, one of which is closed and the rest are cancelled。
- Stealth exit: Similar to setting a take profit or stop loss for a single trade。You can use cash to specify an exit point, such as "take profit at + $50," rather than a specific price.。
- Symbol exit: These exit points close all positions and orders for a particular symbol when a price is touched or its consolidated profit reaches a certain level。You can also apply filters such as "Only close EUR / USD multi-orders with 'breakout' in comments"。
- Account exit: when a certain level is reached, close all positions and orders for the entire account。
However, compared with ordinary pending orders, the use of invisible entry and exit has two disadvantages:
- With invisible orders, you may experience more slippage。Although sometimes it works in your favor。
- Invisible orders only work when the app is open and connected to a broker。In contrast, a typical pending order, stop loss or take profit order is still valid even when the trading software is not running。Or your network connection is down。
10.Check Chart Trader
"Tick Chart Trader" on IC Markets is a tool that displays different styles of tick charts, allowing you to quickly trade using your keyboard or mouse。These beat charts were created when you started using the app and it does not provide access to historical beat data。
The app offers five types of charts:
- runout diagram
- Bounce speed chart
- Timing Chart
- Beating Candle Diagram
- "Compare" Chart
It also provides a super fast way to enter and exit positions in a first-in, first-out (FIFO) manner using a keyboard or mouse。
11.Trading Terminal
The trading terminal is divided into three parts:
- Market observation
- Account Summary
- Order List
Click the double arrow in the title bar to narrow the account summary and order list。This will provide more space for market observation。
The trading terminal displays all activity in the account, not just orders from the trading terminal itself。For example, if you use an automated system in MT4 or conduct manual transactions, all of these will be displayed in the account summary and order list of the trading terminal。
Conclusion
In conclusion, the advanced tools of IC Markets MT4 are very useful for traders。These tools enhance your technical analysis capabilities and provide efficient execution。It also has a risk management function。
Although these tools are for experienced traders, novices can also give it a try。For example, there are indicators such as Candle Countdown, Free Plot indicator and Sentiment Trader。
If you want to use these tools, you can start practicing from a demo account。Once you have confidence, you can use them in your real trading account。
Disclaimer: The views in this article are from the original Creator and do not represent the views or position of Hawk Insight. The content of the article is for reference, communication and learning only, and does not constitute investment advice. If it involves copyright issues, please contact us for deletion.