Fresh Cardano (ADA) Sell Signal Suggests Price May Fail $0.50 Test
Cardano (ADA) fell to $0.38, with bearish signals from MVRV and price-DAA divergence pointing to possible further decline.
- Cardano (ADA) dropped from $0.42 to $0.38, with bearish indicators suggesting continued downward pressure.
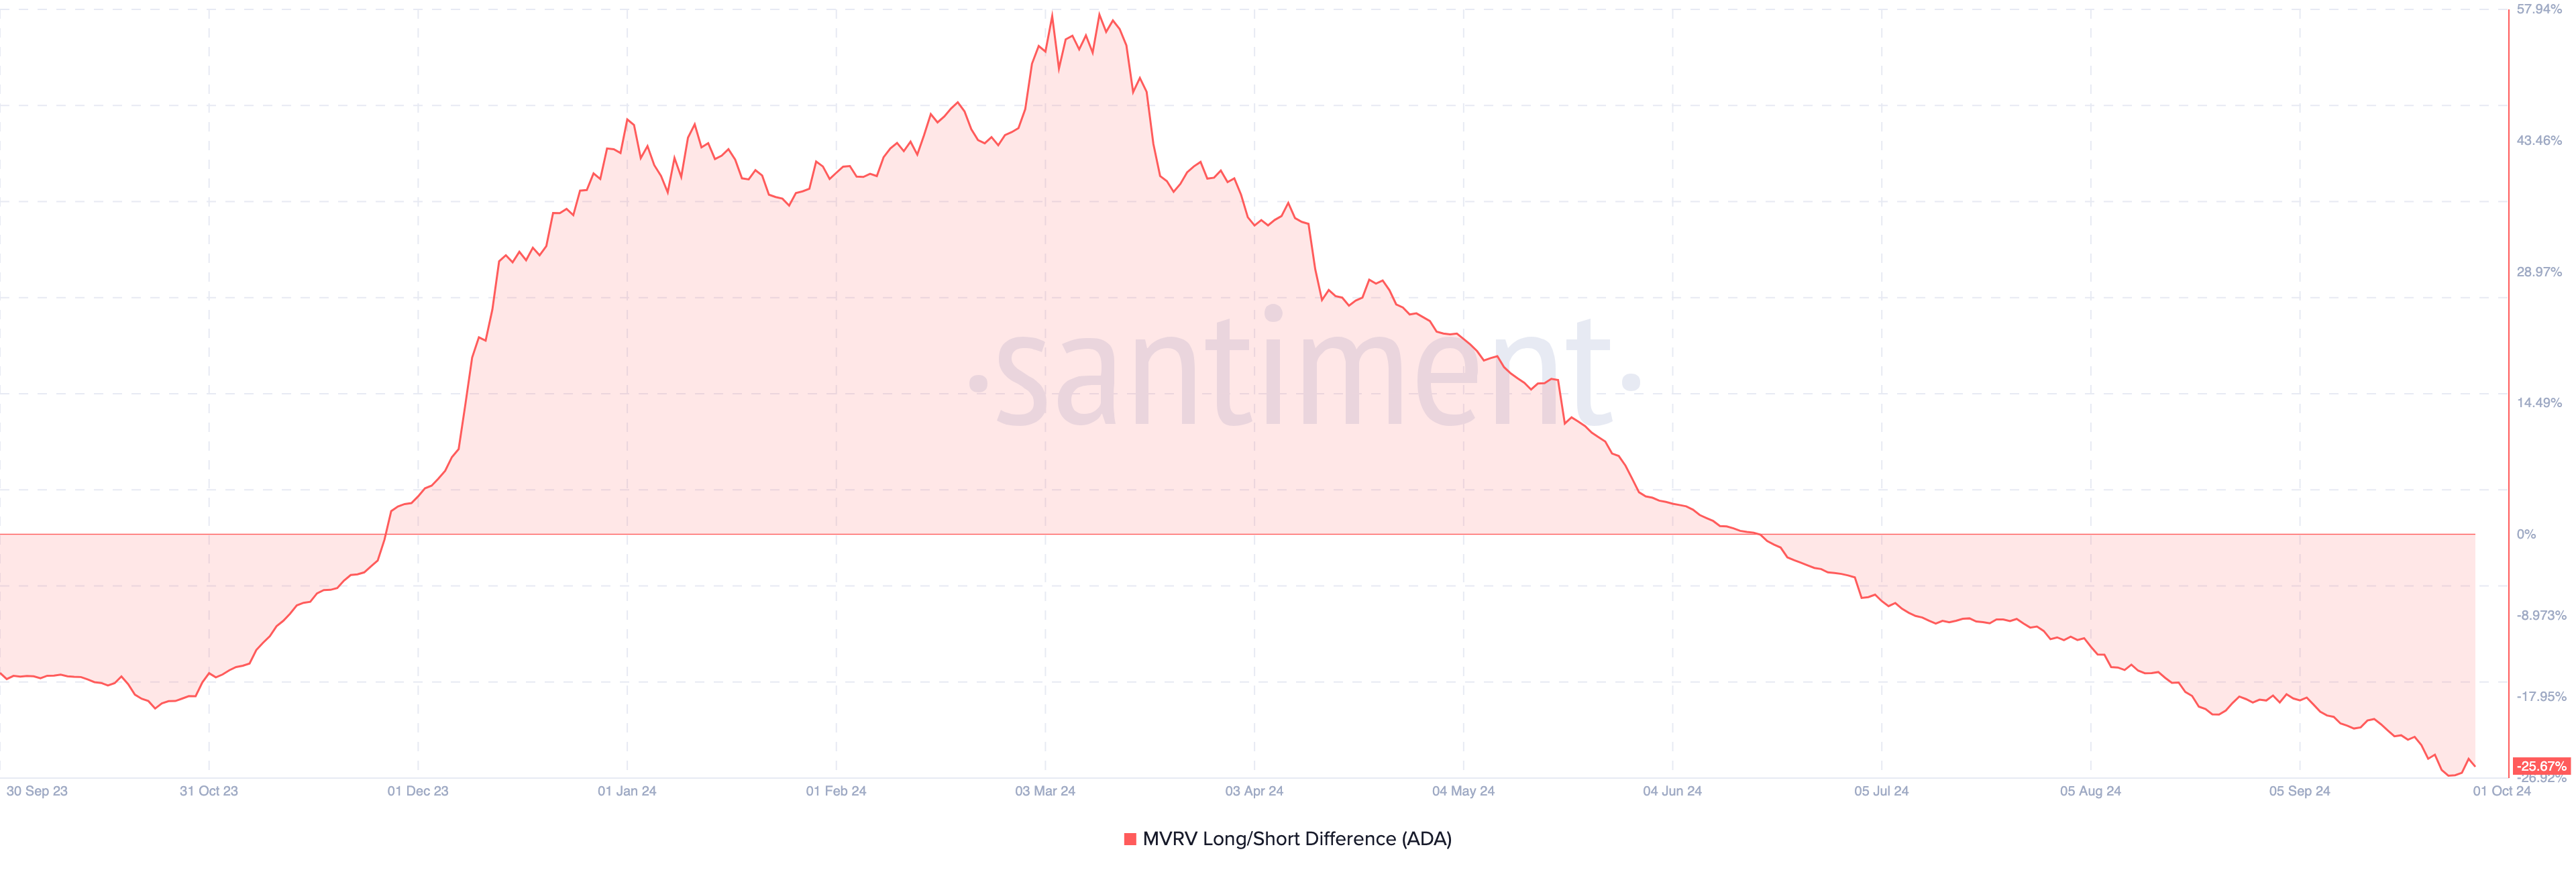
- MVRV Long/Short Difference is -25.67%, signaling more unrealized profits for short-term holders and bearish sentiment.
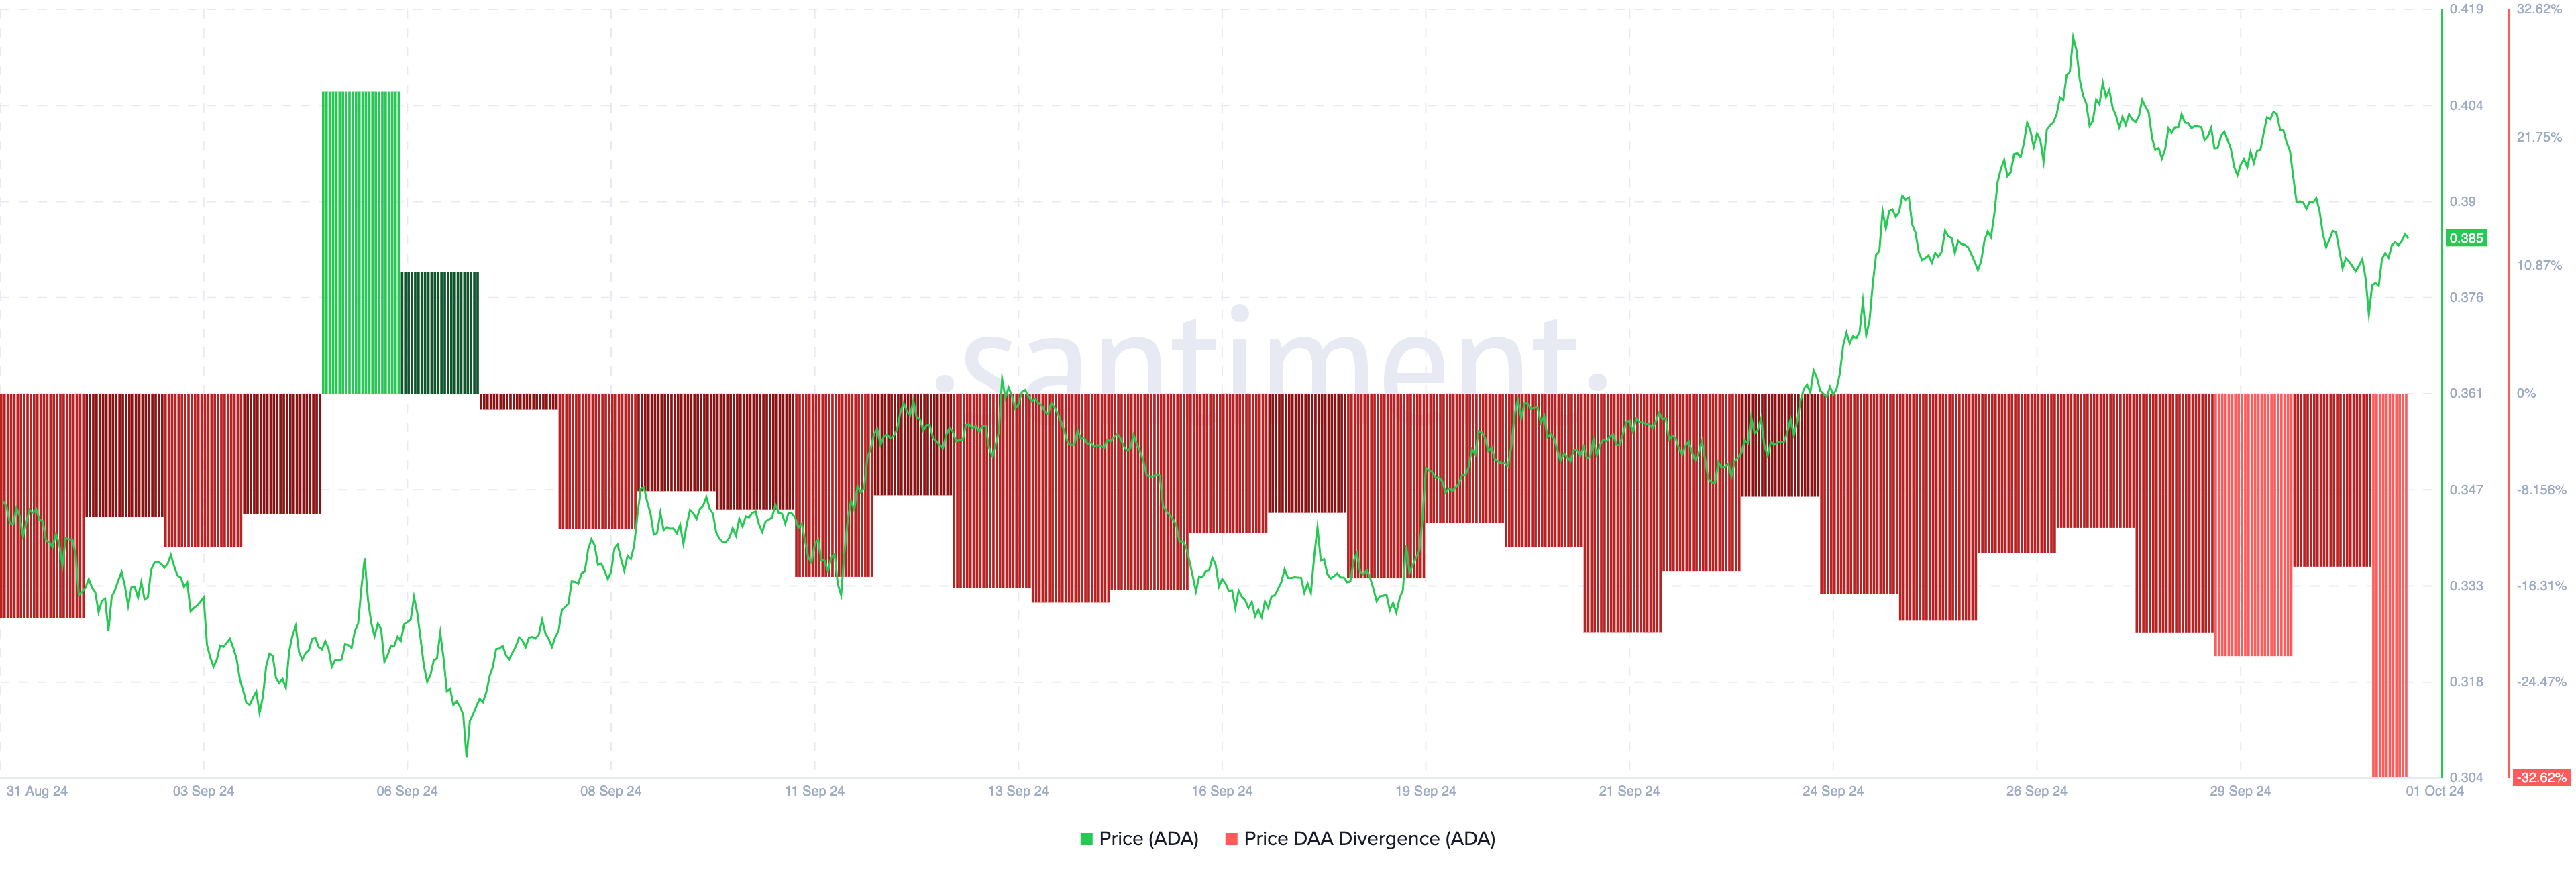
- The price-DAA divergence shows low user activity, further supporting a the technical analysis prediction to $0.35 or $0.31.

Just last week, Cardano’s (ADA) price was $0.42, as speculation spread that the token could rally toward $0.50. But today, this is no longer the case, as ADA’s price is $0.38.
While investors may be hoping for a quick rebound, this analysis suggests that Cardano may continue to face downward pressure.
Cardano Metrics Reveals It’s Not Time to Buy
One indicator supporting this outlook is Cardano’s Market Value to Realized Value (MVRV) Long/Short Difference. This oscillating indicator shows if long-term holders have more unrealized profits than short-term holders or otherwise.
When the MVRV Long/Short Difference is higher, the sentiment is bullish since long-term holders have the upper hand. Conversely, a negative Long/Short Difference indicates that short-term holders have more gains and is a bearish sign.
According to Santiment, Cardano’s MVRV Long/Short Difference is -25.67%, indicating that ADA is yet to exit the bearish phase. With demand dropping, this current condition indicates that Cardano’s price could be set for another fall.
Read more:How To Buy Cardano (ADA) and Everything You Need To Know
Another metric supporting this position is the price Daily Active Addresses (DAA) divergence. The DAA divergence shows whether the price increase is backed by user participation.
When the metric is positive, it means network activity is dominant, and if the price increases, it is a buy signal. However, a negative price-DAA indicates a dearth of user activity. For Cardano, it is the latter, suggesting a sell signal and predicting that ADA’s price might decrease.
ADA Price Prediction: Another Decline
An evaluation of the daily chart shows that Cardano’s price broke out of the descending triangle on September 22. Due to this, ADA moved up to $0.42 earlier. However, the token is currently swinging downward again.
This suggests that Cardano’s price might soon hit the horizontal support of the descending triangle. But first, that will only happen if the cryptocurrency slips below the support at $0.35. Should that be the case, ADA’s value could tank to $0.31.
Read more:Cardano (ADA) Price Prediction 2024/2025/2030

However, if bulls help ADA stay above $0.35, the price might bounce. This could also be due to increased interest and buying pressure around the token. In that scenario, Cardano’s price could climb to $0.40, and later on, hit $0.46 or as high as $0.50.
Disclaimer: The views in this article are from the original author and do not represent the views or position of Hawk Insight. The content of the article is for reference, communication and learning only, and does not constitute investment advice. If it involves copyright issues, please contact us for deletion.


