金融市场的牛市陷阱:如何获利?
牛市陷阱会困住各个市场的交易者。学习如何识别牛市陷阱,并通过交易,从被困交易者的损失中获利。

在金融市场中,各种陷阱层出不穷,而交易者们往往难以避免。其中,牛市陷阱(Bull Trap)是最常见的陷阱之一。尽管它看似简单易识别,但由于多方面影响,许多交易者还是会陷入其中。
什么是牛市陷阱?
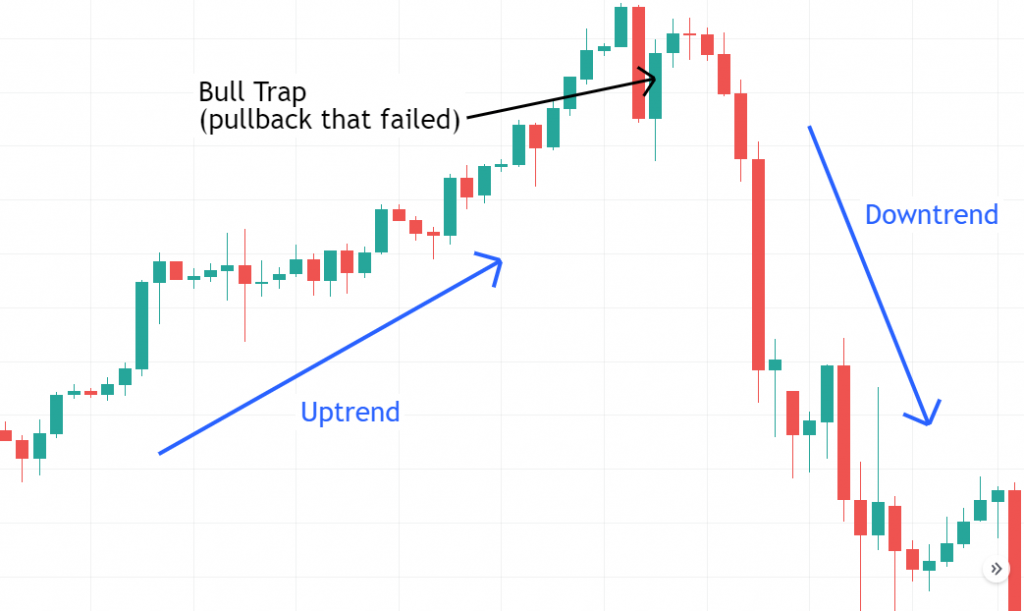
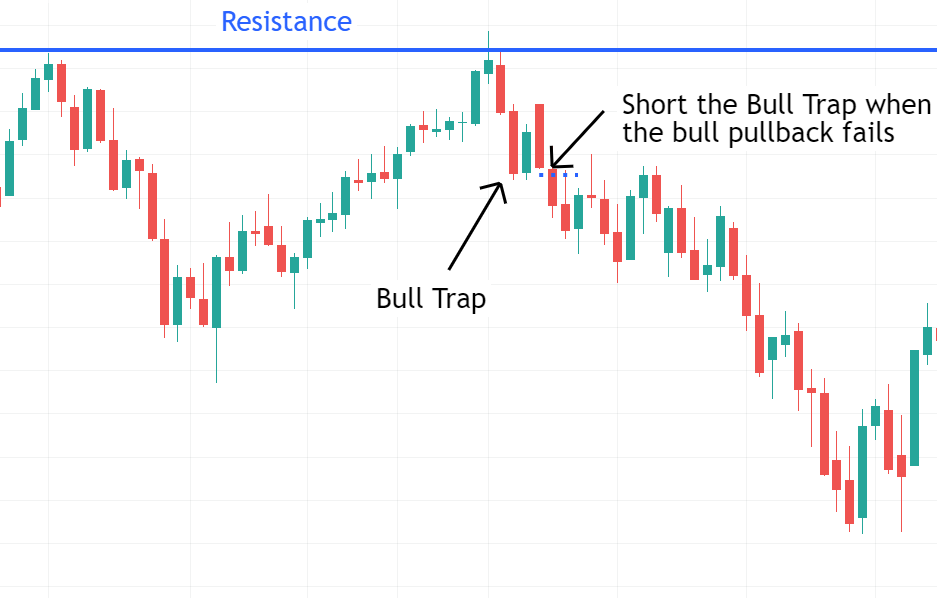
牛市陷阱是一种图表形态,通常会困住看涨的交易者。看涨交易者通常会在上涨趋势中加仓,并在价格回撤到较低水平时再次买入,然后在价格创新高时获利。然而,当价格回撤失败并开始下跌时,他们就会被困住。这种形态尤其常见于“拉高出货”策略开始失效的时候。
牛市陷阱的关键位置
阻力位
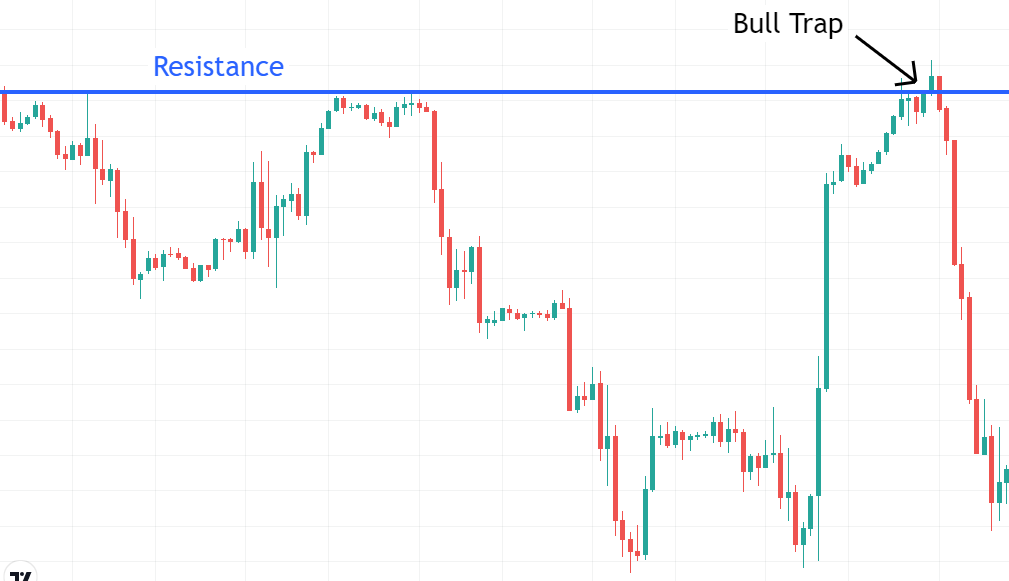
阻力位是价格趋势经常发生变化的经典位置。当价格达到阻力位时,卖压增加,导致价格难以继续上涨。在这种情况下,看涨交易者会期望价格突破阻力位并继续上涨,但实际上他们往往会在此被困住。
示例:某只股票的价格在某个阻力位多次受阻,每当价格达到这一水平,卖压就会增加,导致价格回落。
大幅下跌之后
在经历大幅上涨后,若出现剧烈下跌,意味着市场上存在强大的卖压。此时,跟随市场强弱势进行交易尤为重要。通常,大阴线或“点燃柱”显示出巨大的卖压,下一次回撤通常不会成为买入机会。
示例:某只股票在持续上涨后,突然出现大幅下跌,形成一根长阴线,预示着市场卖压强大,回撤后可能再次下跌。
价格远离移动平均线
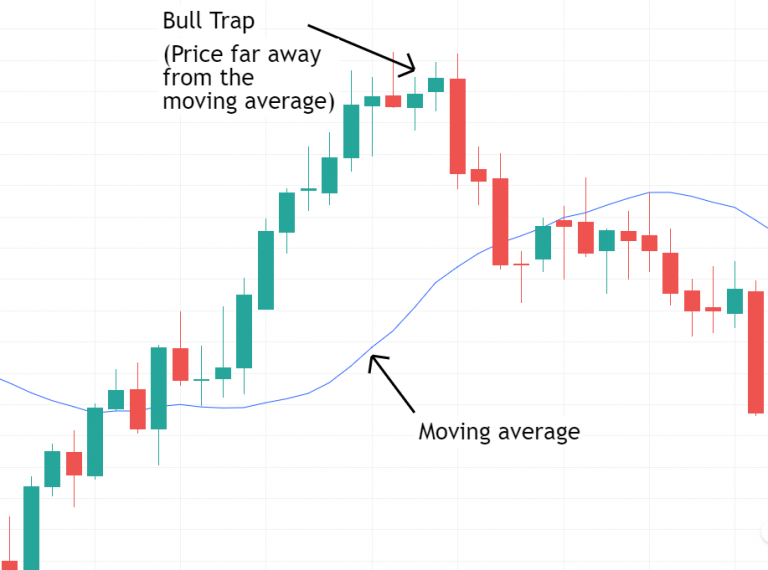
移动平均线是判断市场趋势的重要指标。当价格远离移动平均线时,通常会失去动力,并倾向于回到移动平均线。因此,最佳交易时机是在价格接近移动平均线并准备再次反弹的时候。
示例:某只股票的价格远离其50日移动平均线后,回撤的可能性增加,在此位置买入的交易者可能会被困住。
牛市陷阱出现的时间
牛市陷阱可以出现在任何时间框架,从周线图到1分钟图,无论是日内交易、剥头皮交易还是波段交易,这些陷阱都会反复出现。时间框架的不同只影响其规模,但并不改变其本质。
牛市陷阱与熊市陷阱
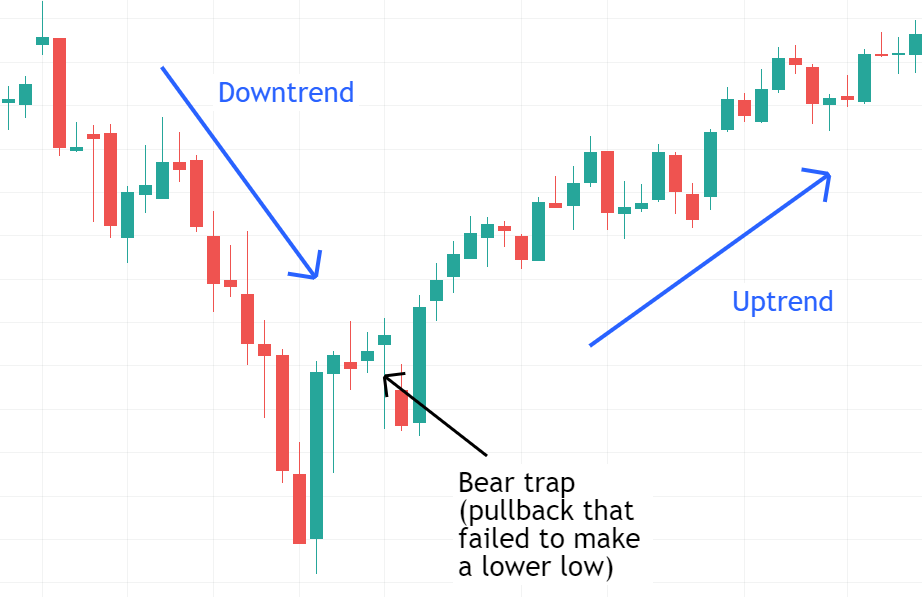
牛市陷阱与熊市陷阱相似,只是方向相反。牛市陷阱出现在上涨趋势中,而熊市陷阱则出现在下跌趋势的末端。两者的交易策略基本相同,都是利用趋势的逆转获利。
面对牛市陷阱如何进行交易?
面对牛市陷阱进行交易步骤如下:
-
等待价格满足趋势可能改变的条件。这些条件包括价格达到阻力位、远离移动平均线或出现强烈反向反应。头肩顶形态也是牛市陷阱的一种变形。
-
等待回撤形成。看涨交易者通常会在回撤时入场,但我们需要等待他们被困,然后寻找做空机会。
-
等待回撤失败或开始失败。激进的交易者可以在回撤形成后价格停滞并开始下跌时立即做空;保守的交易者可以等待价格跌破回撤后再做空。
示例:在某只股票的回撤失败后,价格开始下跌,激进的交易者可以立即做空,而保守的交易者则可以等待价格确认下跌趋势后再入场。
为什么牛市陷阱后价格会下跌?
-
大量空头进入市场:空头交易者的卖压会推动价格下跌,导致市场出现剧烈的下跌反应。
-
看涨交易者平仓:当价格对看涨交易者不利时,他们的止损单会被触发,从而增加市场卖压。随着止损单的不断触发,卖压进一步加大,价格会继续下跌,直到市场上的卖压得到释放。
总结
牛市陷阱是上涨趋势结束时常见的图表形态,最佳出现位置包括阻力位、远离移动平均线的位置或大幅下跌之后。牛市陷阱在任何时间框架和市场中都能发现,是做空获利的良机。
免责声明:本文观点来自原作者,不代表Hawk Insight的观点和立场。文章内容仅供参考、交流、学习,不构成投资建议。如涉及版权问题,请联系我们删除。