“Piercing” K线图形 - 定义及交易方法
Living Trading
2024-08-02 17:10:08
3.06W
全面了解关于“Piercing” K线图形的内容,包括其定义、交易方法以及最佳交易策略。

“Piercing” K线图形是一种经典的日本K线形态,主要用于识别短期的市场反转。它属于看涨反转模式,通常出现在价格经历了下跌之后。此模式表现为市场对更低价格的拒绝,预示着价格有可能会在短期内发生看涨的逆转。
通过观察“Piercing” K线图形,交易者可以获得潜在的买入信号。该模式与“Dark Cloud Cover” K线图形在形态上相似,但方向相反。前者是看涨反转信号,而后者则是看跌反转信号。
如何识别“Piercing” K线图形?
识别“Piercing” K线图形时,需要满足以下几个关键条件:
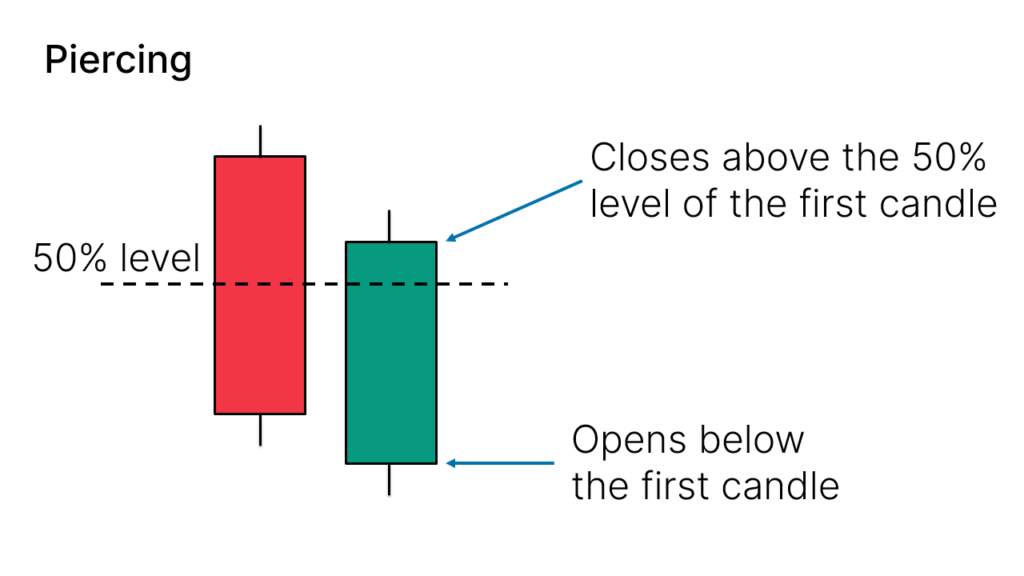
- 第一根K线:必须是看跌的K线,即开盘价高于收盘价,显示出市场的下行压力。
- 第二根K线:必须是看涨的K线,即开盘价低于第一根K线的收盘价(形成一个缺口),且收盘价高于第一根K线实体的一半。
- 形态特征:第一根K线的下影线较长,显示出市场的强烈卖压,而第二根K线则显示出买方的回暖和市场情绪的转变。
在实际图表中,Piercing K线图形的表现如下:
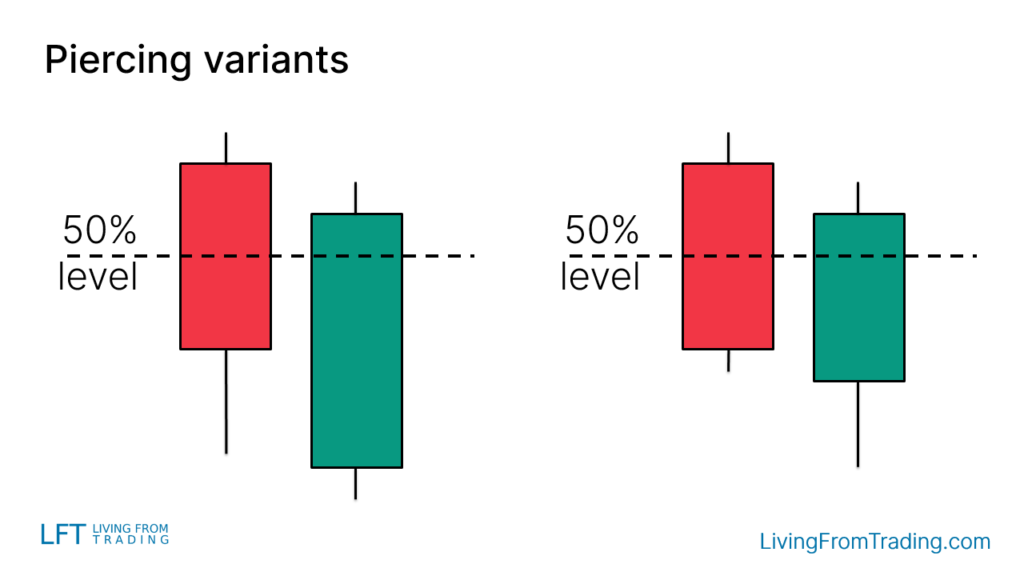
“Piercing” K线图形的变体
在不同市场环境下,Piercing K线图形的表现可能会有所不同。以下是几种常见的变体:
- 带有下影线的K线:第一根或第二根K线可能具有较长的下影线,进一步验证市场对更低价格的拒绝。
- 颜色变化:图形中的红色(看跌)和绿色(看涨)K线的比例不同,也可能影响对图形的解读。
交易策略
成功交易“Piercing” K线图形不仅仅依赖于其形态,还需要考虑其出现的位置和市场环境。以下是几种具体的交易策略:
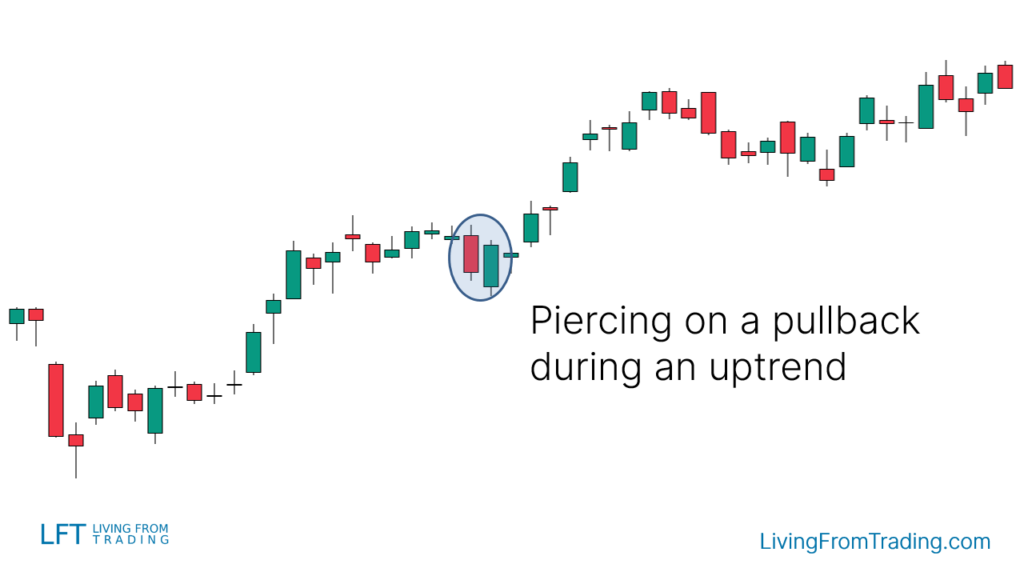
策略一:裸图回调
- 策略说明:在上涨趋势中,等待价格回调至某个水平,然后观察是否出现“Piercing” K线图形。该图形常常预示着回调的结束和新的上涨阶段的开始。
- 操作步骤:确定上涨趋势,等待回调,识别“Piercing”图形,确认突破后开仓做多。
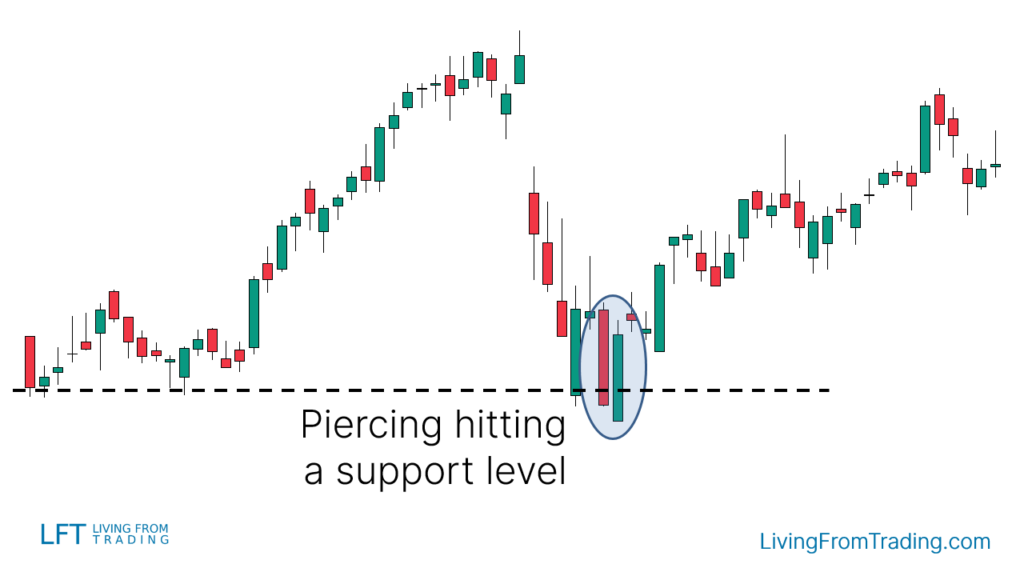
策略二:与支撑位结合交易
- 策略说明:支撑位是价格反转的关键区域。在支撑位附近出现“Piercing” K线图形时,可能标志着价格反弹的开始。
- 操作步骤:绘制支撑位,等待价格下跌至支撑位并形成“Piercing”图形,价格突破高点后开仓做多。
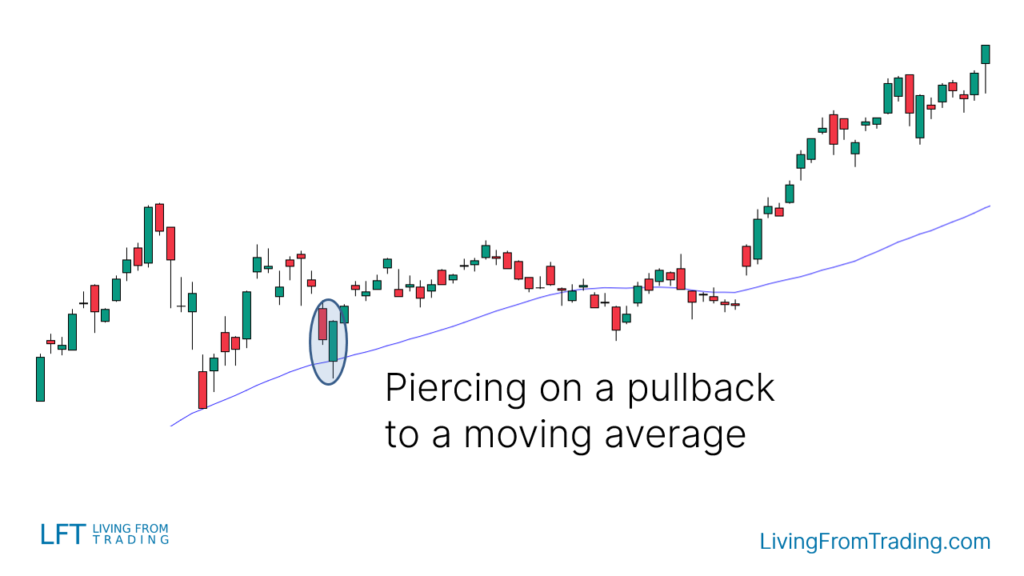
策略三:与移动平均线结合交易
- 策略说明:在上涨趋势中,当价格回调至移动平均线附近并形成“Piercing”图形时,可能预示着趋势将继续。
- 操作步骤:找出移动平均线,观察价格回调,形成“Piercing”图形后,确认突破移动平均线的高点进行开仓。
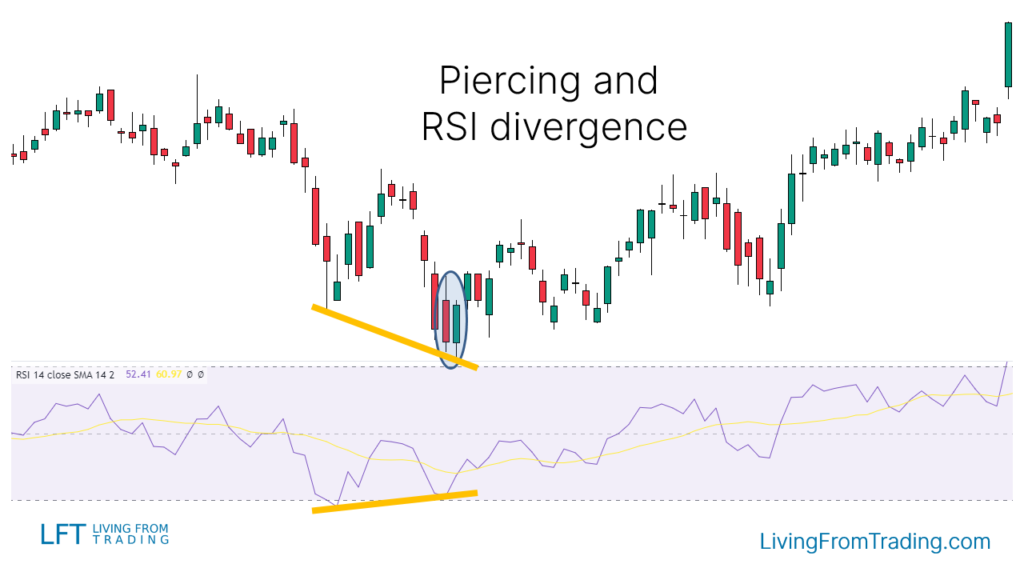
策略四:与RSI背离结合交易
- 策略说明:RSI背离是一个重要的反转信号。当价格下跌并形成新低,但RSI却出现背离,结合“Piercing”图形可以提供额外的确认信号。
- 操作步骤:识别价格低点和RSI背离,待“Piercing”图形出现后,突破高点开仓做多。
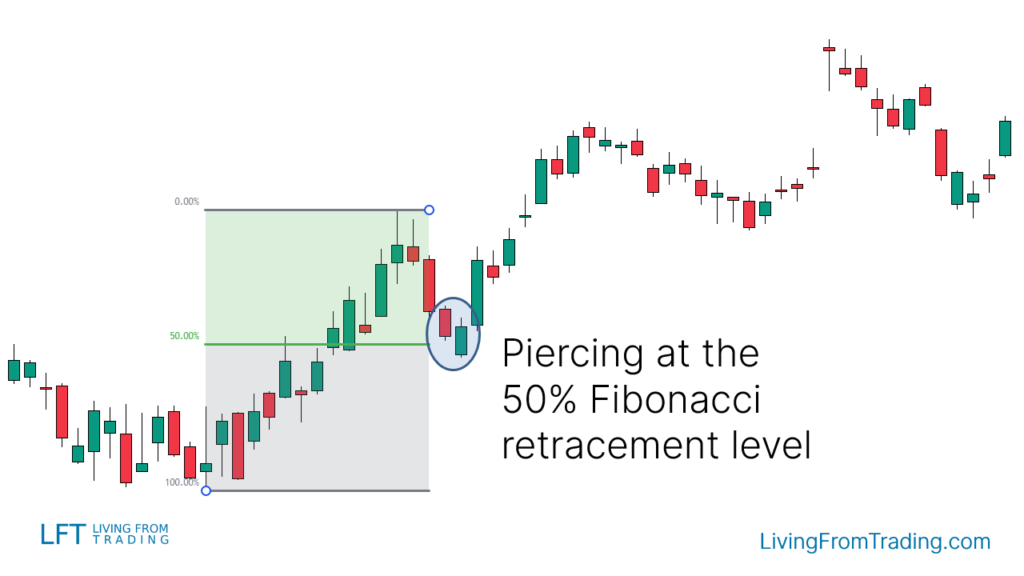
策略五:与Fibonacci回撤结合交易
- 策略说明:Fibonacci回撤水平可以作为潜在的反转点。当价格在这些水平处形成“Piercing”图形时,可以增加交易的成功率。
- 操作步骤:绘制Fibonacci回撤水平,等待价格到达这些水平并形成“Piercing”图形,突破高点后开仓。
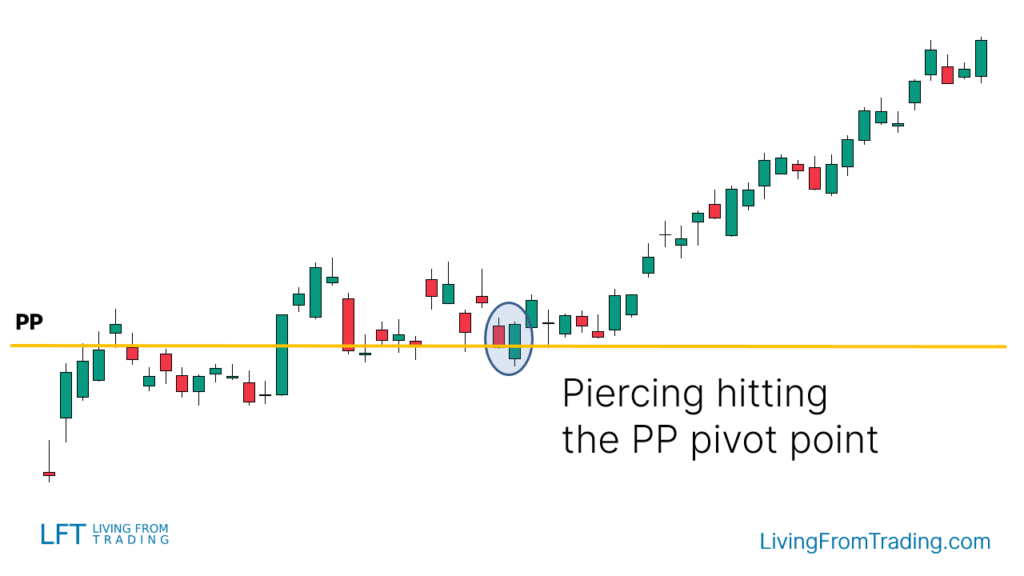
策略六:与Pivot点结合交易
- 策略说明:Pivot点是自动计算的支撑和阻力水平,用于日内交易时的常用工具。当价格在Pivot点附近出现“Piercing”图形时,通常表示反弹机会。
- 操作步骤:启用Pivot点指标,等待价格回调至Pivot点,出现“Piercing”图形后,突破高点开仓做多。
总结
“Piercing” K线图形是一种看涨反转模式,通常出现在价格下跌后,预示市场可能会反弹。该图形由两根K线组成:第一根是看跌的,第二根是看涨的,且第二根K线的收盘价高于第一根K线实体的一半。
成功识别和交易“Piercing” K线图形不仅依赖于图形本身,还需结合市场环境和其他技术指标,如支撑位、移动平均线、RSI背离、Fibonacci回撤和Pivot点等。
免责声明:本文观点来自原作者,不代表Hawk Insight的观点和立场。文章内容仅供参考、交流、学习,不构成投资建议。如涉及版权问题,请联系我们删除。