“Bullish Harami” K线图形 - 定义及交易方法
全面了解关于“Bullish Harami” K线图形的内容,包括其定义、交易方法以及最佳交易策略。
Bullish Harami K线图形是一种常见的看涨反转模式,在技术分析中具有重要地位。该模式通常出现在价格下跌之后,表现为市场对更低价格的拒绝。它预示着市场可能会出现反转上涨的机会,因此被广泛用于预测未来的价格走势。
Bullish Harami K线图形定义
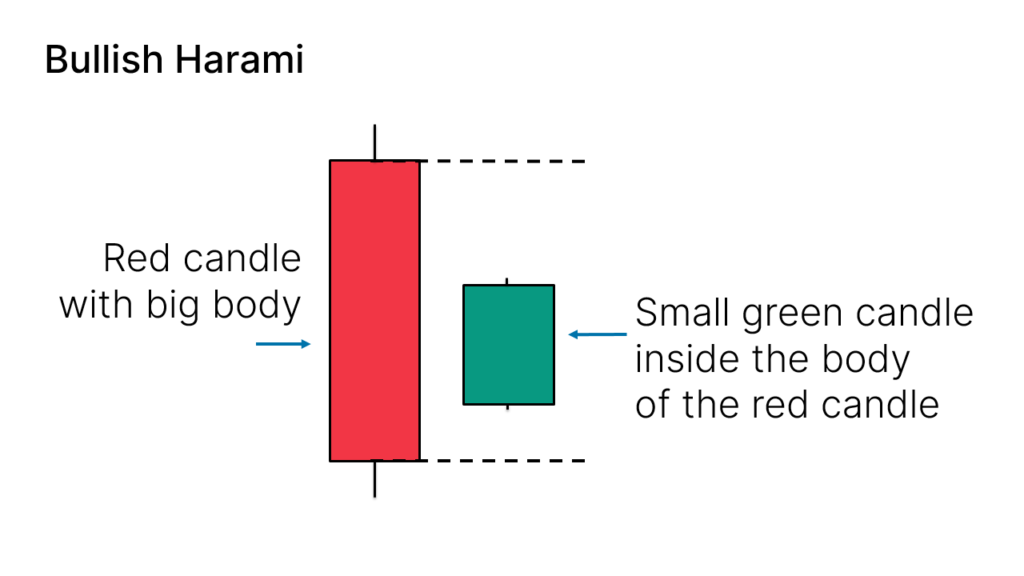
Bullish Harami 是一种由两根蜡烛线组成的日本蜡烛图形模式,其特征如下:
- 第一根蜡烛线:必须是看跌的,即实体较大且全日下跌。这根蜡烛线表明市场在之前的交易日内经历了显著的卖压。
- 第二根蜡烛线:必须是看涨的,即实体较小,并完全包裹在第一根蜡烛线的实体内部。这根蜡烛线显示出市场对低价的接受度较低,且可能开始出现买盘压力。
这一图形表明,在一段下跌趋势之后,市场出现了反弹的可能性,是看涨的信号。
Bullish Harami的识别方法
识别 Bullish Harami 图形需要注意以下几点:
- 第一根蜡烛线 是较长的阴线,反映出显著的卖压。
- 第二根蜡烛线 是短小的阳线,其开盘和收盘都在第一根蜡烛线的实体内。
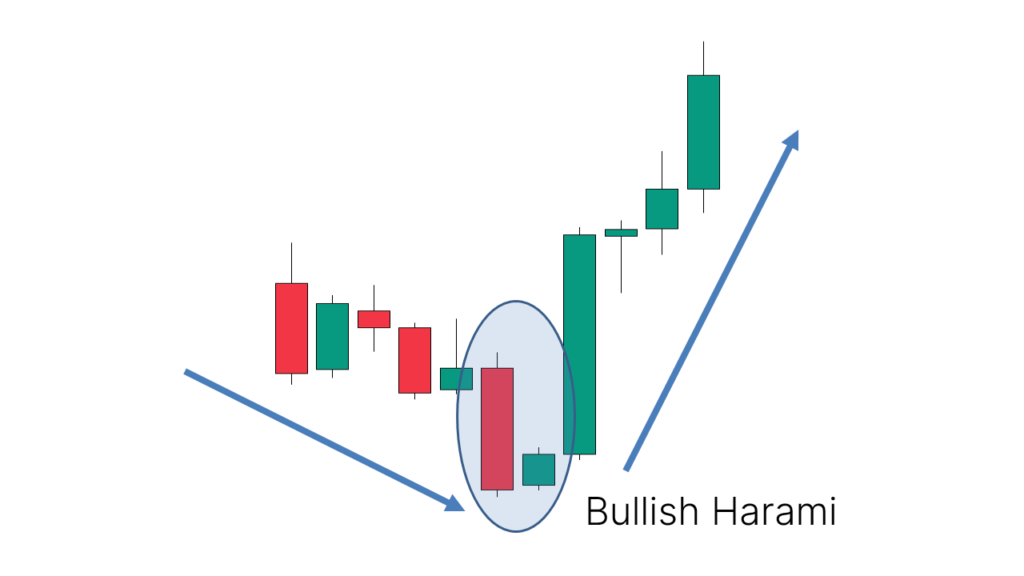
- 形态出现位置:该图形通常出现在价格下跌趋势的末端,表明可能的反转点。
在图表上,Bullish Harami 通常表现为一根大阴线后跟随一根小阳线,后者完全位于前者的实体内。
Bullish Harami的变体
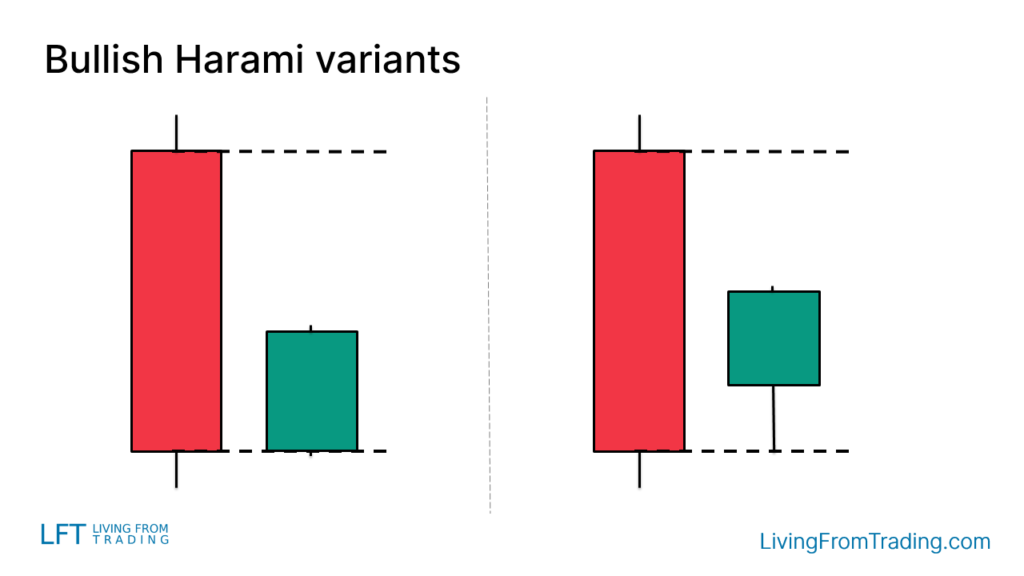
Bullish Harami 可能会出现一些变体,具体包括:
- 蜡烛线之间没有缺口:第二根蜡烛线可能与第一根蜡烛线之间没有明显的缺口。
- 影线较长:第二根蜡烛线的底部可能有较长的下影线,这表明市场有更强的买盘压力。
这些变种并不影响其作为看涨反转信号的有效性,但需要在分析时加以注意。
如何交易
进行交易时,需要综合考虑图形出现的位置以及市场的整体情况。以下是几种常用的交易策略:
-
发现图形:在价格下跌形成看跌趋势后,出现 Bullish Harami,是一个潜在的反转信号。交易者应关注图形的形成是否符合预期,并判断其出现的位置是否在关键的支持位或技术指标附近。
-
进场时机:交易者可以在价格突破 Bullish Harami 图形最后一根蜡烛线的高点时进场做多。这一突破信号通常预示着价格将进一步上涨。
-
止损设置:常见的止损方法是将其设置在图形的另一侧,即图形低点下方。这有助于在市场走势不如预期时限制损失。
交易策略
以下是针对 Bullish Harami 的几种有效交易策略:
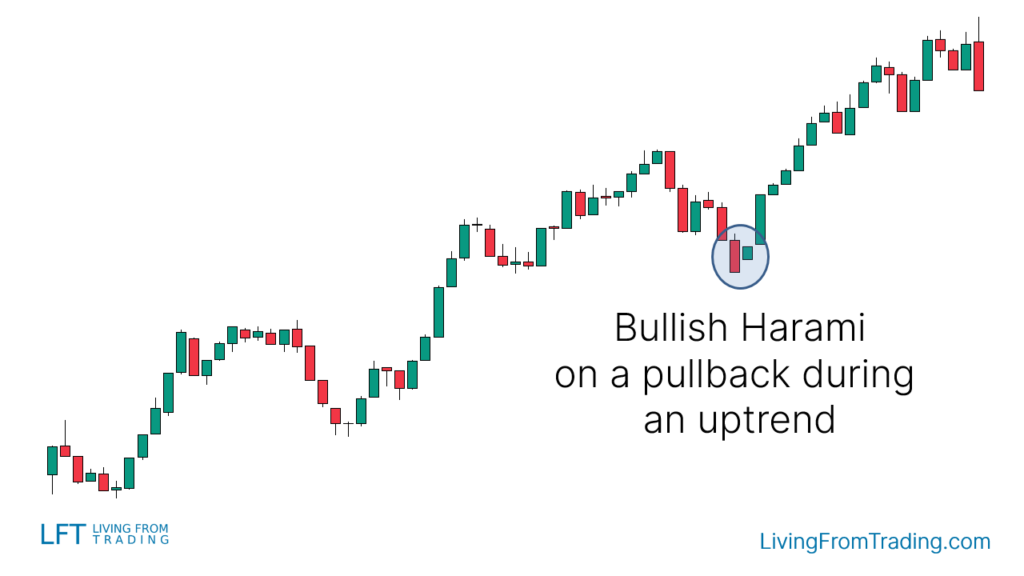
策略一:裸图回撤
- 策略描述:在上涨趋势中,等待价格回撤后出现 Bullish Harami 形态,通常标志着回撤结束和上涨新阶段的开始。
- 操作步骤:观察价格是否回撤至支撑位,并在出现 Bullish Harami 时进行买入。
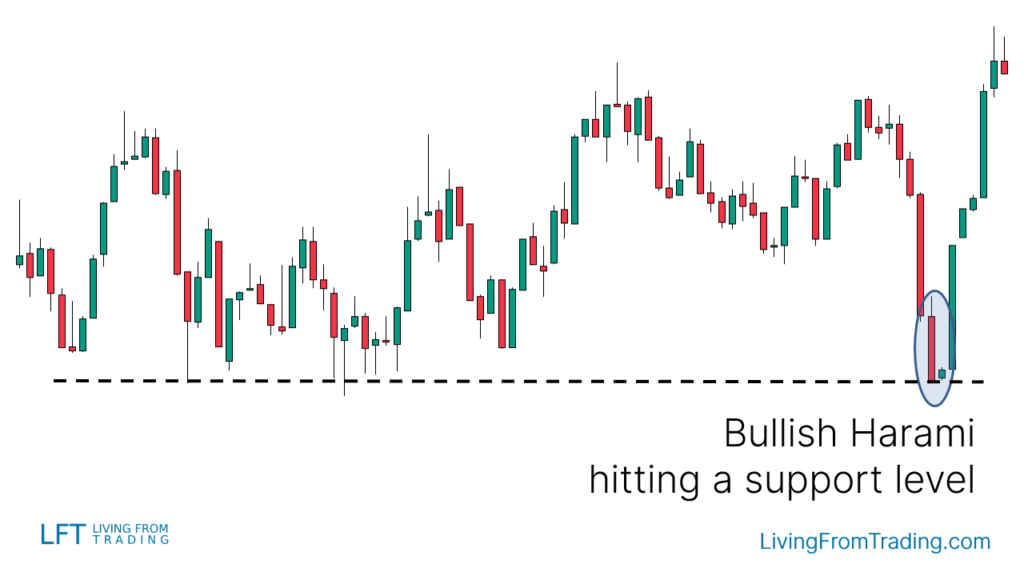
策略二:结合支持位交易
- 策略描述:支持位是寻找价格反转的关键区域。当 Bullish Harami 出现在支撑位时,通常预示着价格将反弹上涨。
- 操作步骤:在图表上绘制支撑位,等待价格下跌至支撑位并形成 Bullish Harami,然后在突破高点时做多。
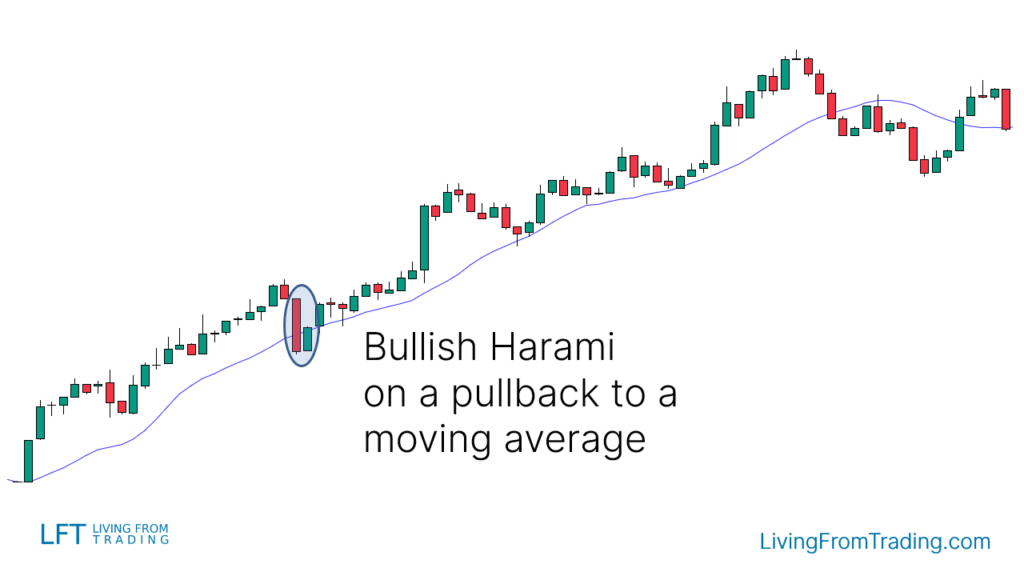
策略三:结合移动平均线交易
- 策略描述:在上涨趋势中,价格回调至移动平均线附近时,出现 Bullish Harami 是一个有力的买入信号。
- 操作步骤:寻找价格在移动平均线附近形成 Bullish Harami,并在突破高点时进场做多。
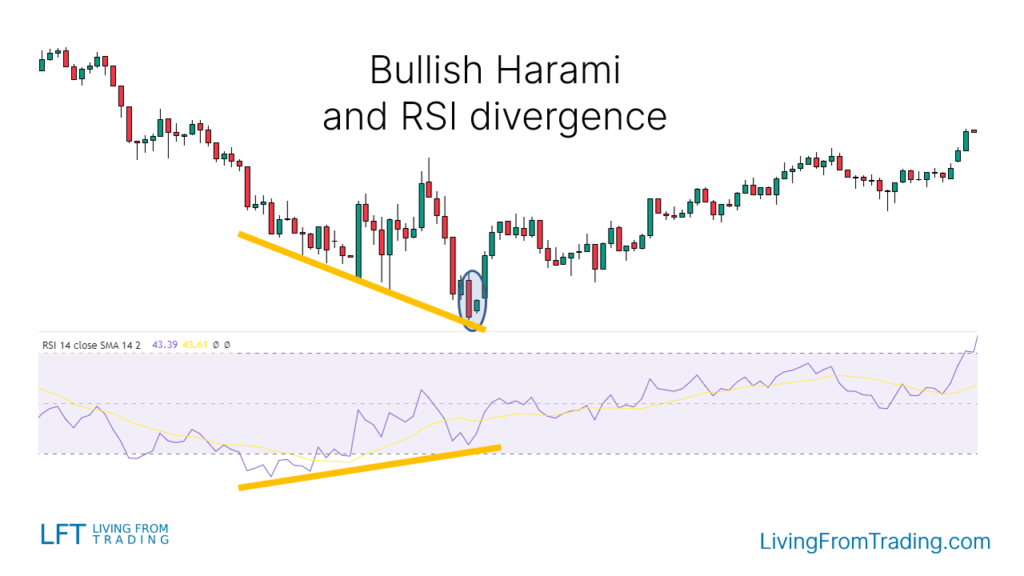
策略四:结合RSI背离交易
- 策略描述:当价格下跌形成新低,而RSI指标却形成新高,表明市场可能出现反转。
- 操作步骤:识别RSI背离信号,并在价格低点形成 Bullish Harami 时进场做多。
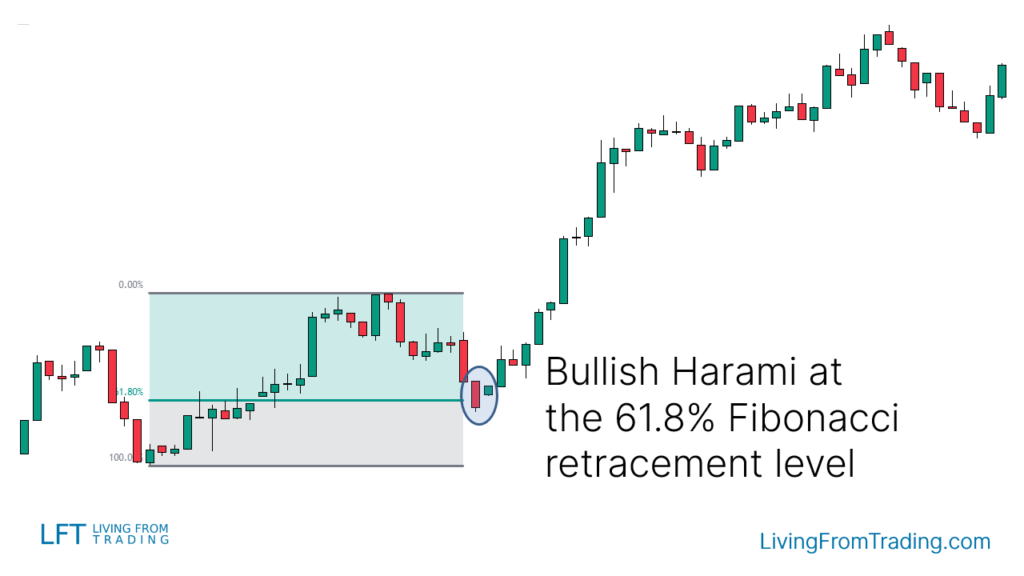
策略五:结合Fibonacci回撤交易
- 策略描述:Fibonacci回撤水平可以帮助识别价格的反转点。当 Bullish Harami 在Fibonacci回撤水平处出现时,是一个买入信号。
- 操作步骤:使用Fibonacci工具绘制回撤水平,并在价格触及这些水平并形成 Bullish Harami 时进场做多。
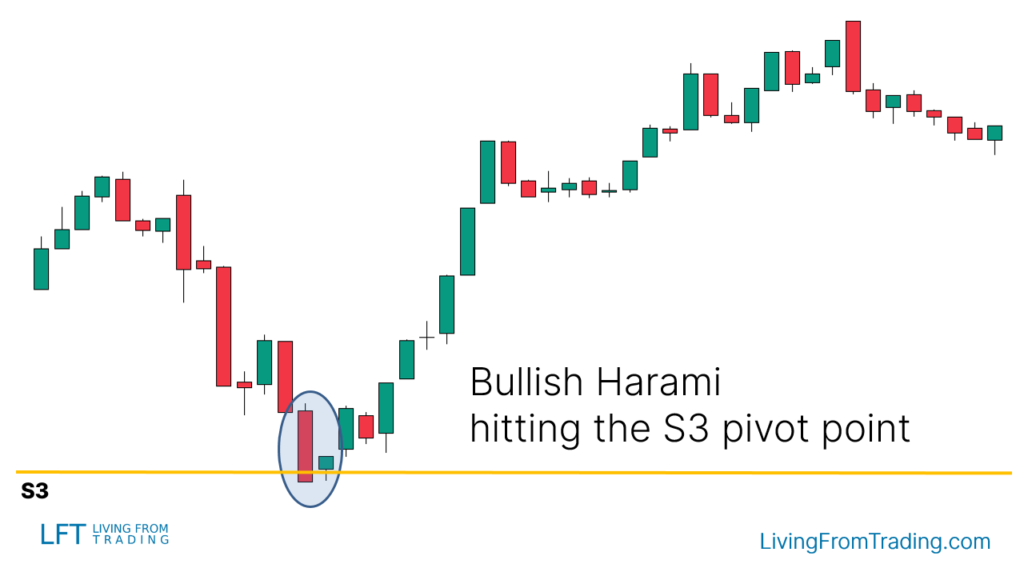
策略六:结合Pivot Points交易
- 策略描述:Pivot Points提供自动计算的支持和阻力水平,适用于日内交易。
- 操作步骤:在图表上应用Pivot Points指标,观察价格是否回落至Pivot Point水平并形成 Bullish Harami,然后在突破高点时做多。
总结
Bullish Harami 是一种有效的看涨反转模式,尤其在价格下跌之后出现时,通常预示着市场可能会反弹。通过结合移动平均线、RSI、Fibonacci回撤等技术分析工具,可以进一步提高交易的准确性和成功率。
免责声明:本文观点来自原作者,不代表Hawk Insight的观点和立场。文章内容仅供参考、交流、学习,不构成投资建议。如涉及版权问题,请联系我们删除。