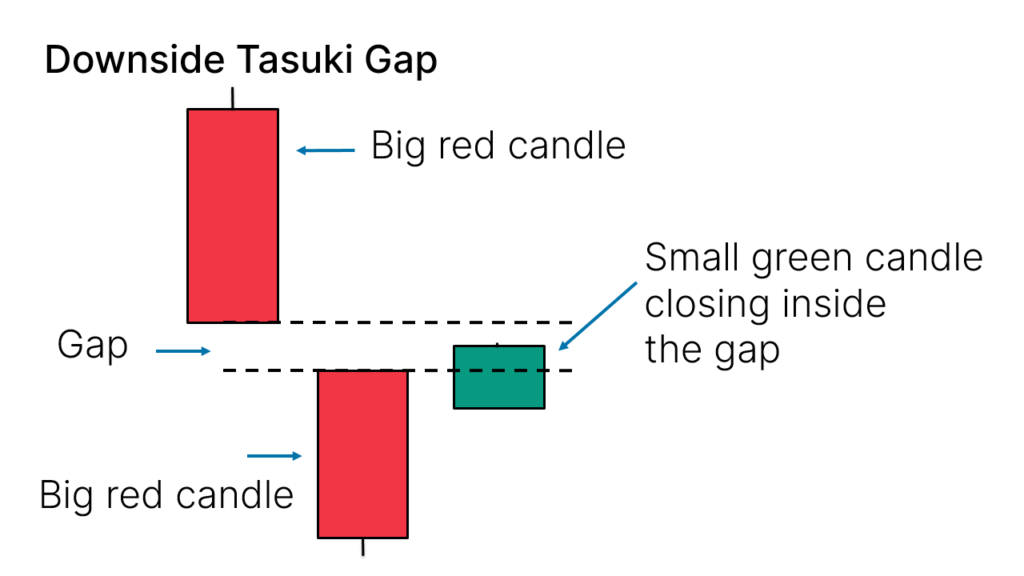
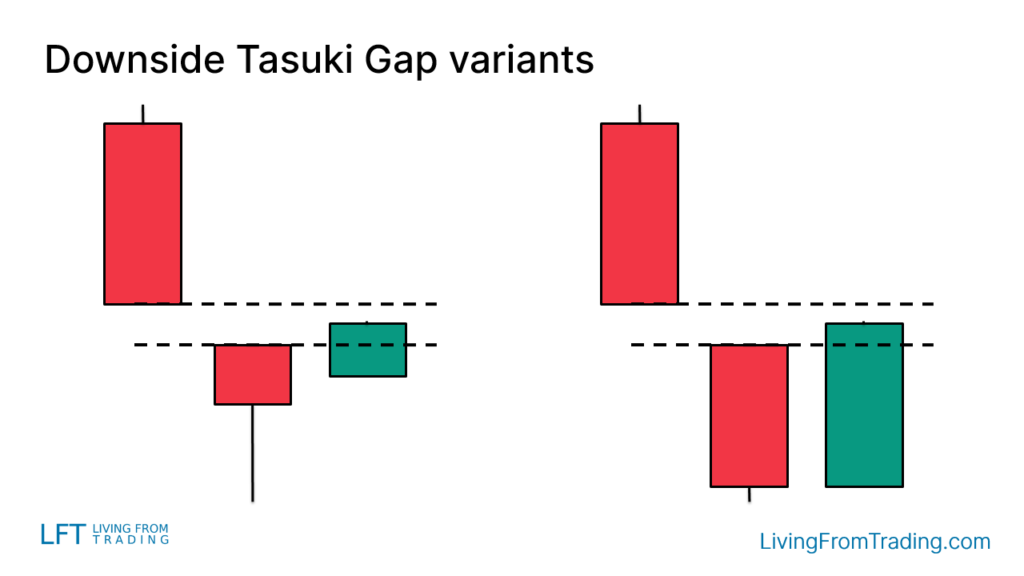
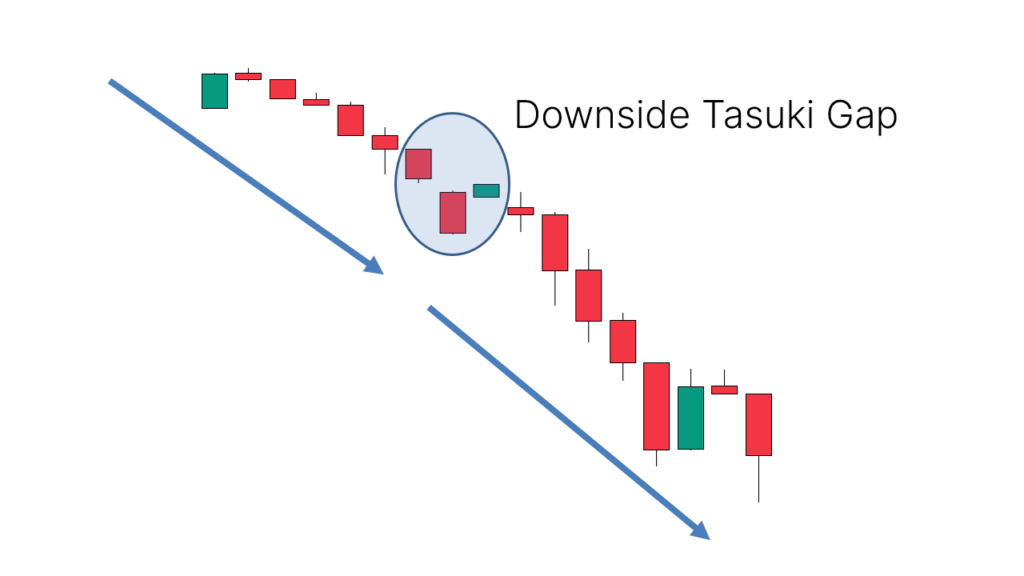
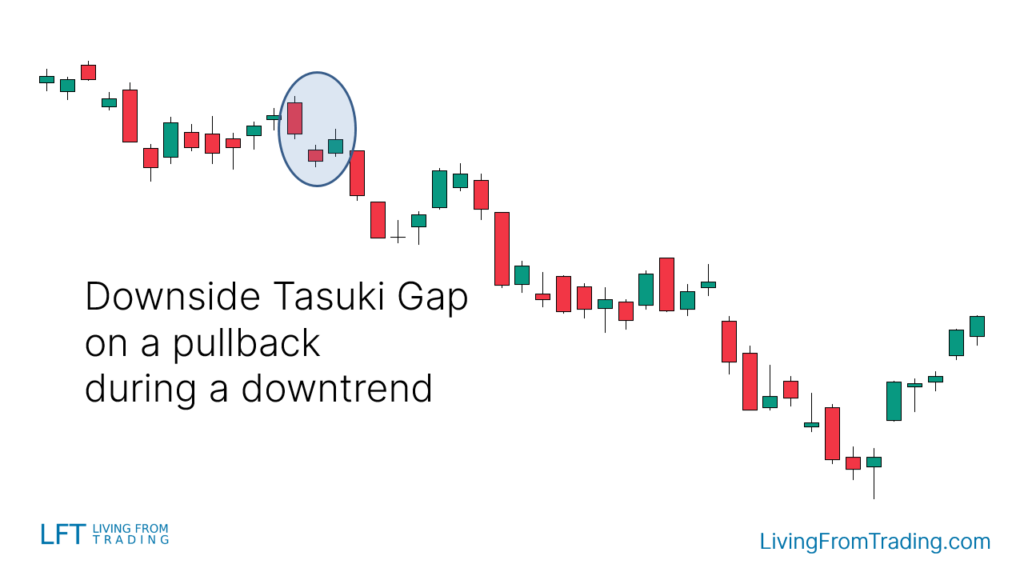
“Downside Tasuki Gap” K线图形 - 定义及交易方法
全面了解关于“Downside Tasuki Gap” K线图形的内容,包括其定义、交易方法以及最佳交易策略。

“Rising Window”是一种经典的日本蜡烛图形态,广泛用于技术分析中。这一图形通常在市场下跌后出现,作为反转信号,预示着潜在的价格上涨趋势。它被视为看涨的反转模式,通常在一个下跌趋势的底部形成。
“Rising Window” K线图形的识别
“Rising Window” K线图形由三根蜡烛线构成,其特征包括:
- 两根连续的红色实体蜡烛:前两根蜡烛都是红色的,并且价格持续下跌。这表明市场在经历下行压力。
- 明显的间隙:第二根红色蜡烛的收盘价与第三根蜡烛的开盘价之间有一个向上的间隙,这种间隙表示市场价格的突然变化。
- 第三根蜡烛:最后一根蜡烛通常是绿色的,其开盘价高于前两根蜡烛的最高价,并且它的收盘价高于开盘价,显示出市场的看涨趋势。
“Rising Window” K线图形的变体
在实际应用中,“Rising Window”图形可能表现出以下几种变体:
- 蜡烛的影线:蜡烛可能有不同的上影线或下影线,影响图形的视觉效果。
- 间隙的大小:最后一根蜡烛的开盘价与前一根蜡烛的收盘价之间的间隙可能有所不同,这取决于市场的波动性。
如何交易
在交易“Rising Window”图形时,仅仅识别图形的形状是不够的,还需要关注其出现的位置和市场环境。以下是一些交易策略:
-
开盘交易信号:当第三根蜡烛的最低价被突破时,这是一个保守的卖空触发点。此时市场信号强烈,建议进行卖空操作。
-
止损设置:为了防范市场波动带来的风险,可以在“Rising Window”图形的另一侧设置止损位,以保护投资资金。
-
风险管理:设置合理的止盈点和止损点是交易成功的关键。确保在交易时能够应对市场的潜在波动。
交易策略
交易“Rising Window” K线图形时,除了识别图形本身,还需结合其他市场分析工具和策略来提高交易的准确性和成功率。以下是详细的交易策略:
1. 裸图回撤交易
当市场处于明显的下跌趋势中,“Rising Window” K线图形常作为价格回撤的信号。此策略通过等待价格回撤并出现“Rising Window”图形后进行交易,从而捕捉趋势的延续。
具体步骤:
- 识别趋势: 首先确认市场处于下跌趋势中,可以通过观察价格走势的高点和低点来判断。
- 等待回撤: 在下跌趋势中,价格往往会经历反弹或回撤。此时观察市场是否形成“Rising Window”图形。
- 交易执行: 当回撤结束并且“Rising Window”图形出现时,确认回撤完成,准备执行卖空操作。
- 止损设置: 将止损设置在图形的另一侧,以防止市场走势与预期不符。止损点应设在最后一根蜡烛的高点上方。
假设市场在经历了一段下跌后出现了一次回撤,随后形成了“Rising Window”图形。此时可以在价格回到下降趋势线附近时进行卖空交易,并设置合理的止损和止盈点。
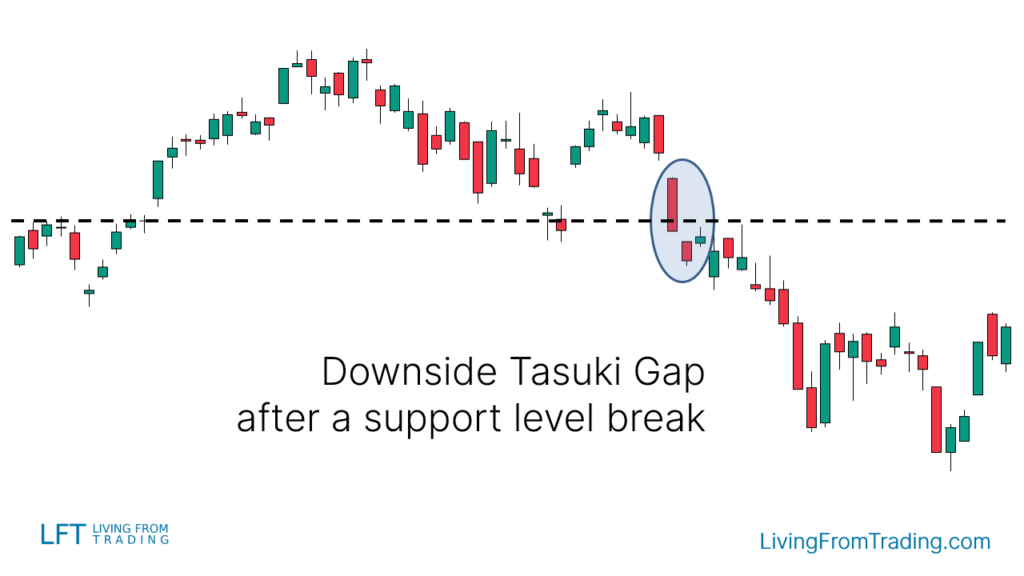
2. 结合支撑位交易
在支撑位破裂后,如果出现“Rising Window”图形,通常意味着支撑位被突破并可能引发进一步的下跌。
具体步骤:
- 绘制支撑位: 在图表上标记重要的支撑水平。这些水平是价格多次触及并未突破的价格区间。
- 价格突破支撑位: 等待价格突破支撑位并回测。支撑位被突破后,价格通常会反弹回测试支撑位。
- 确认“Rising Window”图形: 在回测过程中,如果出现“Rising Window”图形,表明价格在支撑位下方形成了看跌信号。
- 执行卖空: 在“Rising Window”图形形成后,当价格突破最后一根蜡烛的低点时进行卖空操作。
- 止损和止盈设置: 将止损设置在“Rising Window”图形的高点上方,止盈点可以设置在下一个支撑位附近。
例如,市场在下跌过程中触及并突破了一个重要的支撑位,随后价格回测支撑位并形成了“Rising Window”图形。在支撑位突破并回测的过程中,可以进行卖空交易,并设置合理的止损和止盈点。
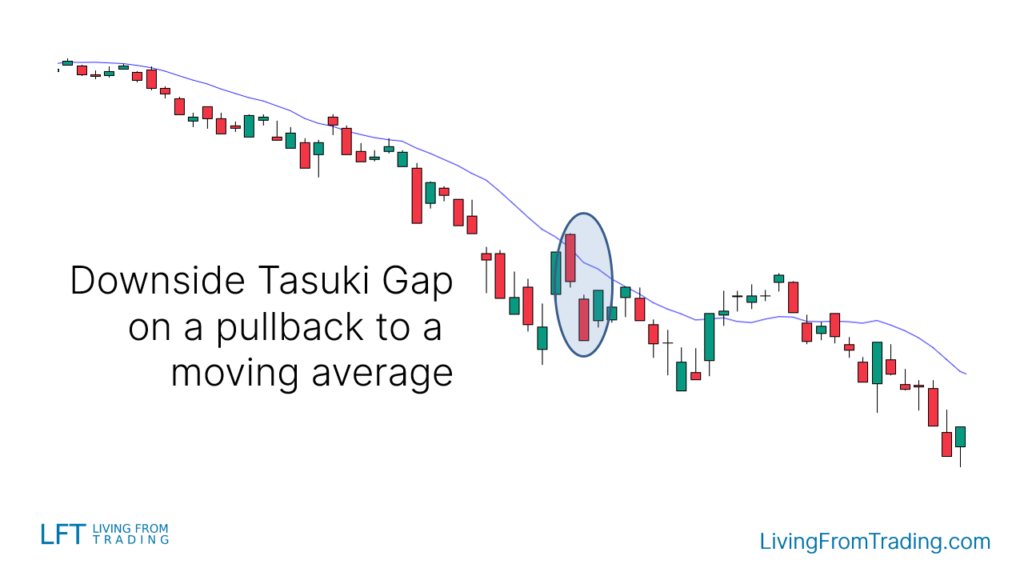
3. 结合移动平均线交易
移动平均线作为趋势跟随工具,可以帮助确认市场的趋势。当价格回升触及移动平均线并形成“Rising Window”图形时,通常标志着趋势的延续。
具体步骤:
- 确定移动平均线: 选择适当的移动平均线(如50日或200日移动平均线),以确认市场的长期趋势。
- 等待价格触及移动平均线: 当市场处于下跌趋势中,等待价格回升并触及移动平均线。
- 观察“Rising Window”图形: 在价格触及移动平均线时,观察是否形成“Rising Window”图形。
- 执行卖空: 在“Rising Window”图形出现后,当价格突破最后一根蜡烛的低点时进行卖空操作。
- 止损和止盈设置: 将止损设置在图形的高点上方,止盈点可以设在下一个支撑位附近。
假设市场在下跌趋势中触及50日移动平均线,并在移动平均线附近形成了“Rising Window”图形。这时可以进行卖空交易,并根据市场情况设置止损和止盈点。
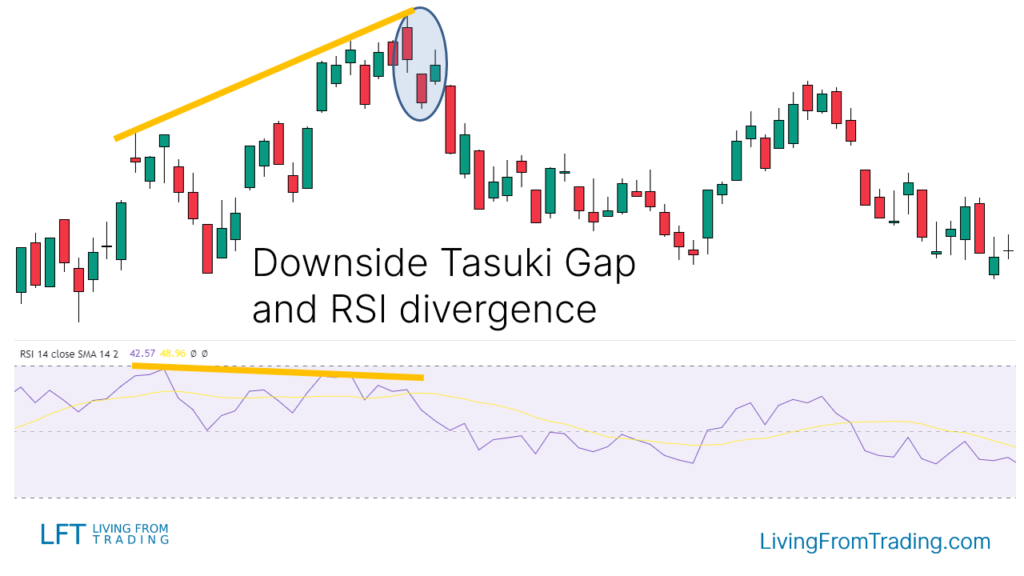
4. 结合RSI背离交易
RSI(相对强弱指数)背离是一种常见的技术分析工具。当价格形成新的高点,而RSI指标却显示出较低的高点时,通常预示着潜在的趋势反转。
具体步骤:
- 识别背离: 在上涨趋势中,标记价格的高点并对比RSI指标的高点。若价格持续创出新高,但RSI却未能同步创出新高,则为背离信号。
- 等待“Rising Window”图形: 在价格创出新高的同时,如果出现“Rising Window”图形,通常标志着反转信号。
- 执行卖空: 在“Rising Window”图形形成后,当价格突破最后一根蜡烛的低点时进行卖空操作。
- 止损和止盈设置: 将止损设置在“Rising Window”图形的高点上方,止盈点根据市场下跌趋势设置。
例如,市场在上涨过程中形成了新的高点,同时RSI显示出较低的高点。此时如果出现“Rising Window”图形,可以考虑卖空,并设置合理的止损和止盈点。
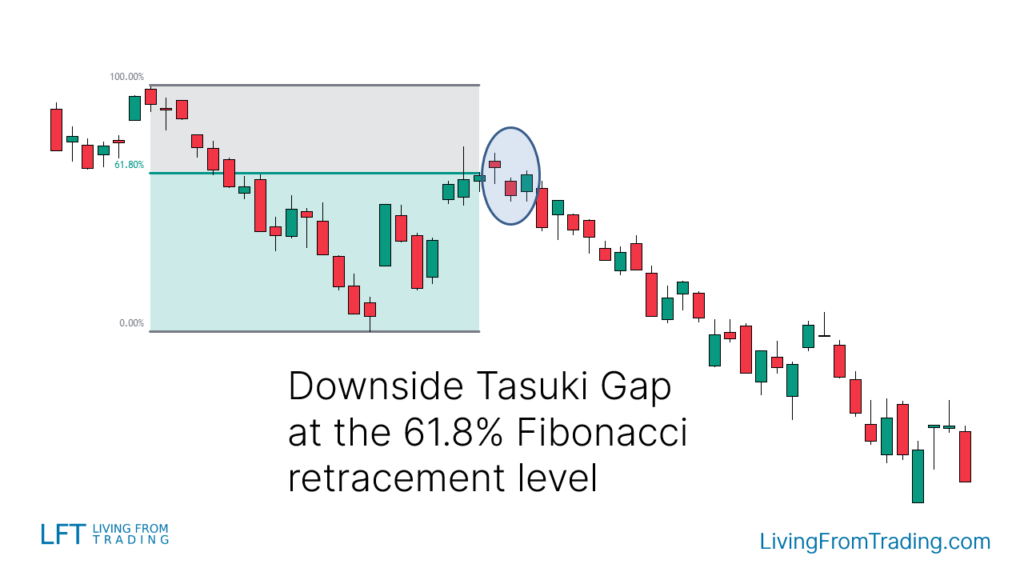
5. 结合斐波那契回撤交易
斐波那契回撤工具用于识别价格反转的潜在水平。当价格在回撤过程中遇到斐波那契水平并形成“Rising Window”图形时,可以进行卖空交易。
具体步骤:
- 绘制斐波那契回撤水平: 在价格的高点和低点之间绘制斐波那契回撤水平。
- 等待价格触及斐波那契水平: 在下跌趋势中,等待价格回升并触及斐波那契回撤水平。
- 观察“Rising Window”图形: 当价格触及斐波那契水平时,观察是否形成“Rising Window”图形。
- 执行卖空: 在“Rising Window”图形形成后,当价格突破最后一根蜡烛的低点时进行卖空操作。
- 止损和止盈设置: 将止损设置在图形的高点上方,止盈点可以设置在下一个支撑位附近。
假设市场在回撤过程中触及61.8%的斐波那契回撤水平,并形成了“Rising Window”图形。这时可以进行卖空交易,并根据市场情况设置止损和止盈点。
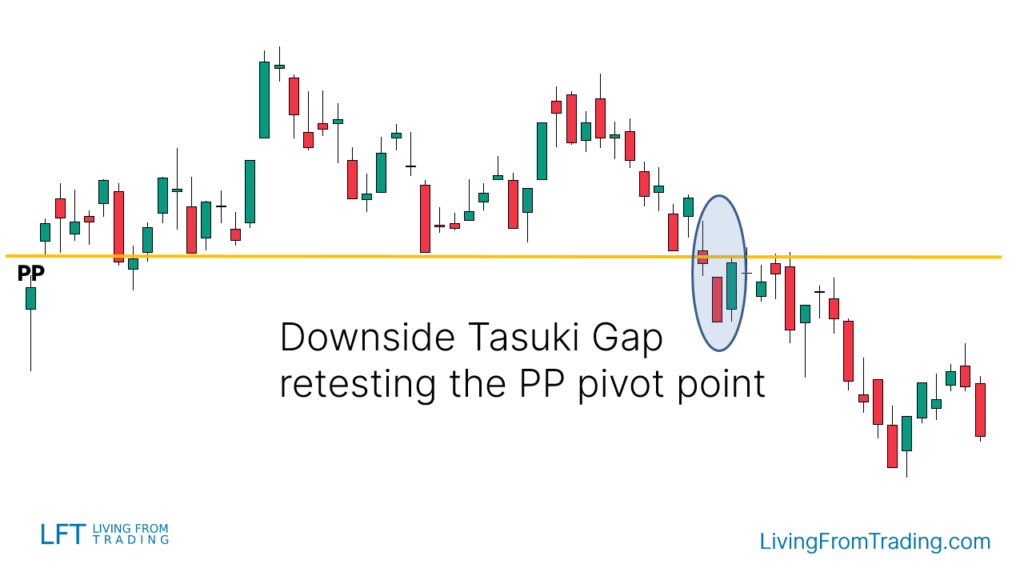
6. 结合枢轴点交易
枢轴点是通过数学公式计算出的支撑和阻力水平,用于日内交易和长期趋势分析。结合“Rising Window”图形和枢轴点可以提供额外的交易信号。
具体步骤:
- 设置枢轴点: 在图表上激活枢轴点指标,并标记支撑和阻力水平。
- 等待价格触及枢轴点: 观察价格是否触及枢轴点并突破。
- 观察“Rising Window”图形: 在价格接触或突破枢轴点时,观察是否出现“Rising Window”图形。
- 执行卖空: 在“Rising Window”图形形成后,当价格突破最后一根蜡烛的低点时进行卖空操作。
- 止损和止盈设置: 将止损设置在图形的高点上方,止盈点可以设置在下一个支撑位附近。
假设市场在下跌过程中触及日枢轴点,并且在突破后形成了“Rising Window”图形。这时可以进行卖空交易,并设置合理的止损和止盈点。
总结
“Rising Window” K线图形的成功率为54%,在预测市场趋势方面具有一定的有效性,但为了提高交易成功率,建议结合其他技术分析工具进行综合判断。
通过掌握以上信息,您可以更有效地识别和利用“Rising Window” K线图形进行交易。在实际操作中,结合市场环境和技术指标的综合分析,将有助于提高交易策略的准确性和成功率。
免责声明:本文观点来自原作者,不代表Hawk Insight的观点和立场。文章内容仅供参考、交流、学习,不构成投资建议。如涉及版权问题,请联系我们删除。