掌握RSI背离 : 交易者综合指南
RSI背离是指价格与指标之间的不一致。在本文你将学习如何发现这些背离以及使用的交易策略。
在金融市场中,技术分析是一种重要的分析工具,而相对强弱指数(RSI)背离作为其中的一种技术形态,受到了广泛的关注。RSI背离不仅可以帮助交易者识别潜在的市场反转,还能为交易决策提供有效的依据。
RSI背离的定义
RSI背离(Relative Strength Index Divergence)是指市场价格与RSI指标之间的走势不一致,表现为价格继续向一个方向移动,而RSI指标则朝相反方向运行。RSI背离通常被视为一种趋势反转的预警信号,能够提前提示投资者当前趋势的潜在变化。
RSI是一种振荡指标,用于衡量一定时间周期内价格涨跌的速度与变动幅度。它的数值介于0到100之间,一般而言,RSI高于70被认为是超买,低于30被认为是超卖。然而,当价格和RSI指标走势不一致时,即出现了背离,这往往预示着市场动能的转变。
RSI背离的类型
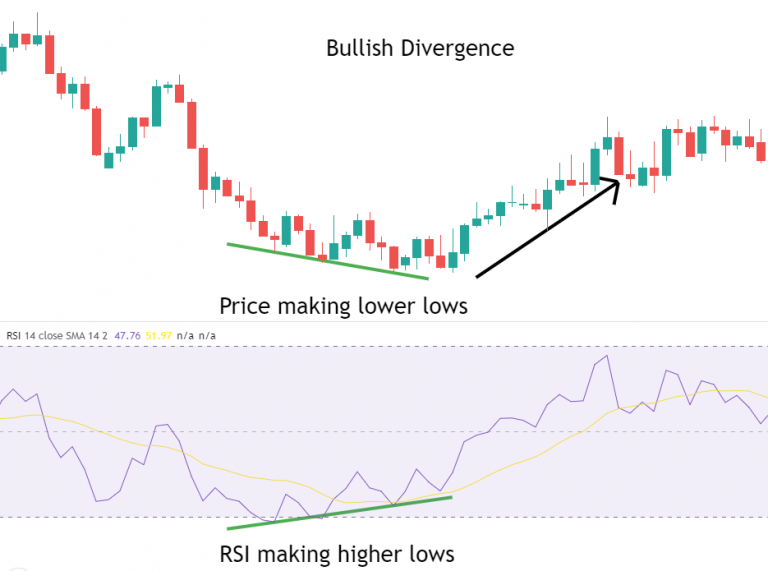
看涨RSI背离
看涨背离通常出现在下跌趋势的末期,表现为价格创出新的低点,而RSI指标却未随之创出更低的低点,反而形成了更高的低点。这个现象表明,尽管价格仍在下跌,但下跌的动能正在减弱,市场可能即将发生反转并开始上涨。
示例:假设某只股票的价格连续下跌,每次下跌都创出新低,但此时RSI指标却显示出更高的低点。这个背离现象意味着卖方力量正在减弱,投资者可以考虑在此时逐步建仓,以期价格反弹。
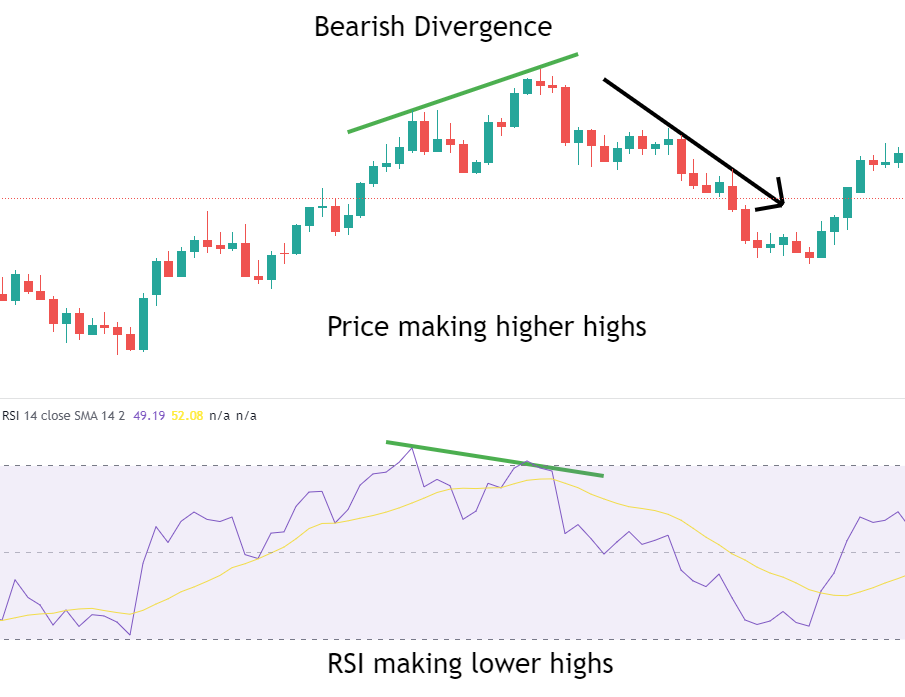
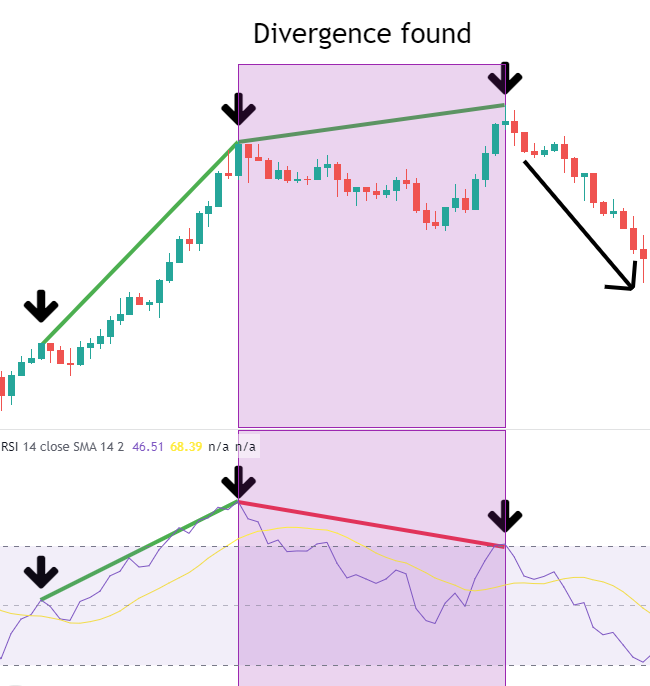
看跌RSI背离
看跌背离则出现在上涨趋势的末期,表现为价格创出新的高点,而RSI指标却未能同步创出更高的高点,反而形成了更低的高点。这表明,尽管价格仍在上涨,但上涨的动能正在减弱,市场可能即将面临回调或反转。
示例:假设一家公司的股价持续上涨,创出多个新的高点,但RSI指标显示出更低的高点。这种看跌背离现象预示着买方力量正在减弱,投资者应当警惕市场可能出现的回调或下跌,适时调整仓位或进行获利了结。
RSI背离的市场意义
RSI背离是技术分析中的一个重要信号,它能够为交易者提供关于市场动能变化的关键信息。背离现象往往预示着当前趋势的结束和新趋势的开始,因此,它在判断市场反转时具有重要的参考价值。
-
趋势反转信号:RSI背离被视为一种提前的趋势反转信号。当市场出现看涨背离时,意味着下跌趋势可能即将结束,新的上涨趋势可能开始;反之,看跌背离则预示着上涨趋势可能即将结束,市场可能进入下跌阶段。
-
风险管理工具:对于持仓者而言,RSI背离可以作为风险管理的工具。当持有多头仓位时,若出现看跌背离,投资者可以考虑减仓或平仓以规避可能的下跌风险;当持有空头仓位时,若出现看涨背离,则应考虑提前获利了结以规避反弹风险。
-
交易决策辅助:RSI背离不仅适用于趋势交易者,也适用于短线交易者。在盘整市场中,背离信号可以帮助交易者识别突破方向,提供更有利的进出场点。
如何识别和交易RSI背离
在实际交易中,识别RSI背离并加以利用是一个技术性较强的过程,通常包括以下几个步骤:
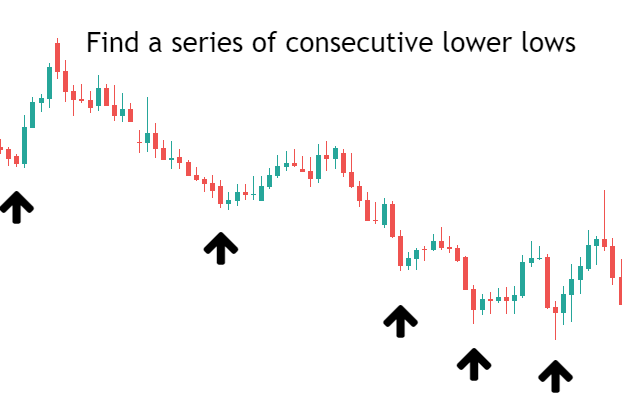
寻找看涨RSI背离的步骤
-
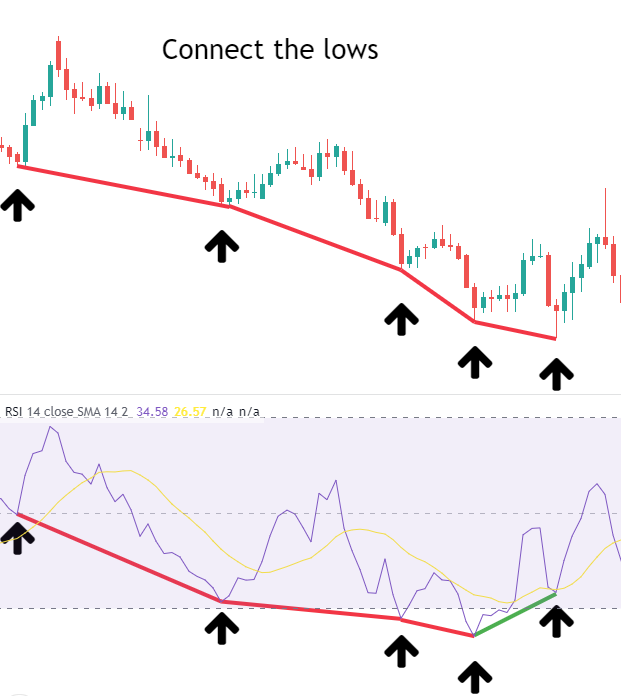
识别下降趋势:首先,观察市场是否处于下降趋势或是否形成了一系列连续的更低低点。即便市场处于横盘整理阶段,只要出现多个更低低点,也有可能形成看涨背离。
-
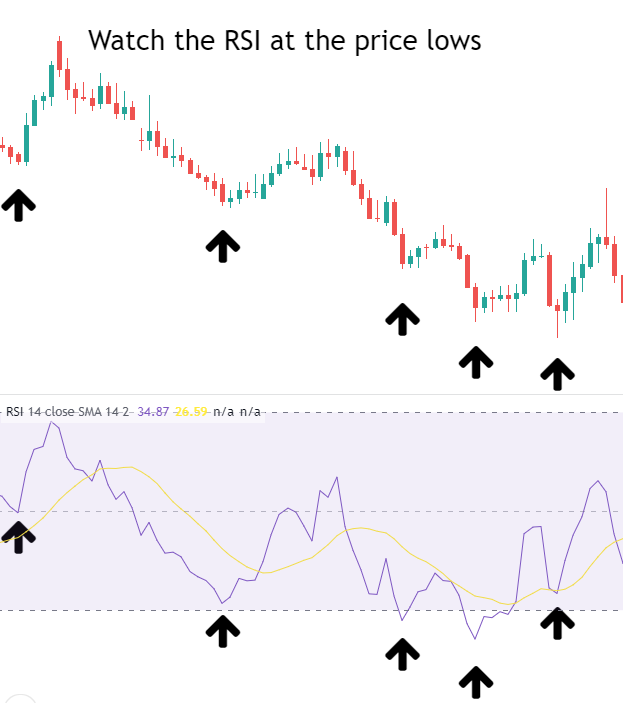
观察RSI指标:在价格低点形成的同时,检查RSI指标的走势,观察是否出现相应的更低低点。
-
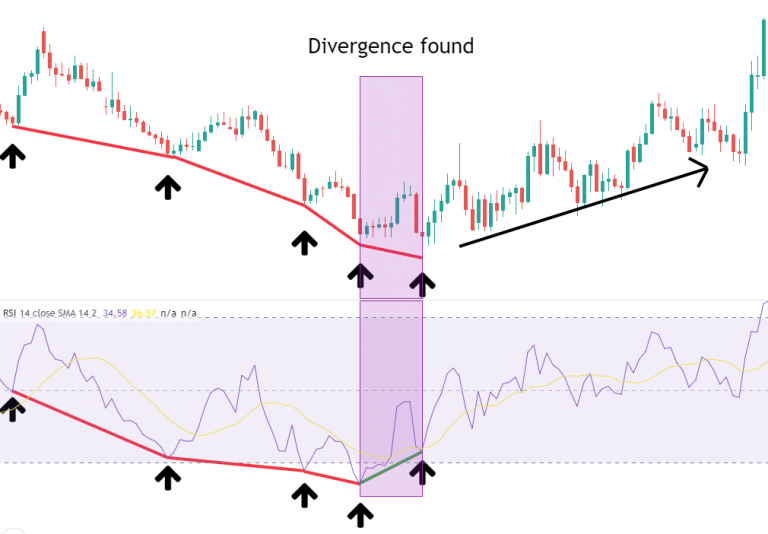
连接低点:用趋势线连接价格的低点和RSI指标的低点,如果价格低点趋势线向下,而RSI低点趋势线向上,则形成了看涨背离。
-
确认背离并交易:一旦确认背离形成,交易者可以选择平掉空头头寸或开始建立多头头寸。通常,价格在看涨背离出现后会开始反弹,这为交易者提供了入场机会。
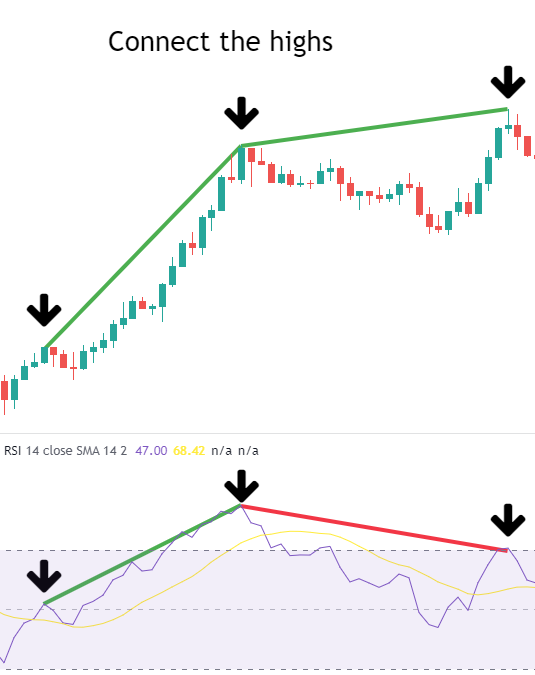
寻找看跌RSI背离的步骤
-
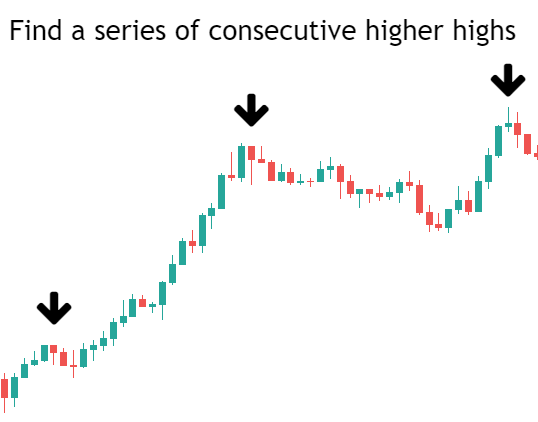
识别上升趋势:首先,确定市场处于上升趋势中,或识别一系列连续的更高高点。
-
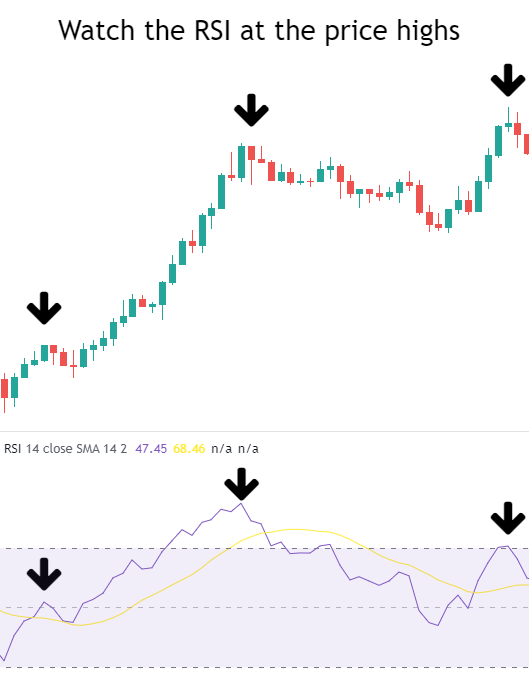
观察RSI指标:在价格高点形成的同时,观察RSI指标是否也形成相应的更高高点。
-
连接高点:用趋势线连接价格的高点和RSI指标的高点,如果价格高点趋势线向上,而RSI高点趋势线向下,则形成了看跌背离。
-
确认背离并交易:当看跌背离形成后,交易者应考虑减持或平仓多头头寸,并可在适当的信号确认后建立空头头寸,捕捉下跌行情。
RSI背离交易的触发策略
利用RSI背离进行交易时,可以结合其他技术指标和策略来增加胜率。以下是两种常见的触发策略:
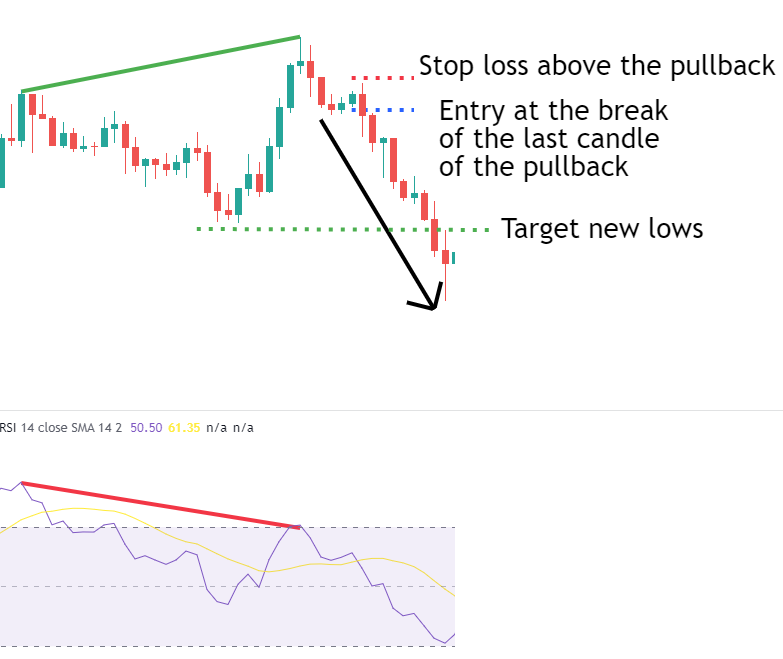
方法一:背离后的回调
当背离信号出现后,价格往往会出现一段回调。这时,交易者可以等待回调结束并确认失败后入场交易。通常,价格在完成回调后会继续按照背离方向运行,这为交易者提供了较为安全的进场机会。
示例:在看跌背离出现后,价格短暂回调上涨未果,此时形成的看跌形态如针形线或吞没形态,可以作为做空信号,交易者可在此入场,目标为新的低点或另一个相反方向的背离信号出现。
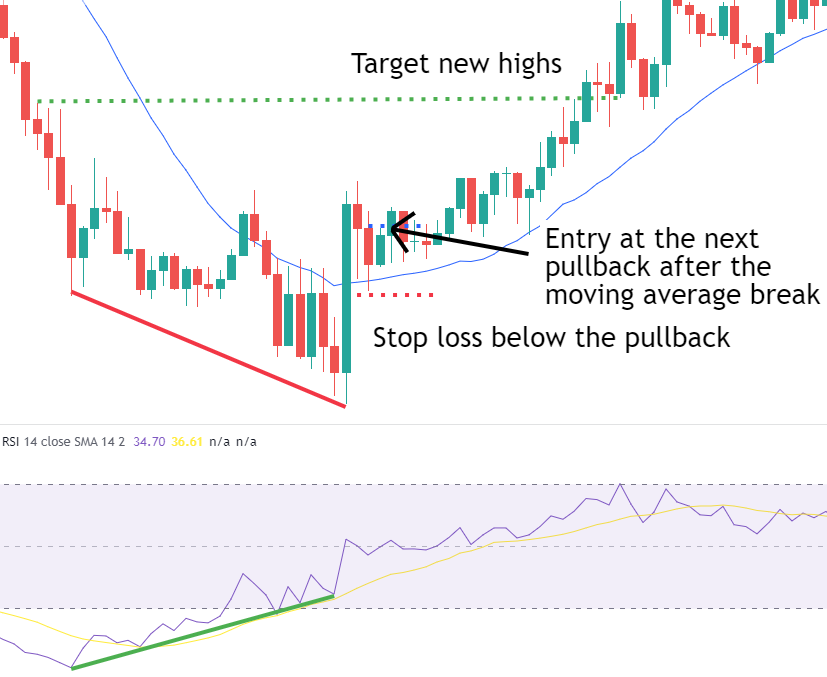
方法二:移动均线突破后的回调
这一策略通常适用于长期趋势的交易。当背离信号出现后,价格往往会突破短期或中期的移动均线。这时,交易者应等待价格回调至均线附近,并确认回调结束后入场。此策略可以有效过滤掉一些假信号,并提高交易的准确性。
示例:在看涨背离后,价格突破20日移动均线并回调至均线附近,此时交易者可以选择进场做多,目标为新的高点或另一个看跌背离信号。
免责声明:本文观点来自原作者,不代表Hawk Insight的观点和立场。文章内容仅供参考、交流、学习,不构成投资建议。如涉及版权问题,请联系我们删除。