Story (IP) Leaves Top AI Coins in the Dust with 189% Surge
IP rallies 189%, outshining AI crypto tokens. Indicators signal strong momentum, but resistance at $6 could shape its next move.
- IP skyrockets by 189% post-launch, making it the top-performing AI token in the past week.
- Bullish momentum is confirmed by MACD and Awesome Oscillator, which signals strong buying activity and trend continuation.
- Resistance at $6 poses a key hurdle; a breakout could push IP toward $9, while failure risks a drop to $4.36 or lower.

Story’s (IP) price has rallied by 189% a week after its launch, outperforming the top 10 artificial intelligence-based tokens.
The momentum shows no signs of slowing down. With a 50% gain in the past 24 hours, IP currently ranks as the crypto market’s top-performing asset. With a strengthening demand for the altcoin, IP is poised to extend its rally in the short term.
IP Bulls Dominate Market
The setup of the token’s Moving Average Convergence Divergence (MACD) indicator confirms this bullish outlook. As of this writing, IP’s MACD line (blue) is positioned above its signal line (orange).
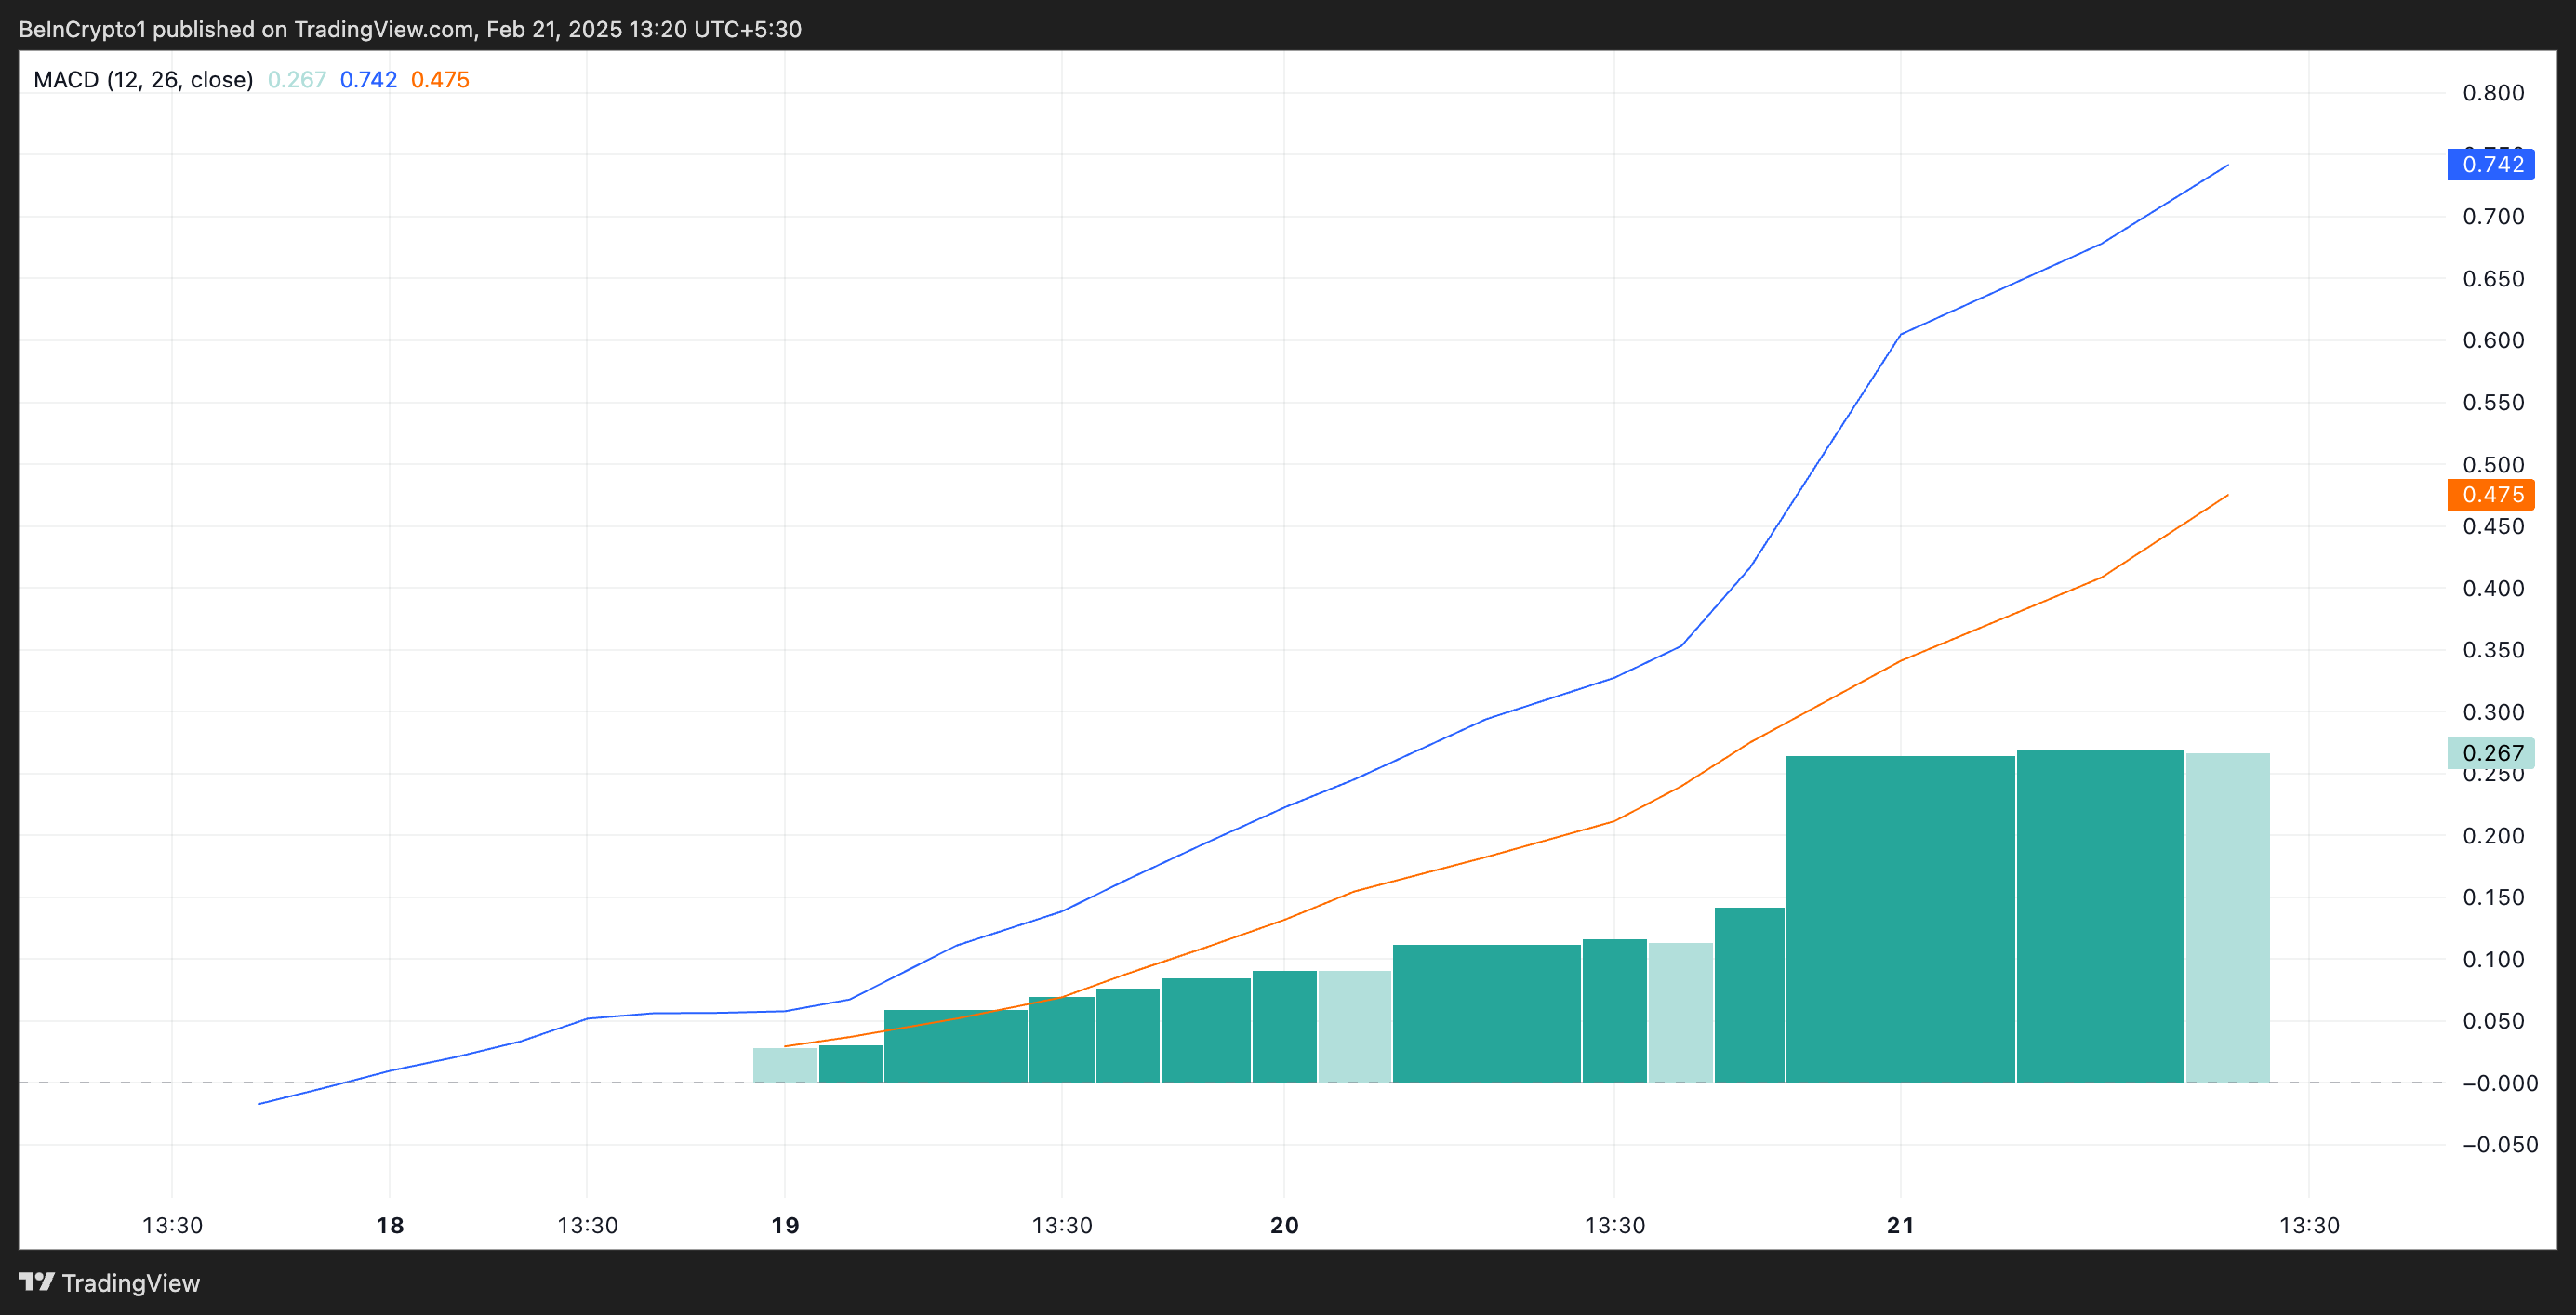
The MACD indicator identifies an asset’s price trends and potential reversal points. It comprises the MACD line, signal line, and histogram, measuring trend strength and momentum shifts based on crossovers and divergences.
As with IP, when an asset’s MACD line rests above its signal line, it indicates a bullish trend. It means buying activity exceeds selloffs among market participants, hinting at the possibility of an extended rally. Moreover, traders interpret this setup as a signal to exit short positions and take long ones.
Furthermore, readings from IP’s Awesome Oscillator (AO) confirm the significant bullish sentiment among its holders. Since IP’s launch, the indicator has posted only green, upward-facing histogram bars.
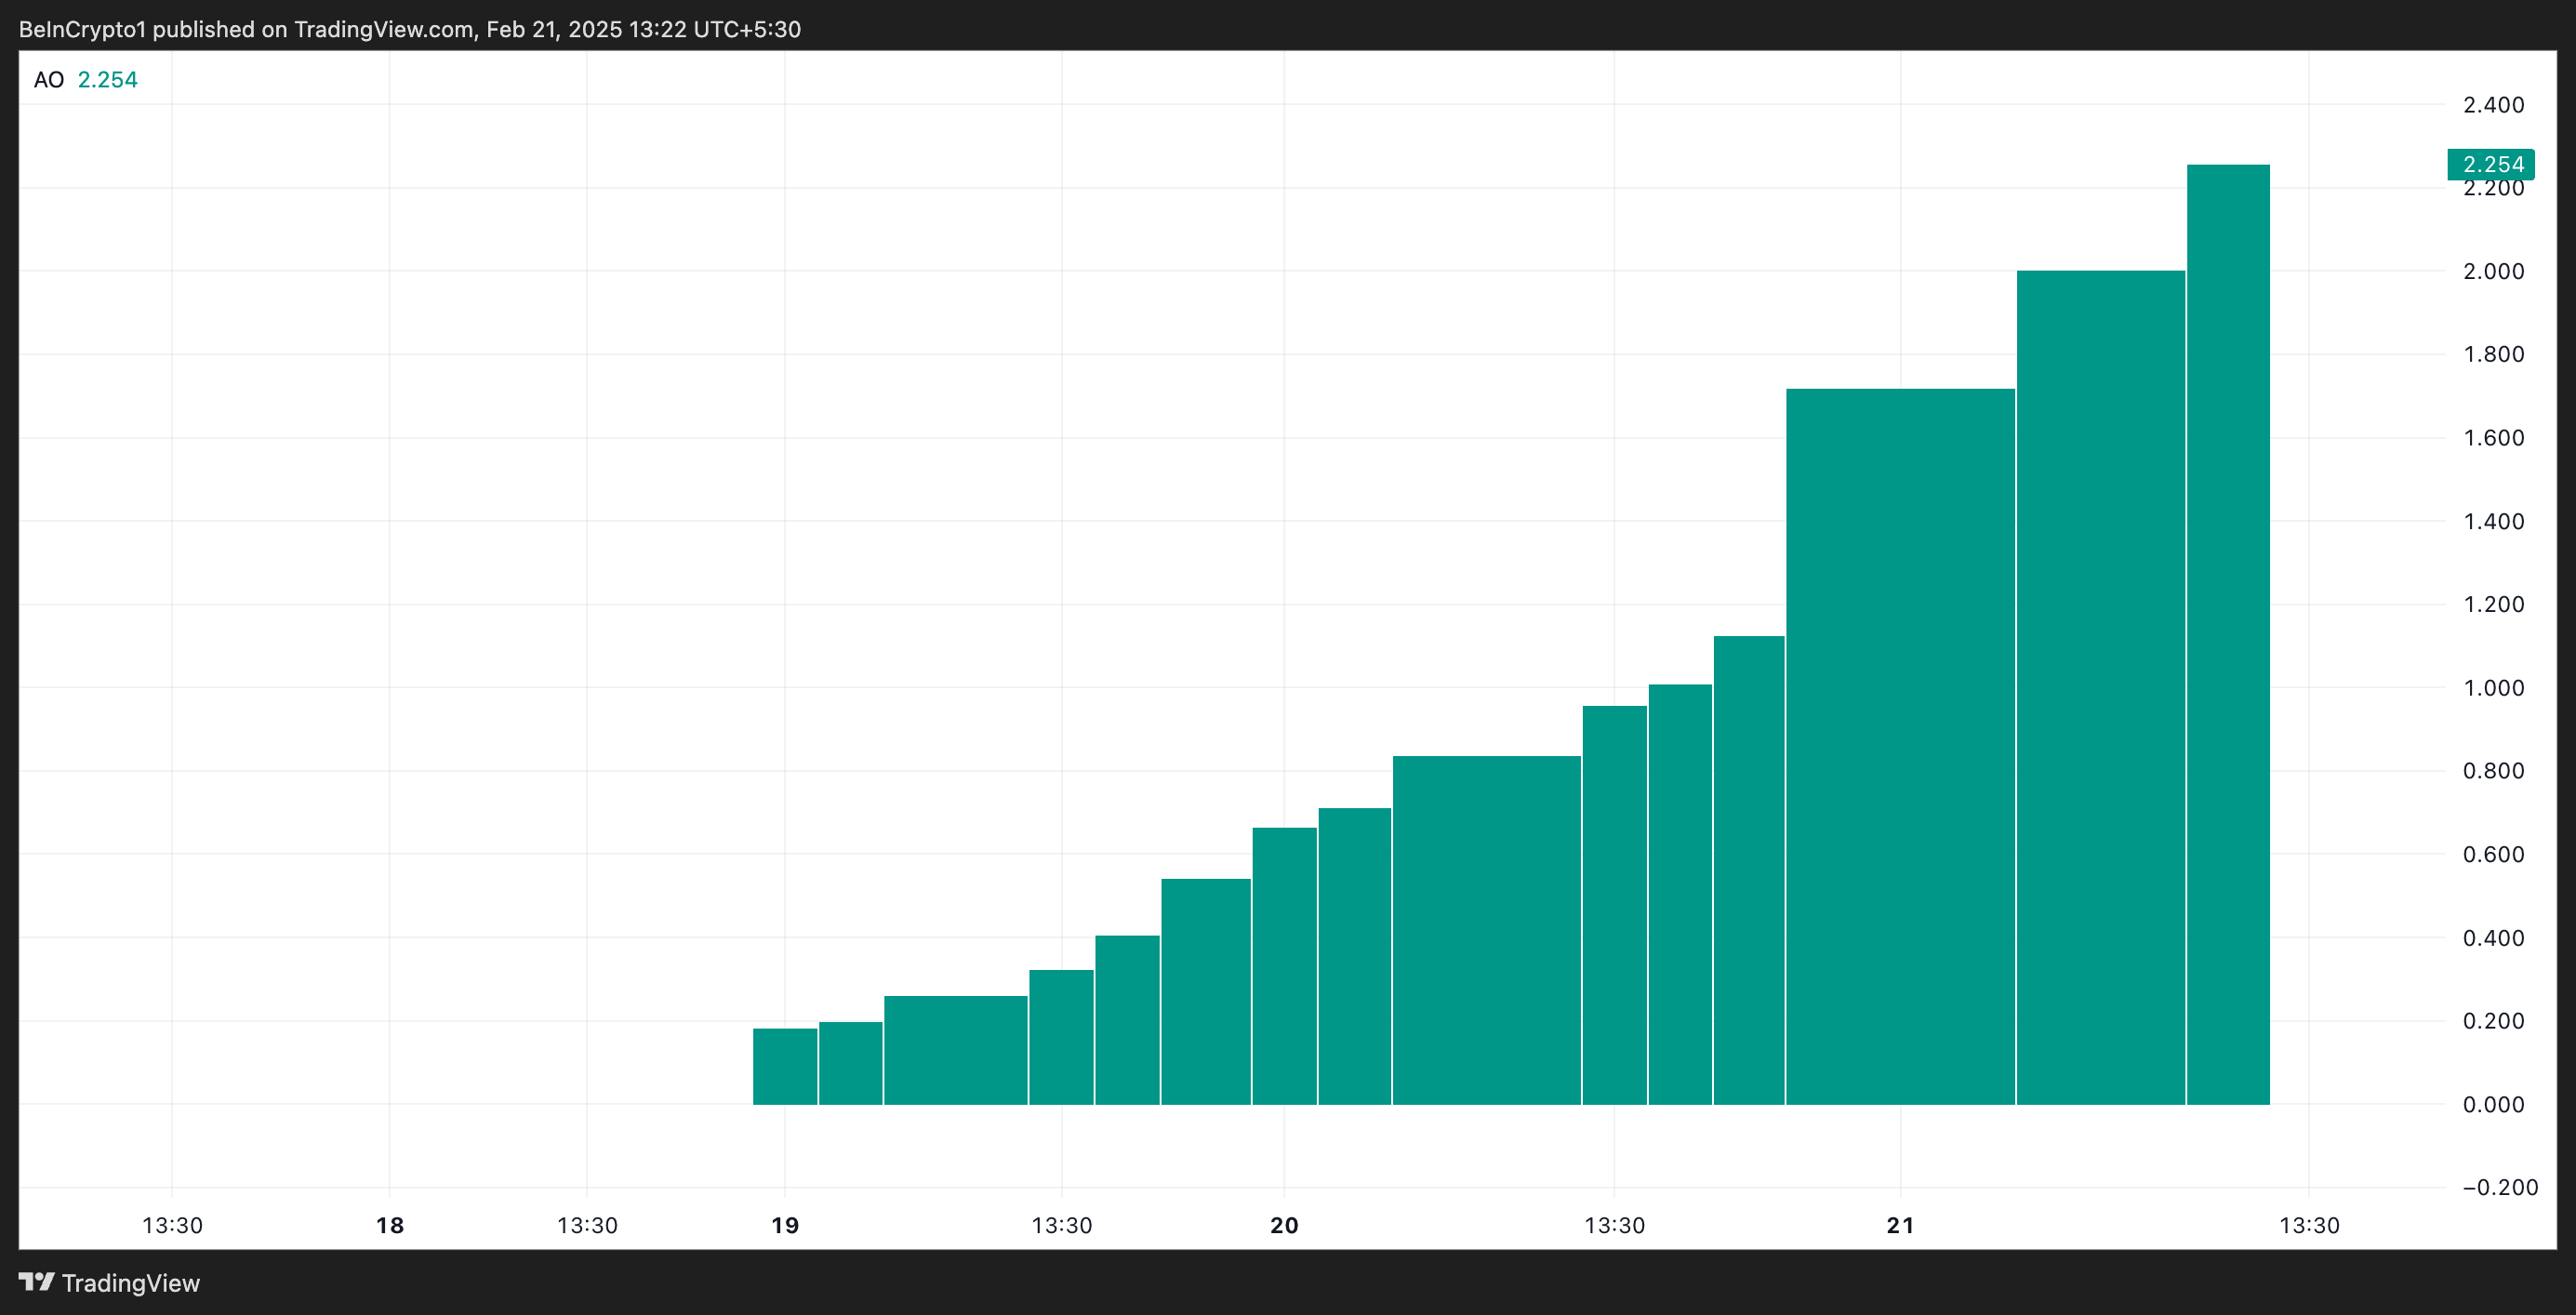
This momentum indicator also identifies an asset’s trend strength and potential reversals. When set up this way, it signals an increase in bullish momentum. It means that IP’s short-term trend is gaining strength relative to the longer-term trend, which hints at the potential continuation of its current uptrend.
IP Battles Resistance at $6—Will Bulls Prevail?
Sustained demand for IP could drive its price past the $6 resistance level. A successful breakout above this may propel it toward its all-time high of $9 and potentially beyond.
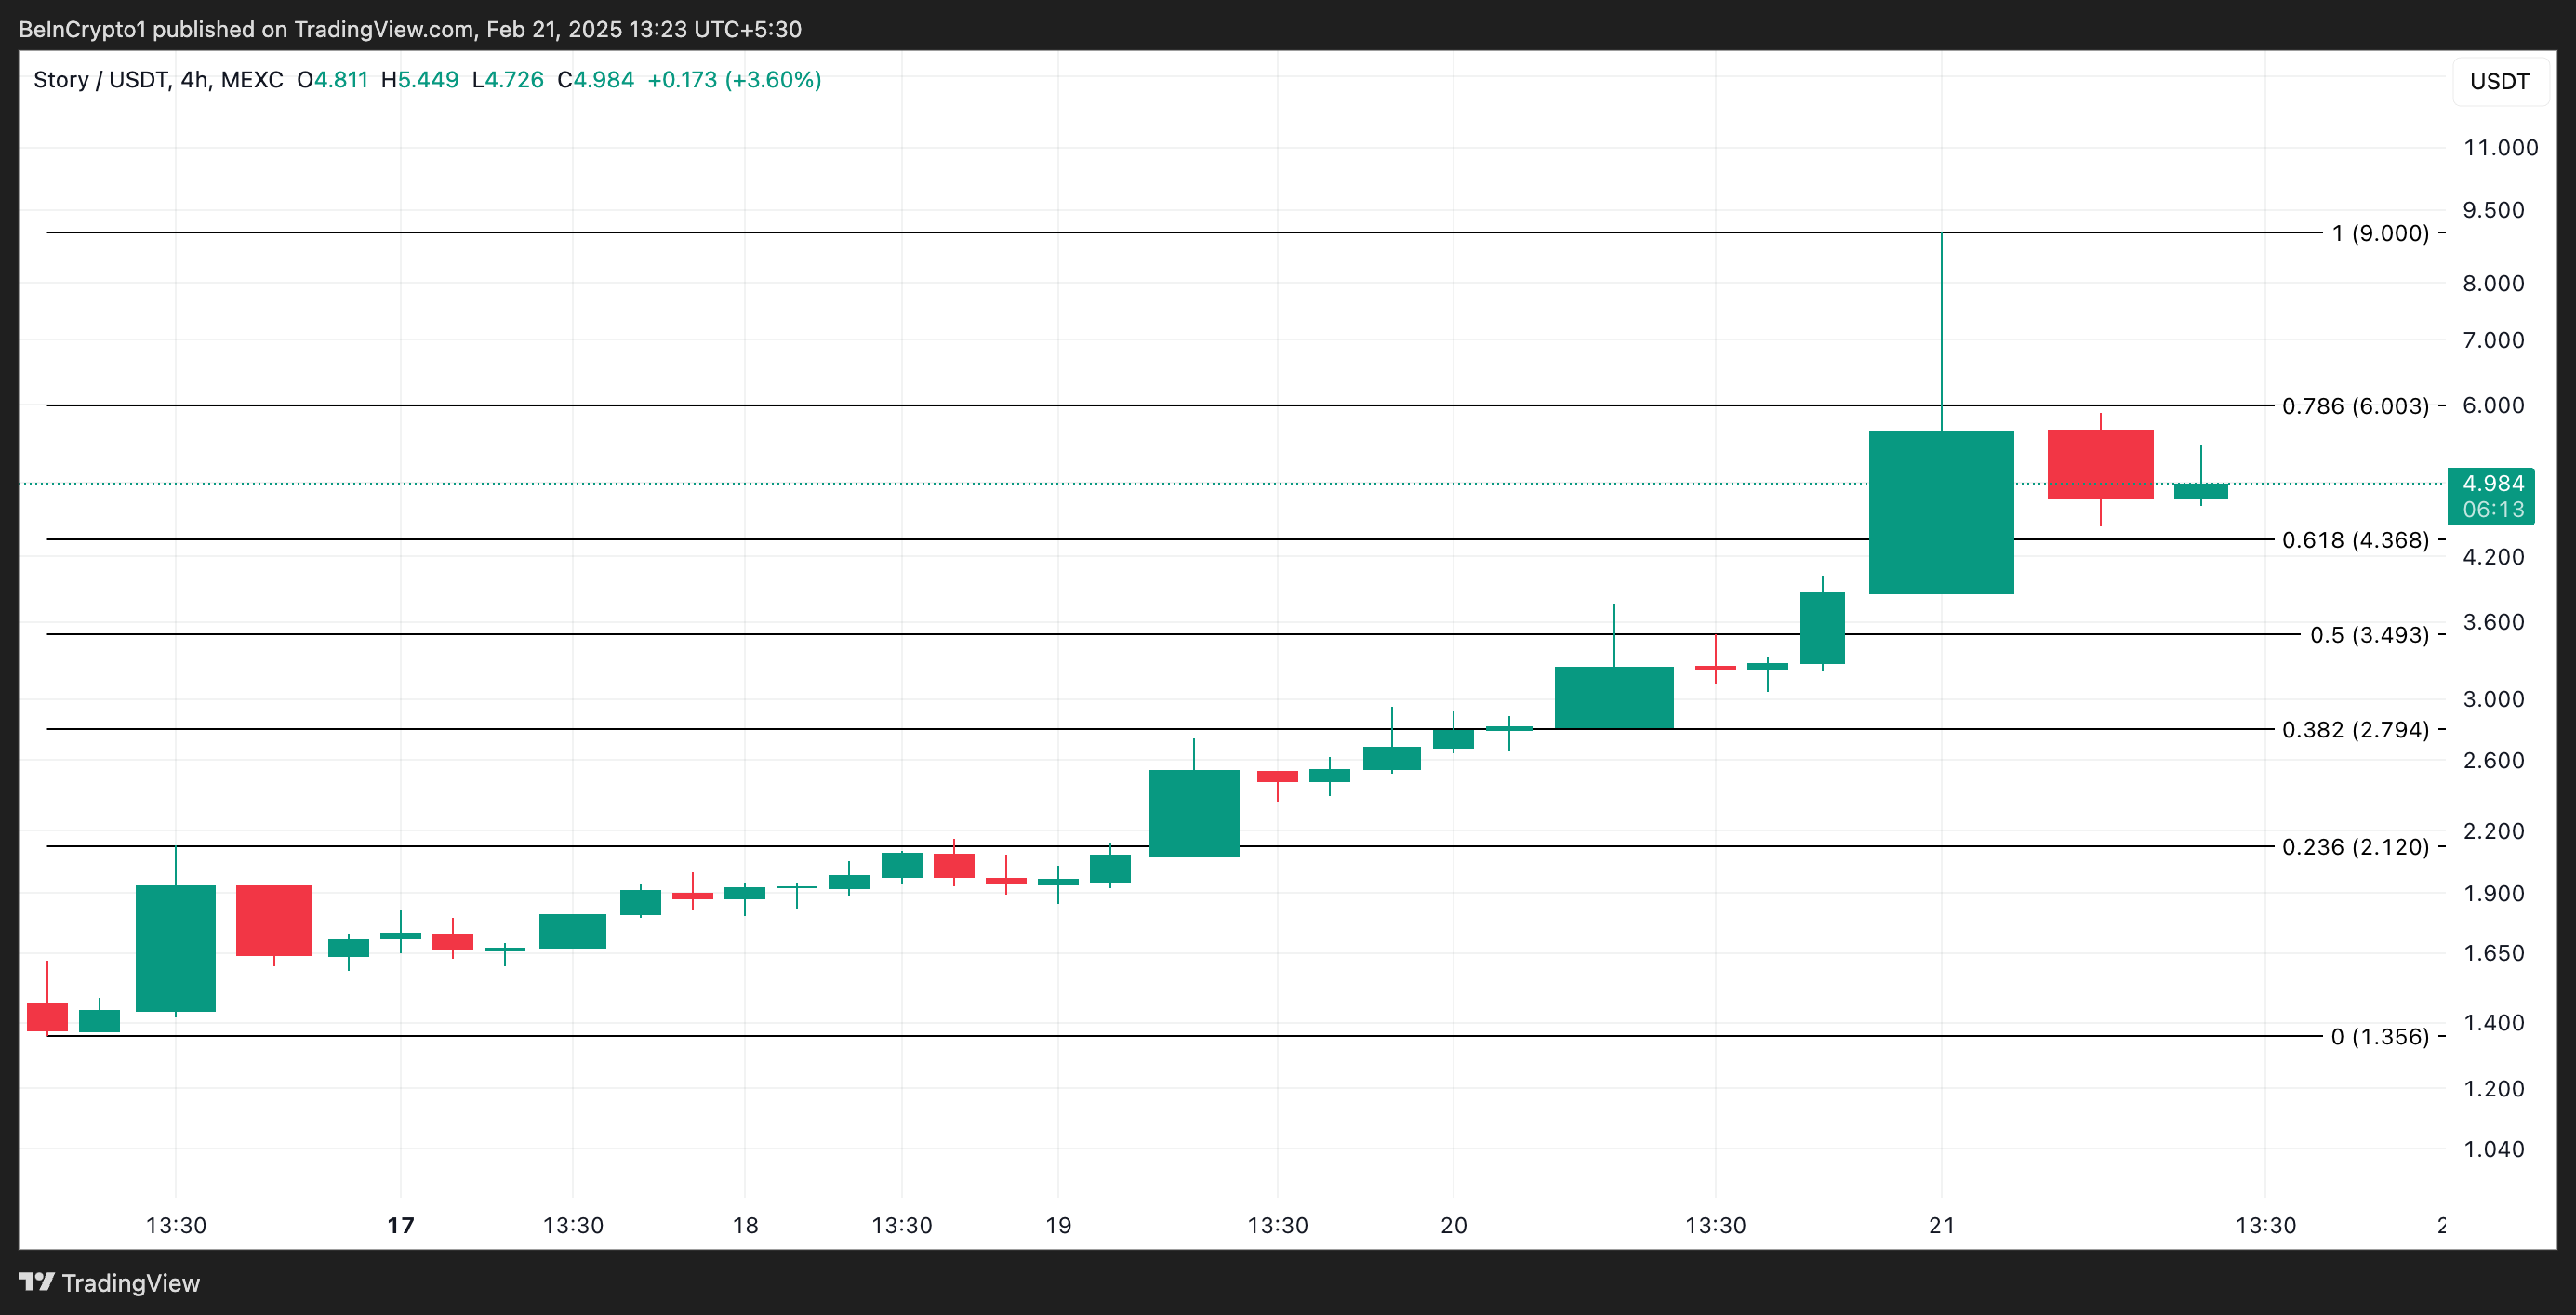
However, once profit-taking begins, IP risks shedding some of its gains. In that scenario, its price could drop to $4.36, and if the bulls fail to defend this support, it may plummet further to $3.49.
Disclaimer: The views in this article are from the original Creator and do not represent the views or position of Hawk Insight. The content of the article is for reference, communication and learning only, and does not constitute investment advice. If it involves copyright issues, please contact us for deletion.


