SafeMoon (SFM) Faces Post-Migration Challenges as Sellers Take Over
SFM value dips as selling pressure mounts post-migration. A break below key support could drive further declines unless demand rises.
- SafeMoon (SFM) jumped over 25% after moving from BNB Chain to Solana but now struggles with increased selling pressure.
- The negative Balance of Power (BoP) and an 8% price drop signal a potential bearish trend for SFM.
- A break below $0.000061 could lead to $0.000047, but renewed demand may push it above $0.000068.

SafeMoon’s price has climbed over 25% in the past week amid the broader market volatility. This double-digit price gain has been fueled by the uptick in the token’s demand following the project’s migration from BNB Chain to Solana.
However, profit-taking and increased selling pressure are now threatening to erase some of SFM’s recent gains. This analysis provides the details.
SafeMoon Battles Growing Sell-Offs
An assessment of the SFM/USD one-day chart highlights the growing selling pressure within SFM’s spot markets. A notable indicator of this trend is the token’s negative Balance of Power (BoP), which is at -0.96 at press time.
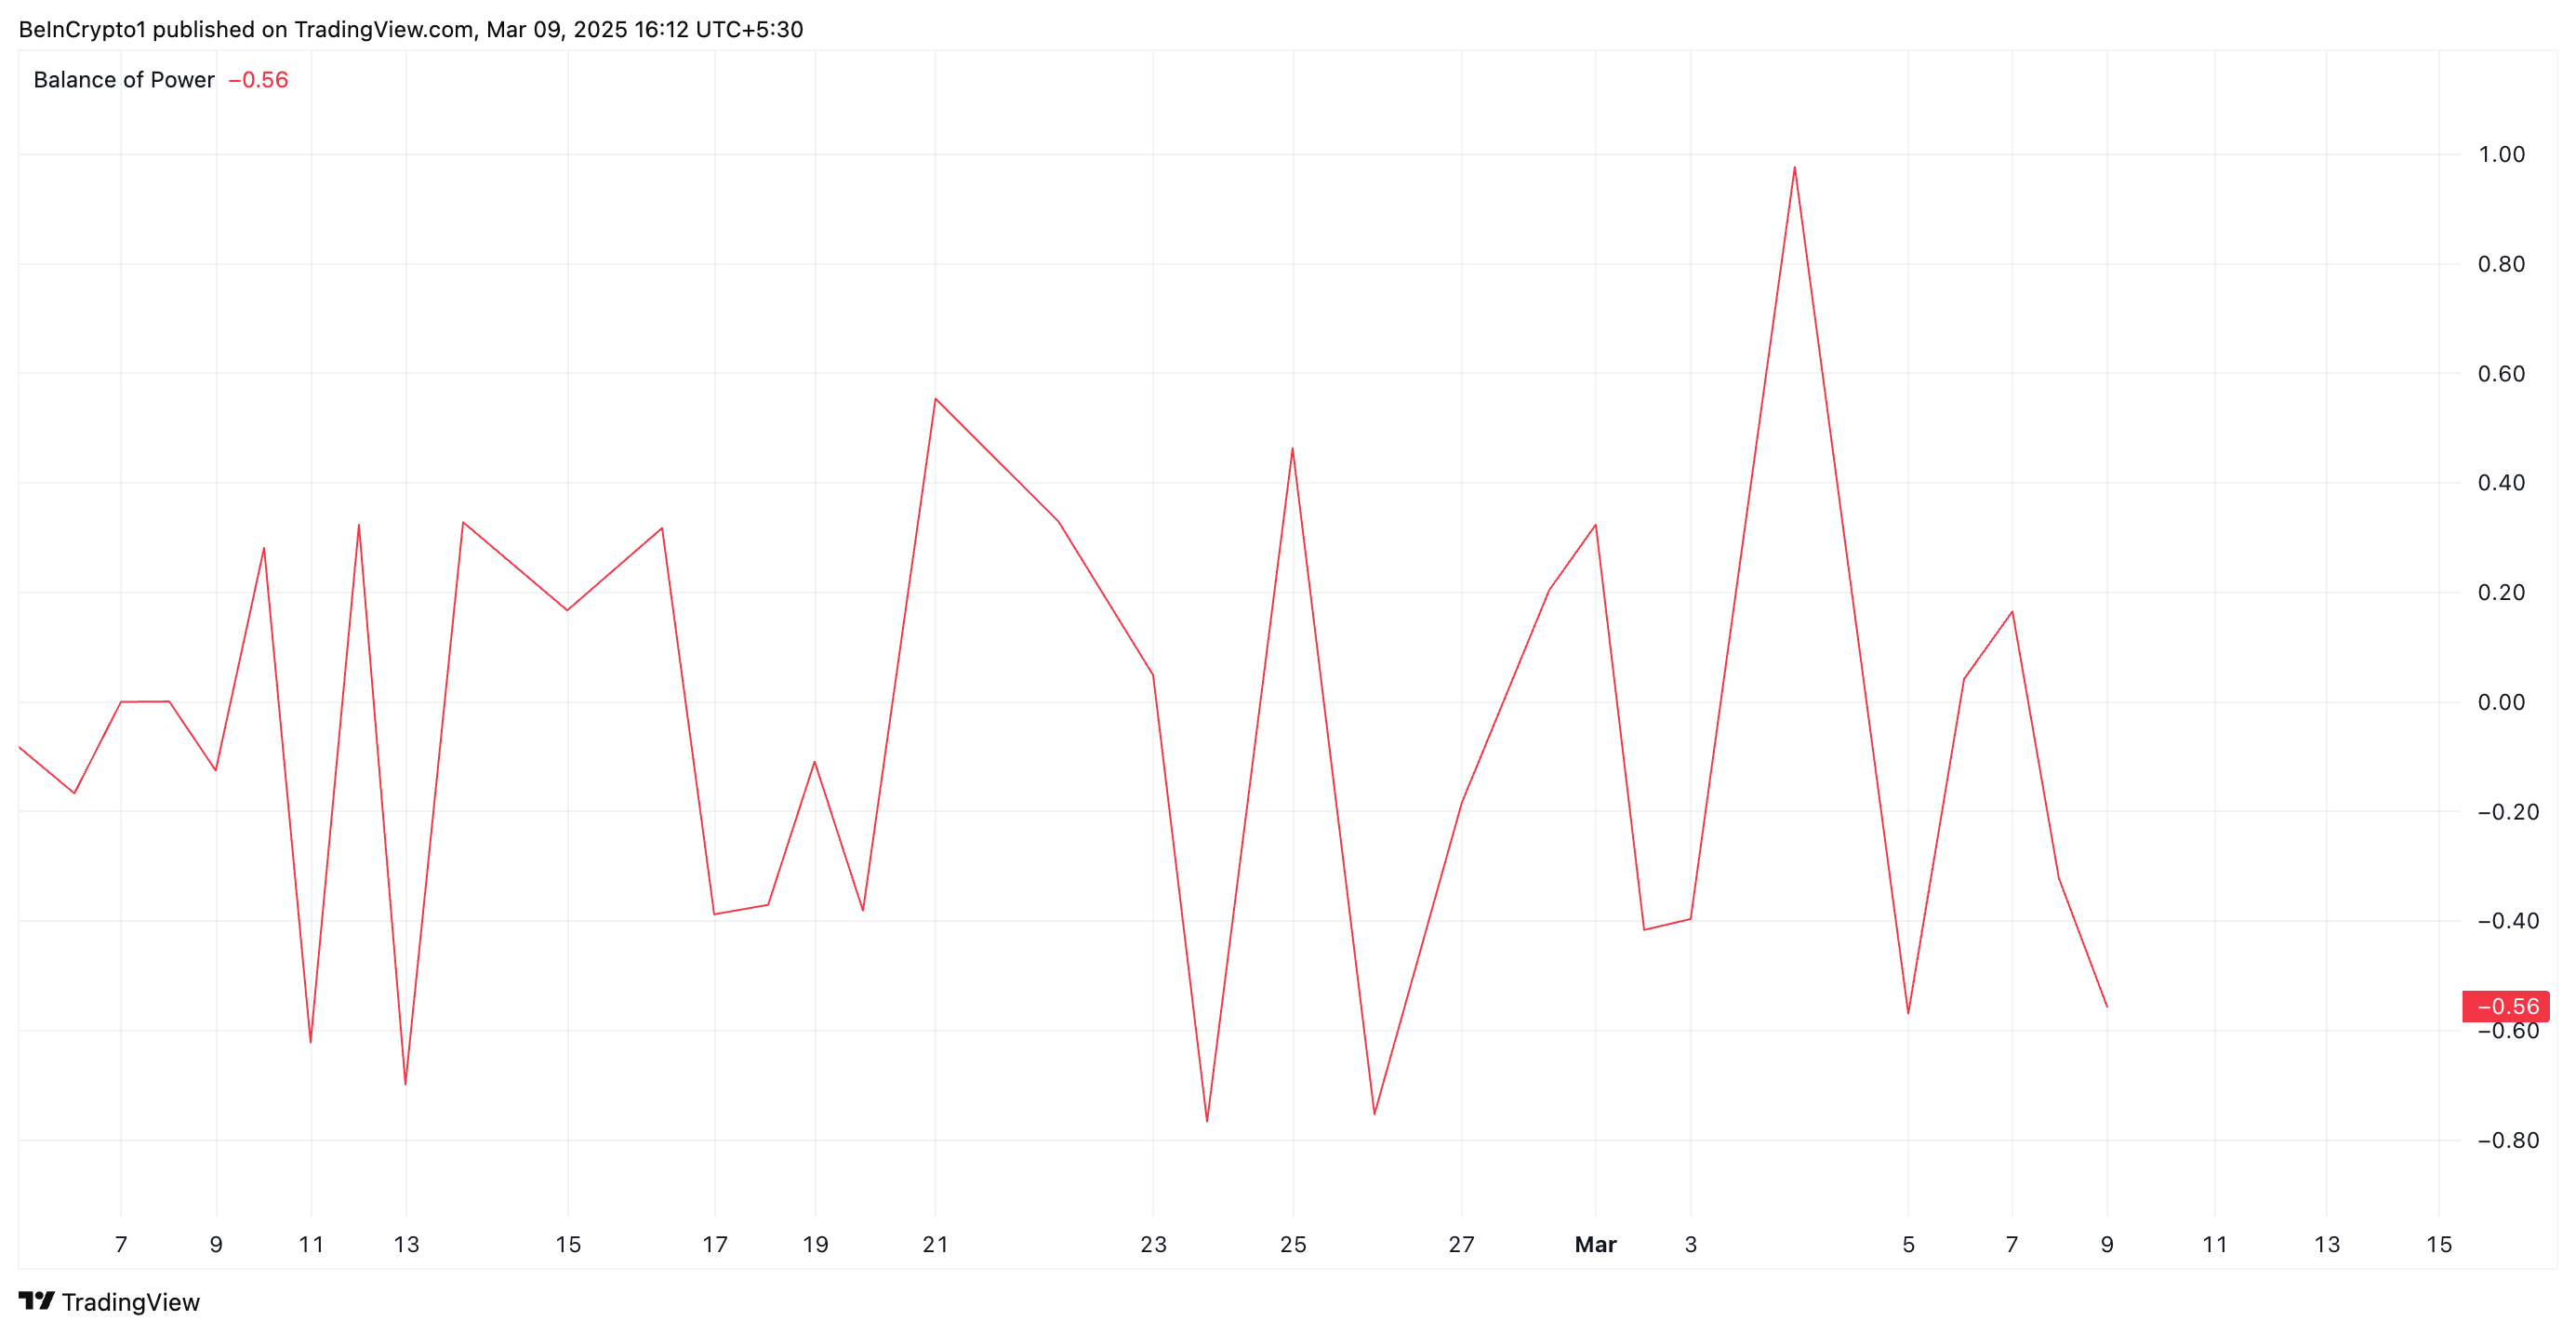
An asset’s BoP indicator compares buyers’ and sellers’ strengths by analyzing price movements within a given period. When its value is negative like this, it indicates that sellers have more control, meaning downward pressure is stronger, and the asset is likely experiencing a bearish trend.
This suggests weakening bullish momentum among SFM holders and hints at declines if selling pressure continues.
Furthermore, SFM’s price has dropped 8% over the past 24 hours, causing the altcoin to trade near its 20-day exponential moving average (EMA).
This moving average measures an asset’s average price over the past 20 trading days, giving more weight to recent prices to identify short-term trends.
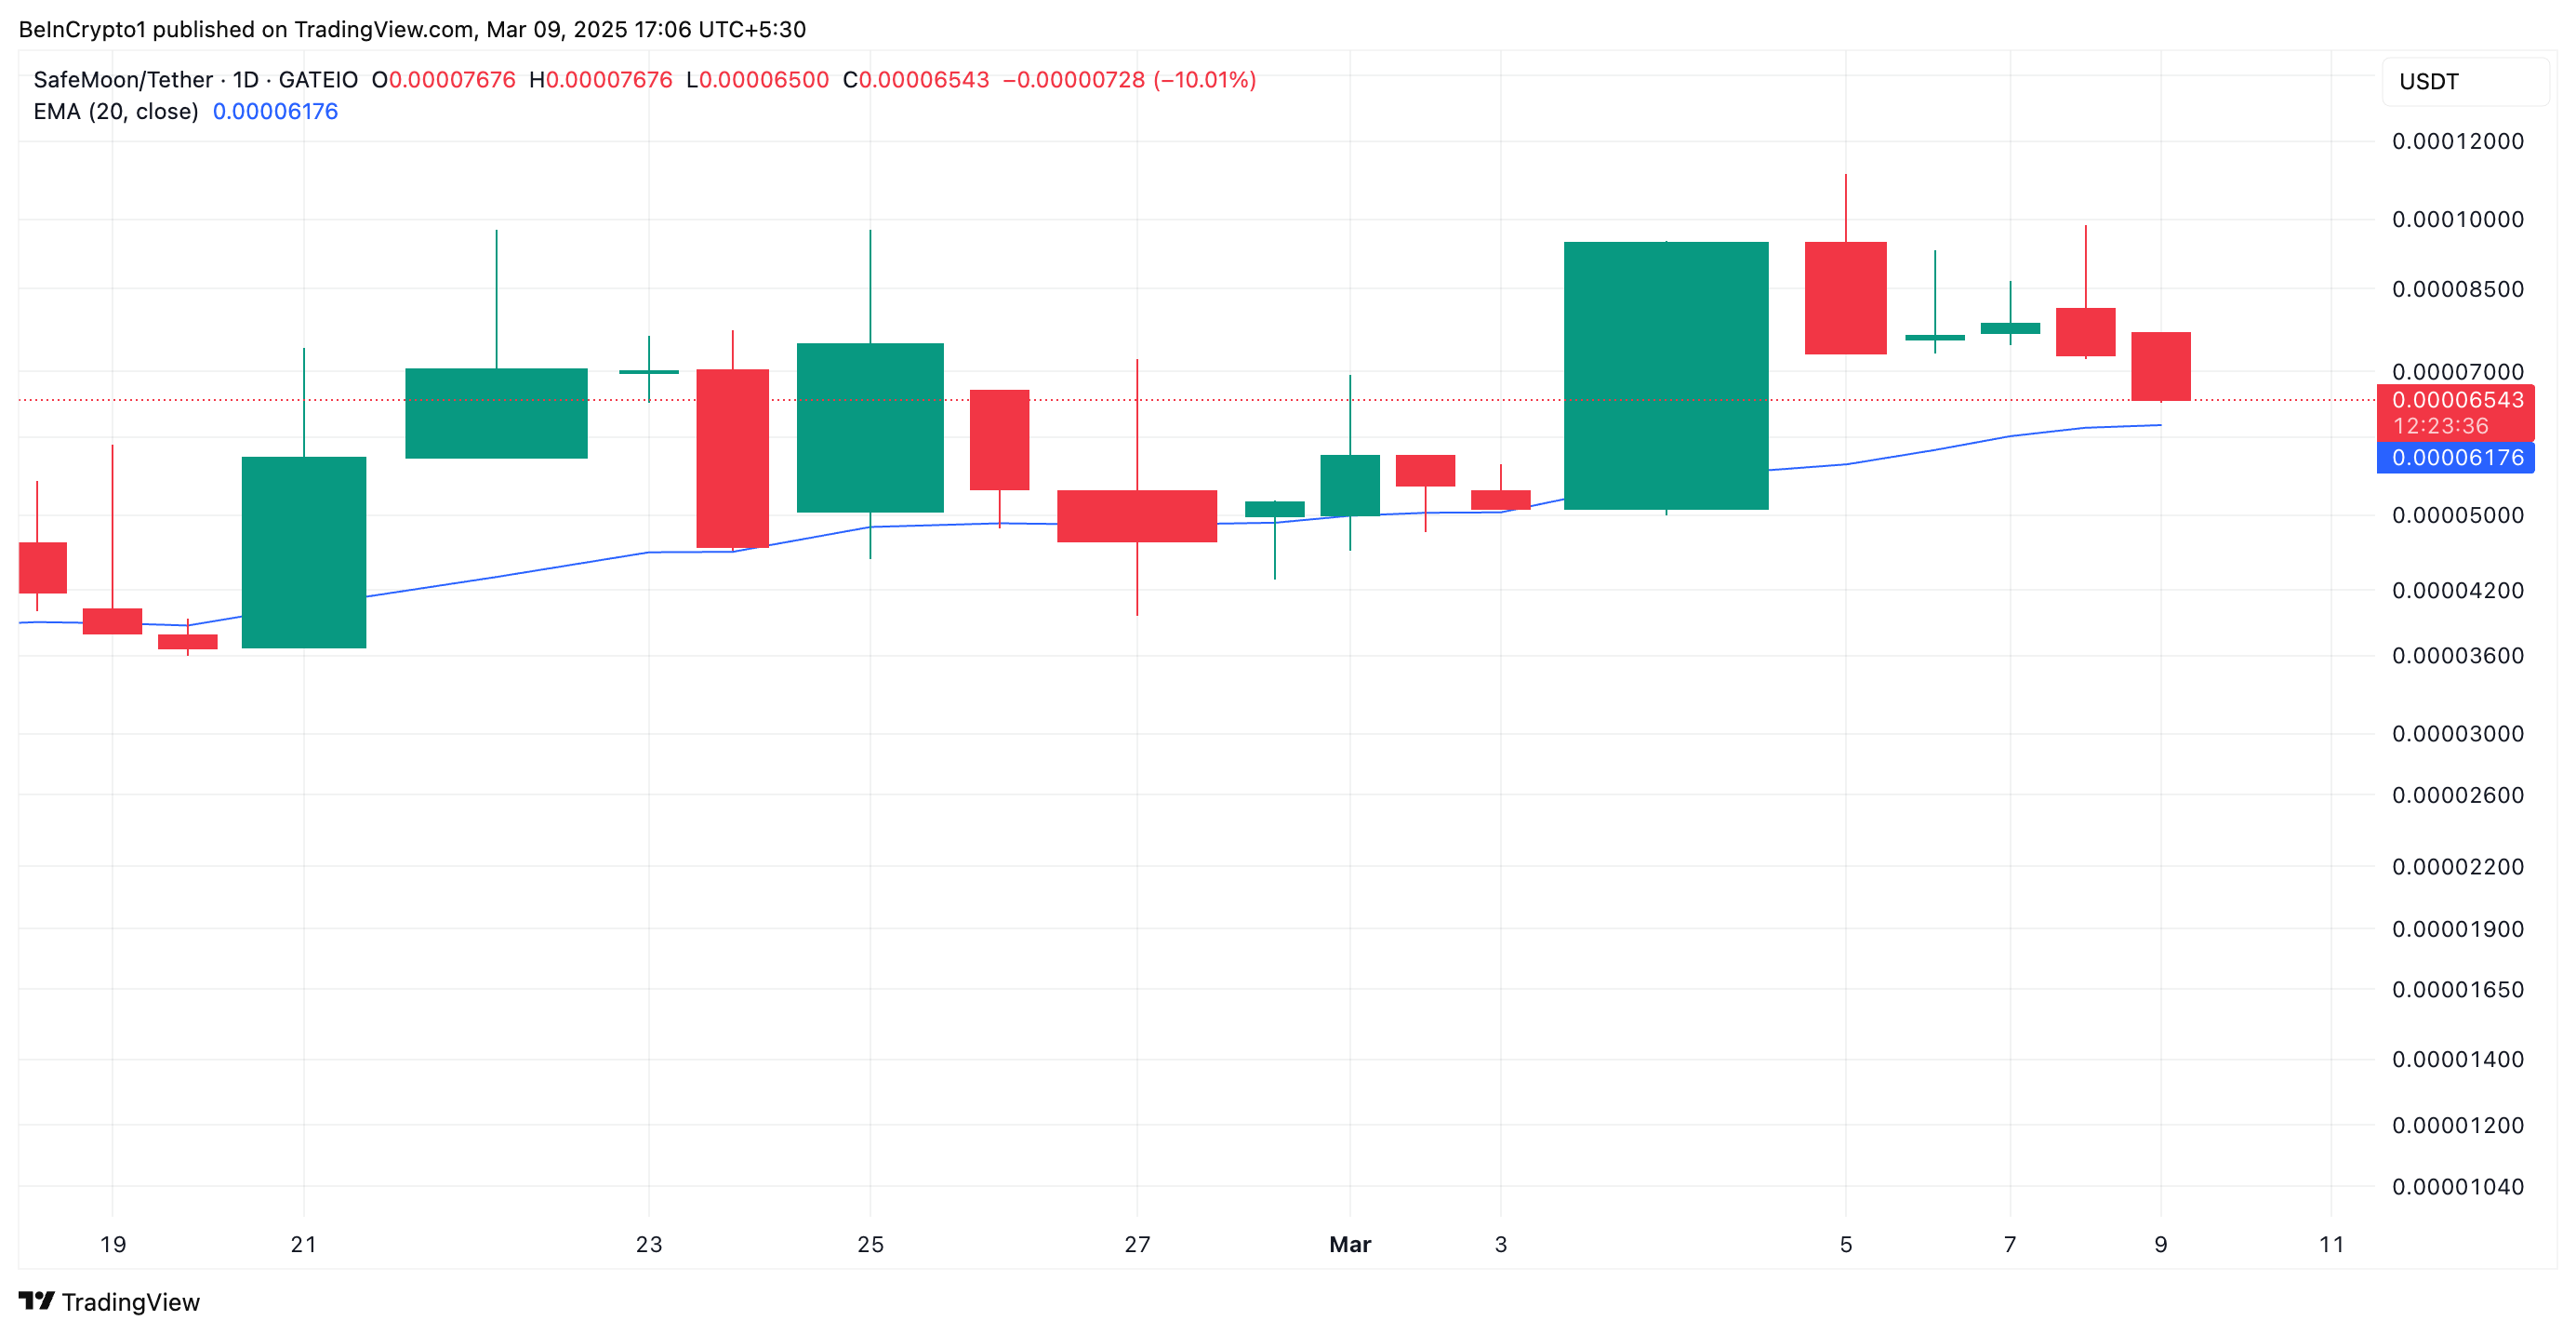
As with SFM, when an asset’s price is poised to break below the 20-day EMA, it signals increased selling pressure. It is a sign of weakening bullish momentum and a shift toward a bearish trend.
SFM Finds Key Support at $0.000061
A successful breach of the dynamic support offered by SafeMoon’s 20-day EMA at $0.000061 would strengthen the bearish trend. In this scenario, the altcoin’s price could plummet further to $0.000047.
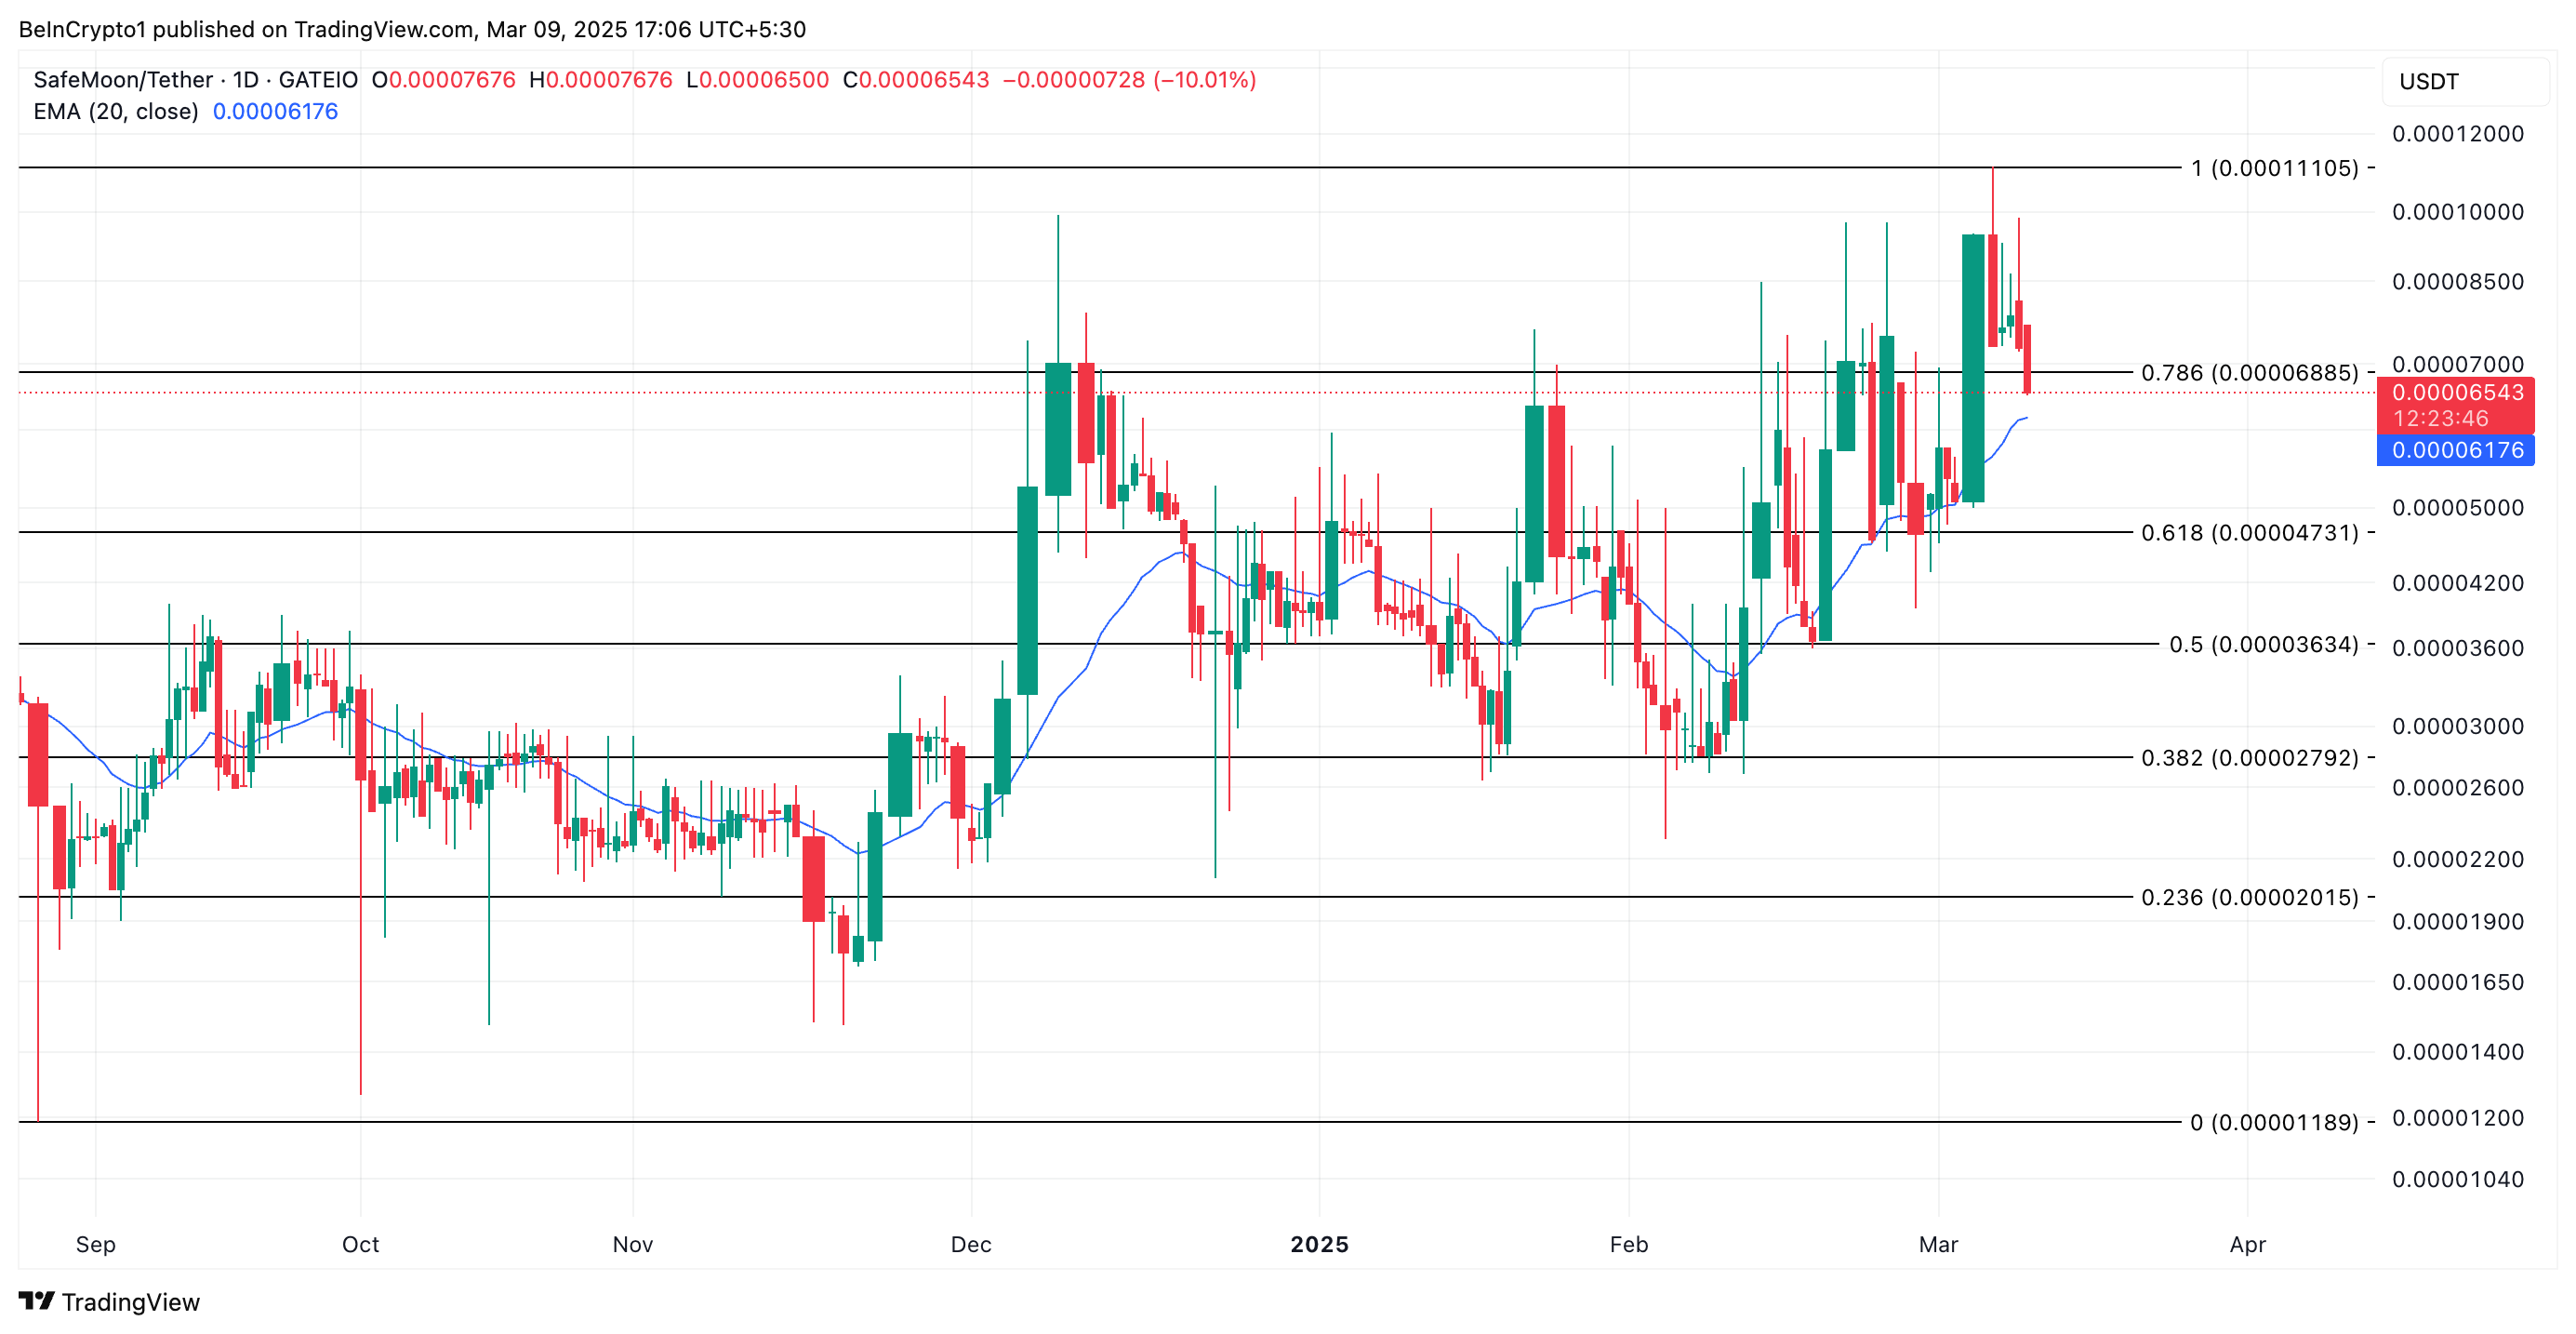
SFM Price Analysis. Source: TradingView
However, a spike in new demand would invalidate this bearish outlook. If spot inflows rally, it could drive SFM’s price above the resistance at $0.000068 toward its multi-year high at $0.000011.
Disclaimer: The views in this article are from the original Creator and do not represent the views or position of Hawk Insight. The content of the article is for reference, communication and learning only, and does not constitute investment advice. If it involves copyright issues, please contact us for deletion.


