41 Candlestick Patterns Explained With Examples
Learn about all the trading candlestick patterns that exist: bullish, bearish, reverse, continuation and determination with examples and explanation.
The Japanese candlestick chart patterns are popular for their simplicity and effectiveness in real trading. Below is a detailed introduction to various candlestick patterns, including identification methods, success rates, and practical application cases, to help investors make better trading decisions.
Bullish Reversal Candlestick Patterns
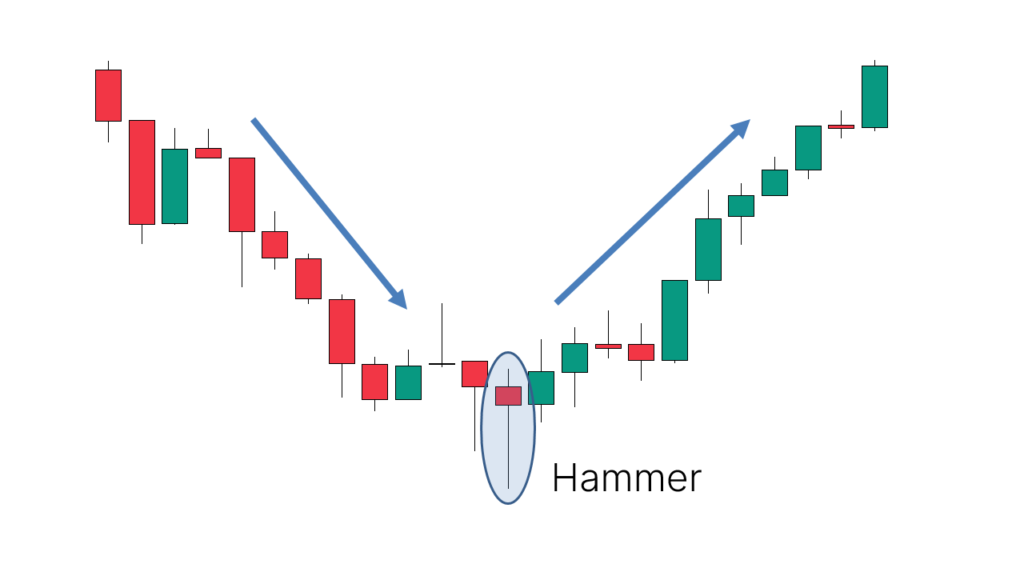
1.Hammer
- Identification: Single candlestick with a small body and a long lower shadow, no or very short upper shadow.
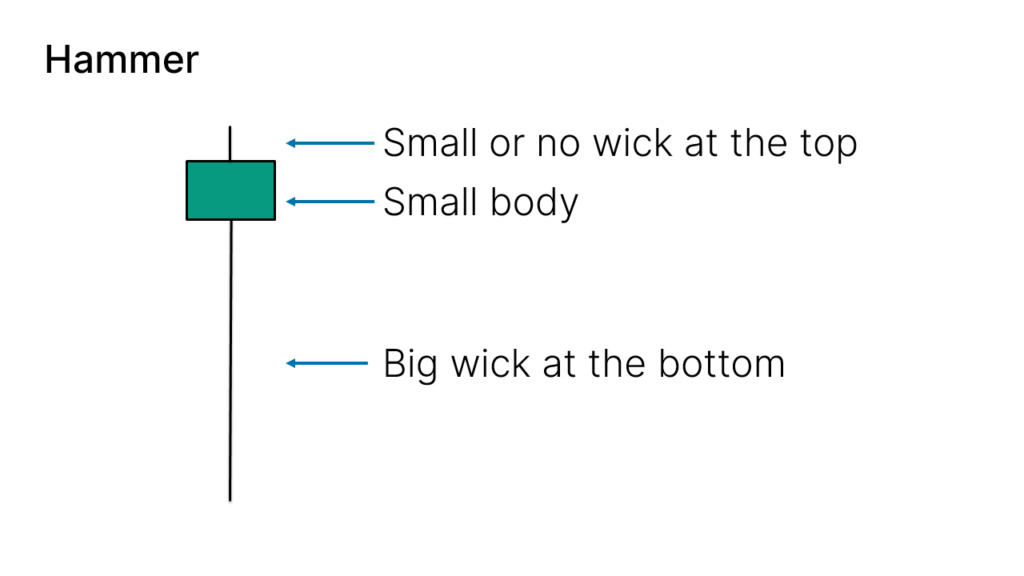
- Success Rate: 60%
- Application: Appears after a downtrend, signaling a potential reversal or the beginning of an uptrend.
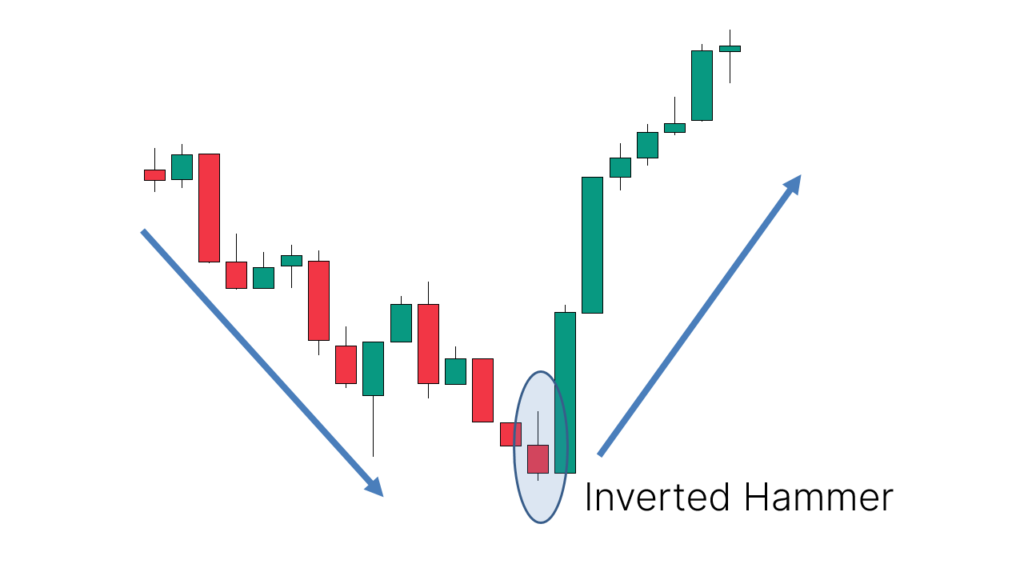
2.Inverted Hammer
- Identification: Single candlestick with a small body and a long upper shadow, no or very short lower shadow.
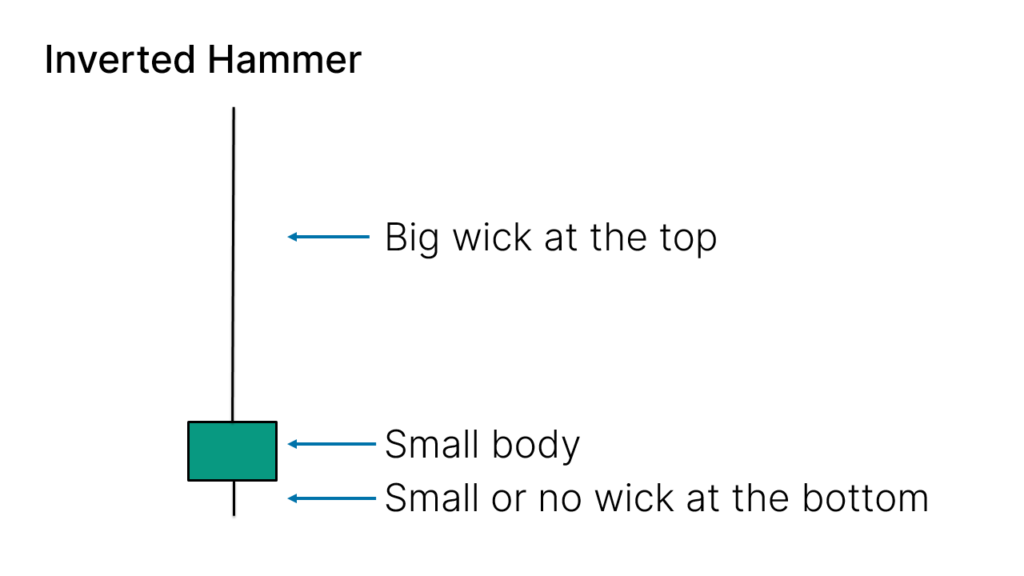
- Success Rate: 67%
- Application: Appears after a downtrend, indicating a possible upward reversal.
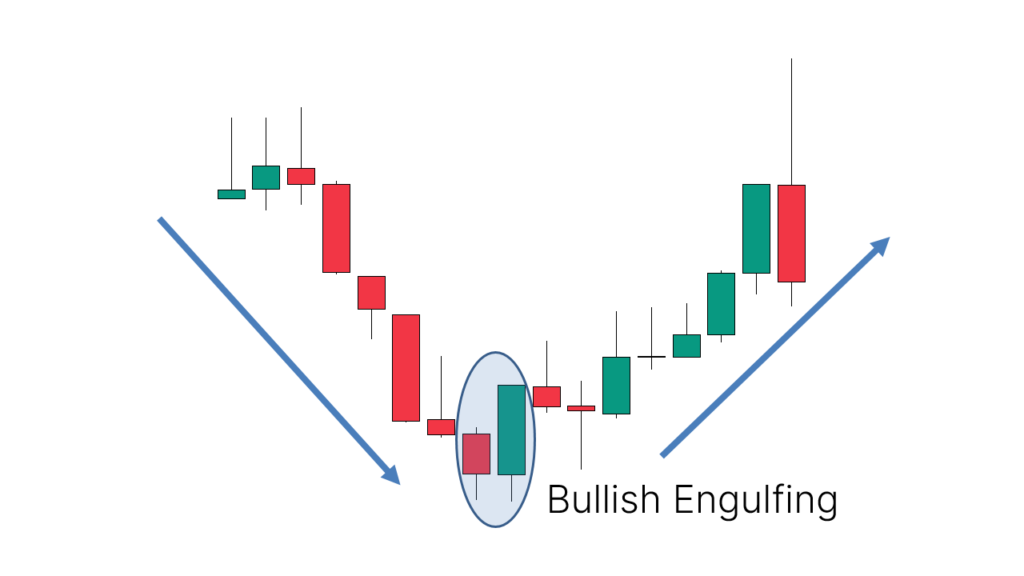
3.Bullish Engulfing
- Identification: Composed of two candlesticks, with the second candlestick's body completely engulfing the first candlestick's body.
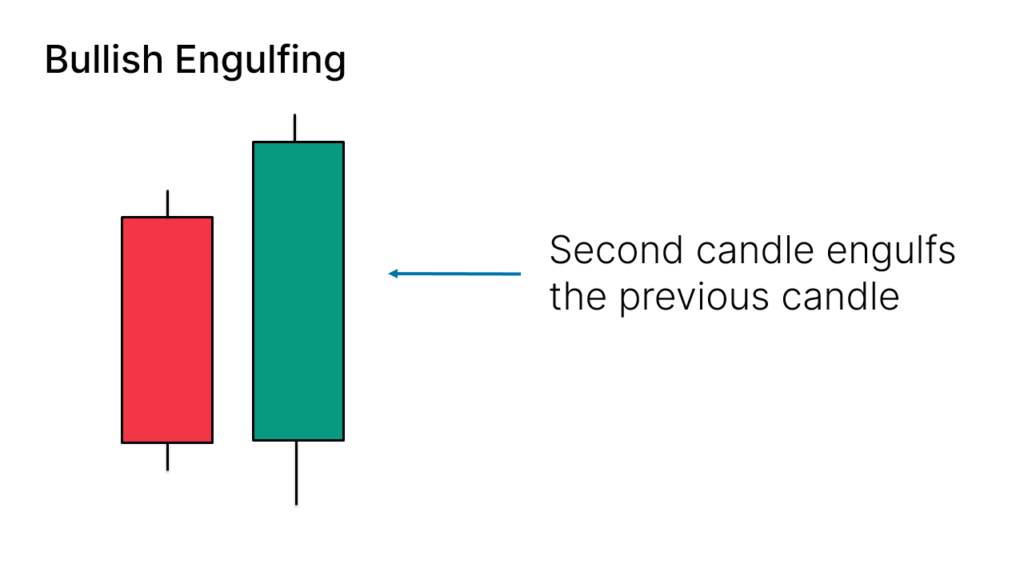
- Success Rate: 62%
- Application: Appears after a downtrend, suggesting a potential reversal or upward movement.
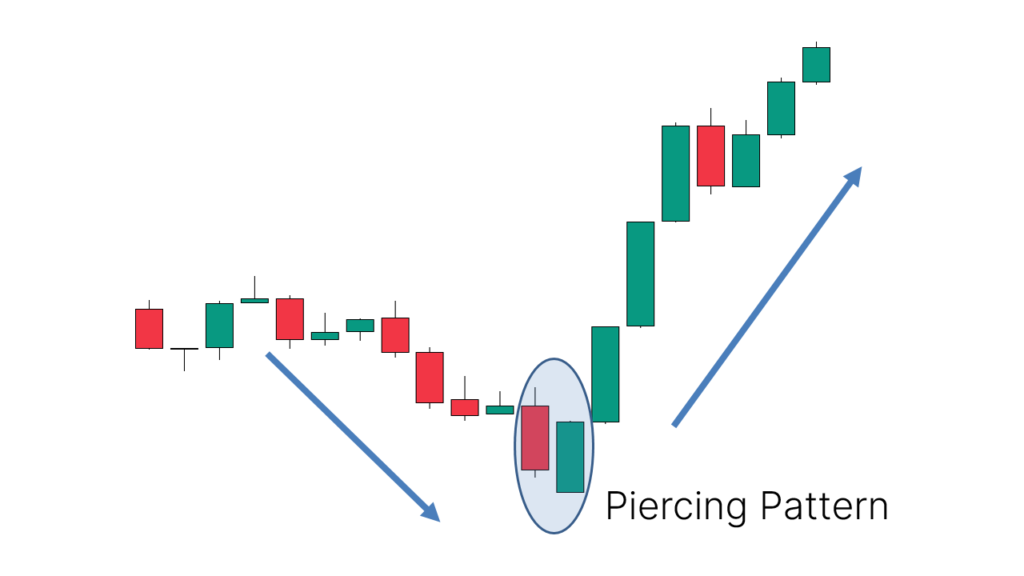
4.Piercing
- Identification: Composed of two candlesticks, with the second candlestick opening below the first candlestick's close but closing above the 50% mark of the first candlestick's body.
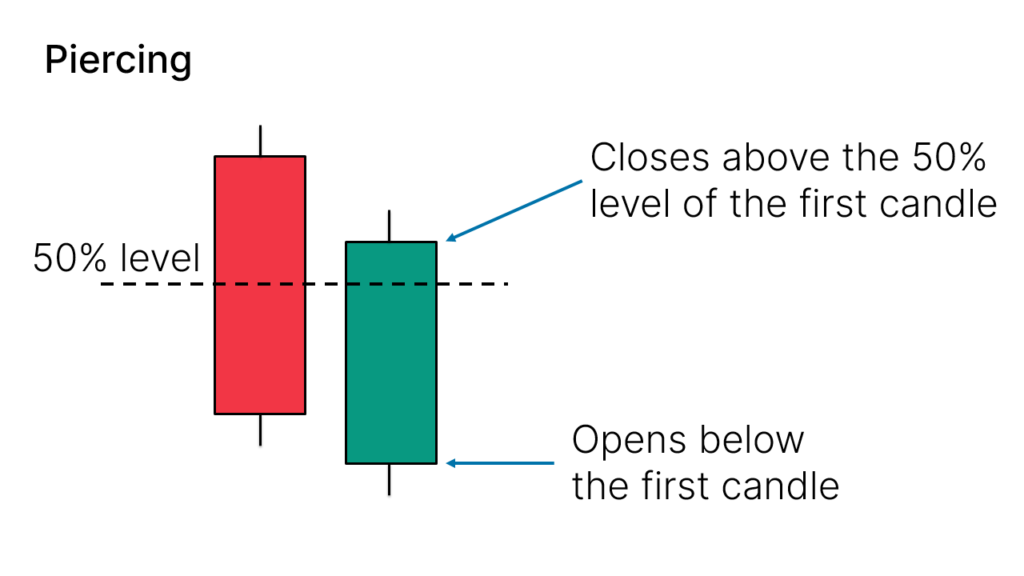
- Success Rate: 64%
- Application: Appears after a downtrend, indicating a potential upward reversal.
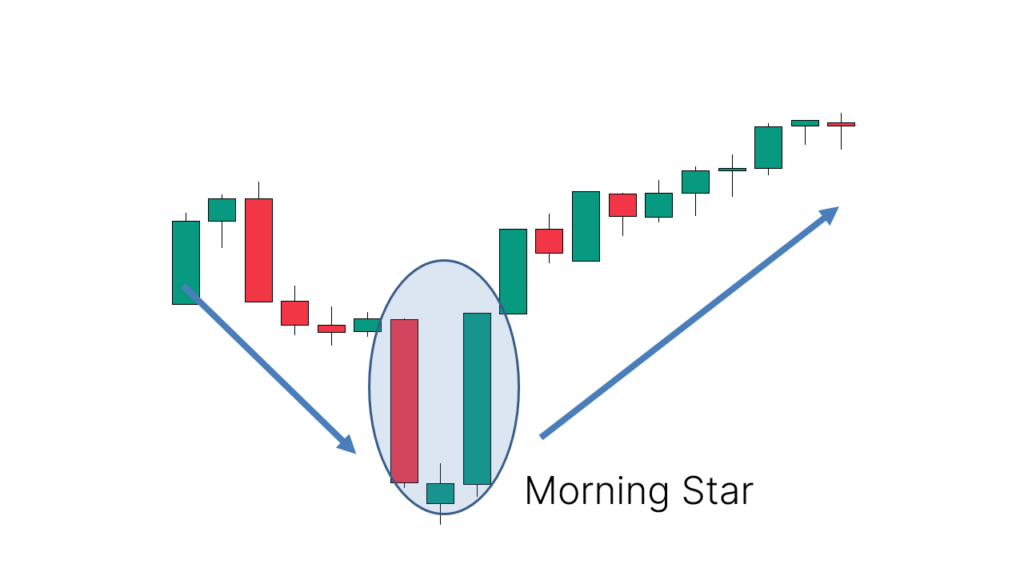
5.Morning Star
- Identification: Composed of three candlesticks; the first is bearish, the third is bullish, and the middle candlestick has a small body.
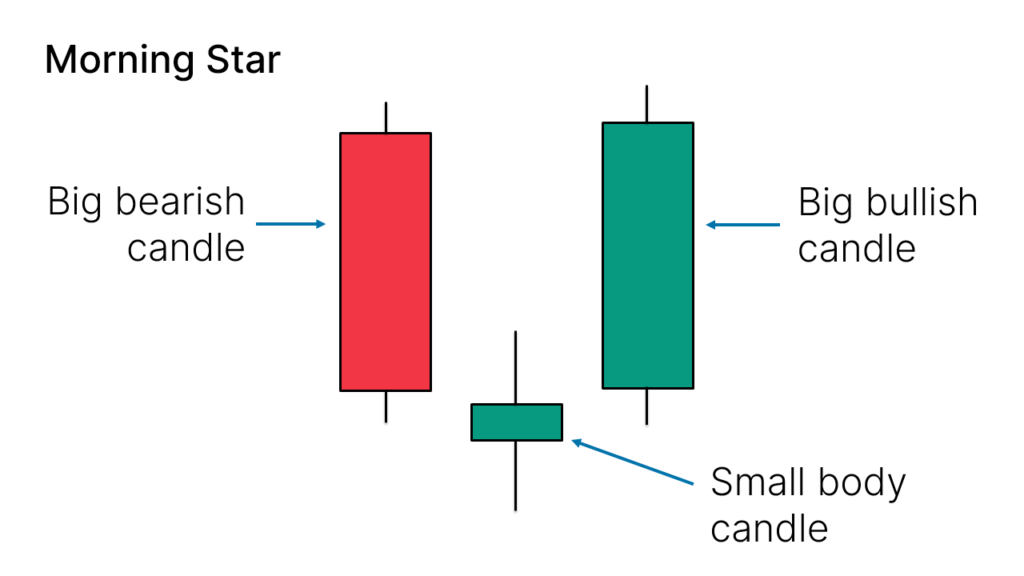
- Success Rate: 78%
- Application: Appears after a downtrend, signaling a possible upward reversal.
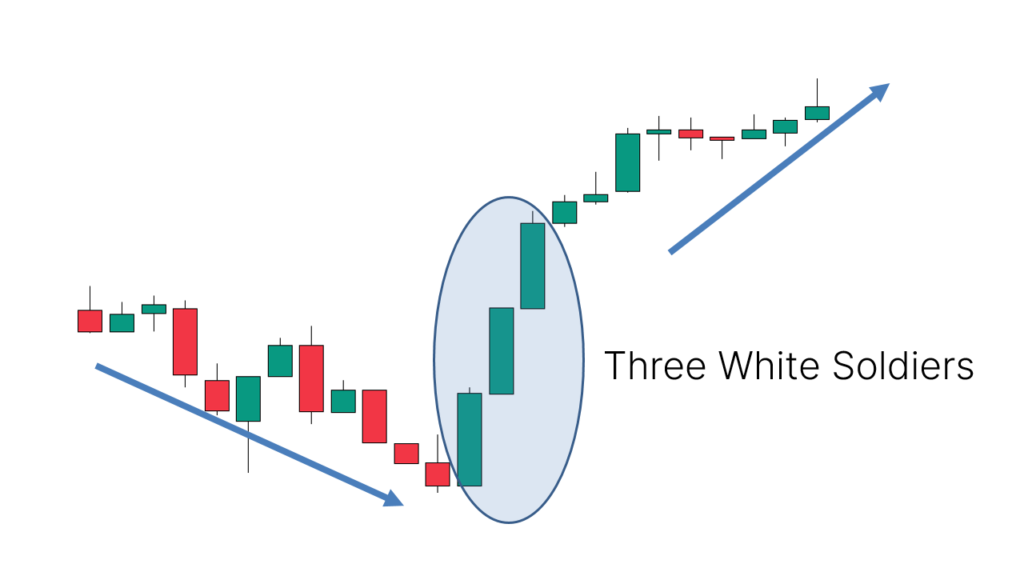
6.Three White Soldiers
- Identification: Composed of three consecutive bullish candlesticks with large bodies and small or no shadows.
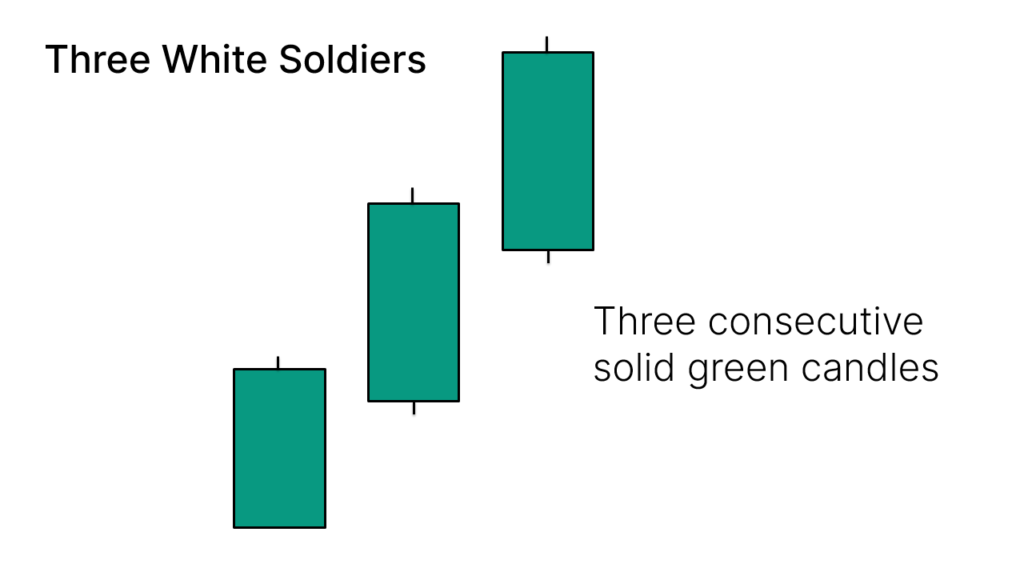
- Success Rate: 84%
- Application: Appears after a downtrend, indicating a strong potential upward move.
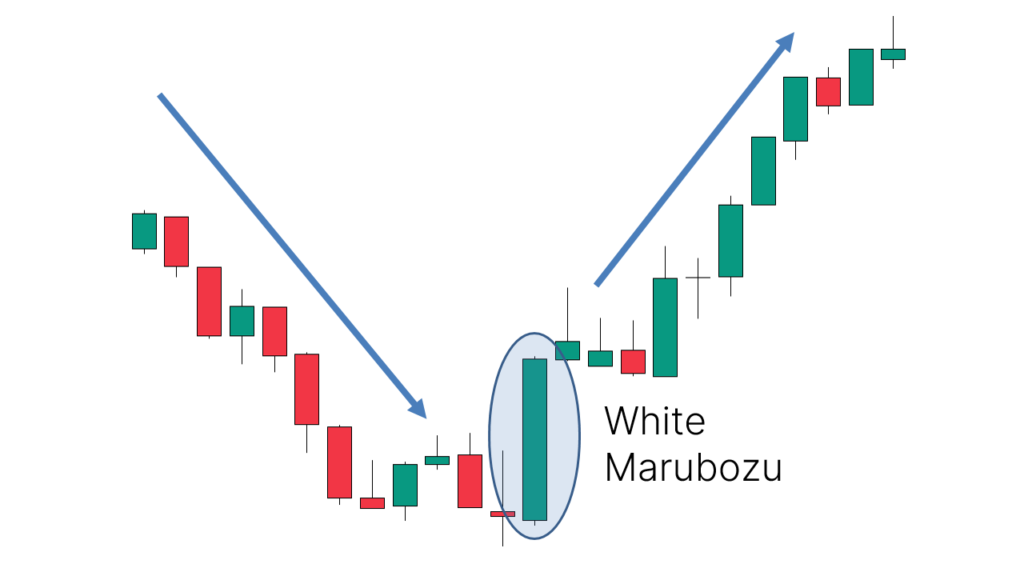
7.White Marubozu
- Identification: Single bullish candlestick with a large body and little or no shadows.
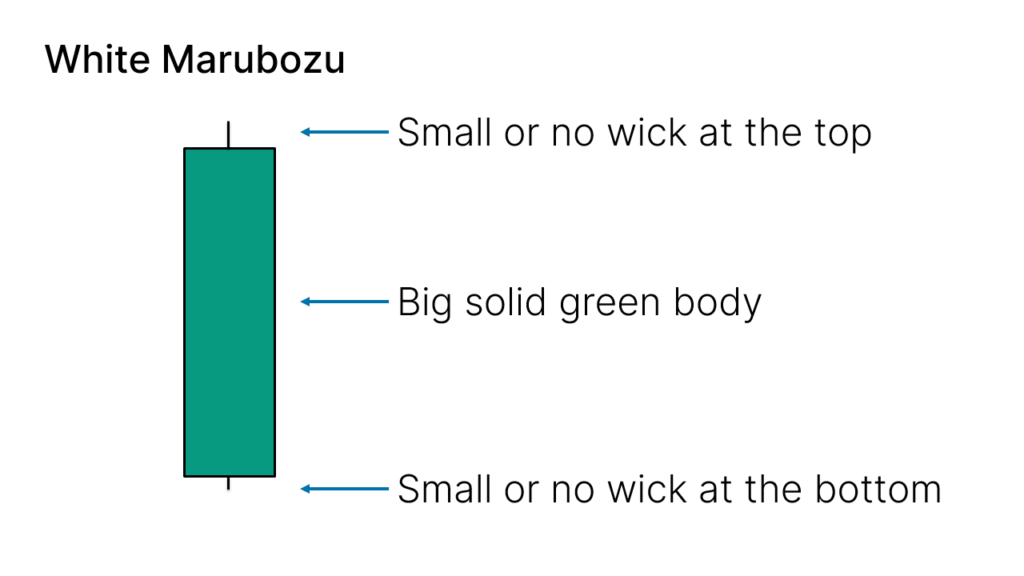
- Success Rate: 71%
- Application: Appears after a downtrend, suggesting a potential upward reversal.
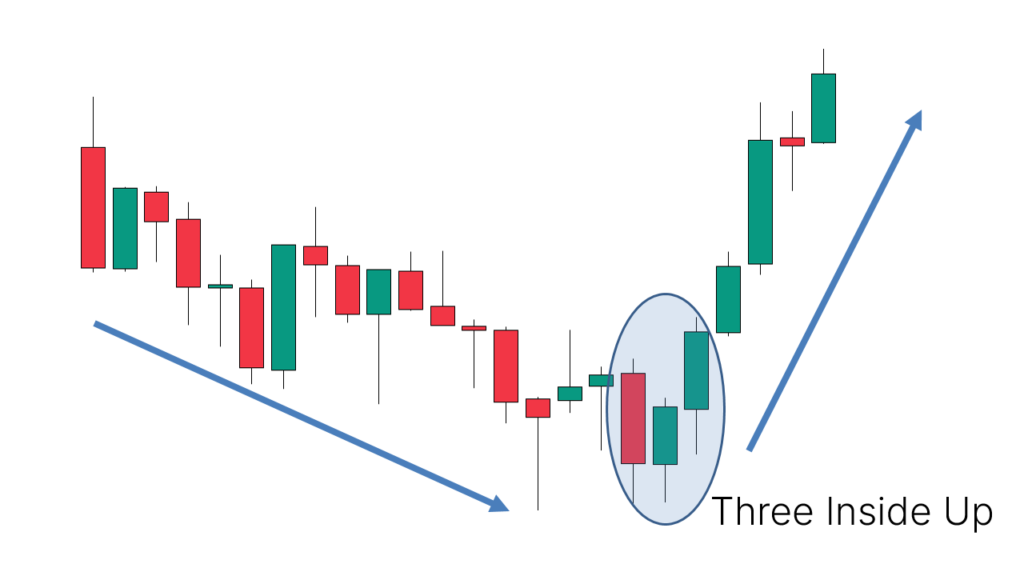
8.Three Inside Up
- Identification: Composed of three candlesticks; the first is bearish, the second is bullish, and the third closes above the first candlestick's close.
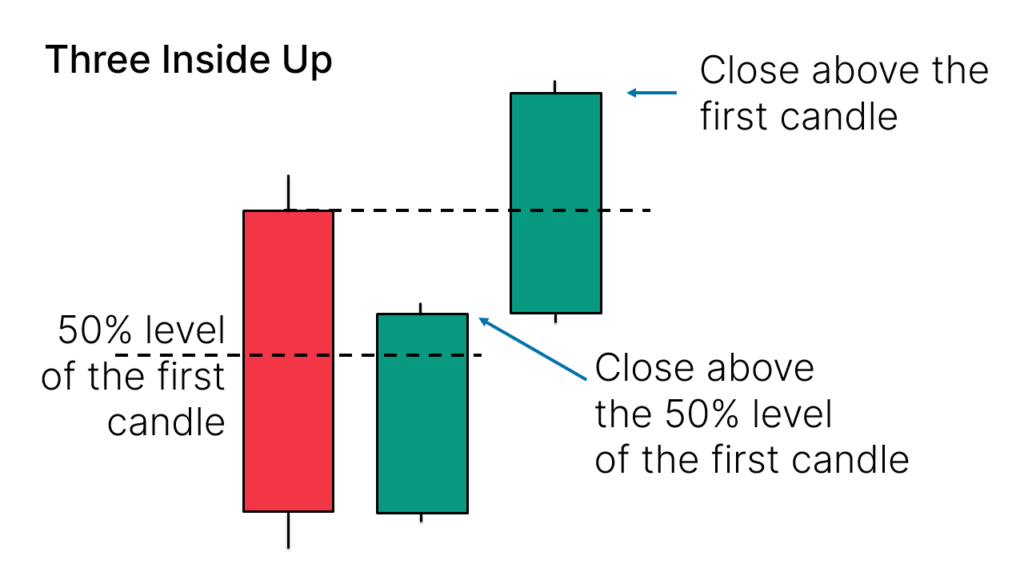
- Success Rate: 65%
- Application: Appears after a downtrend, indicating a potential upward reversal.
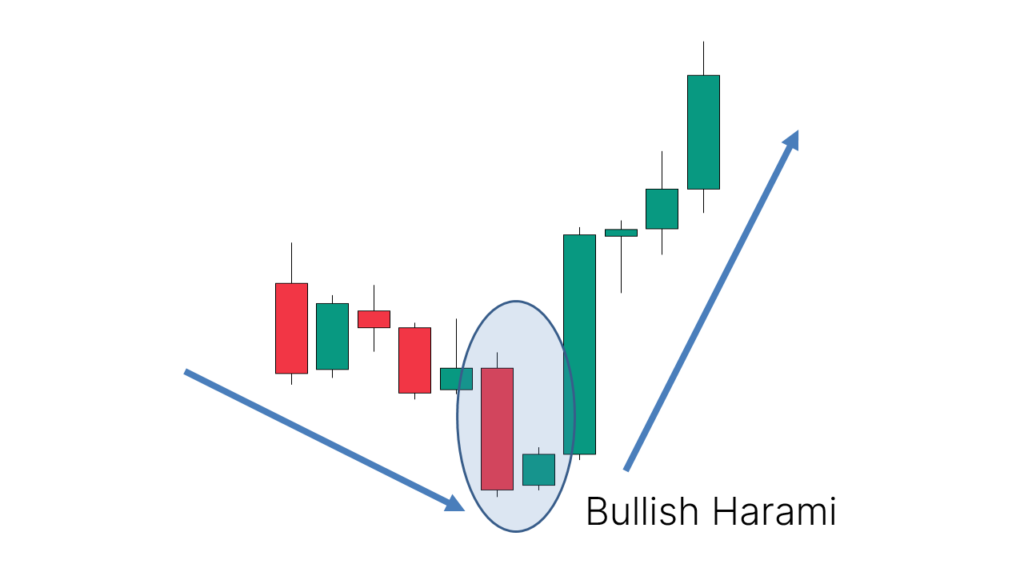
9.Bullish Harami
- Identification: Composed of two candlesticks; the first has a large bearish body, and the second has a small bullish body.
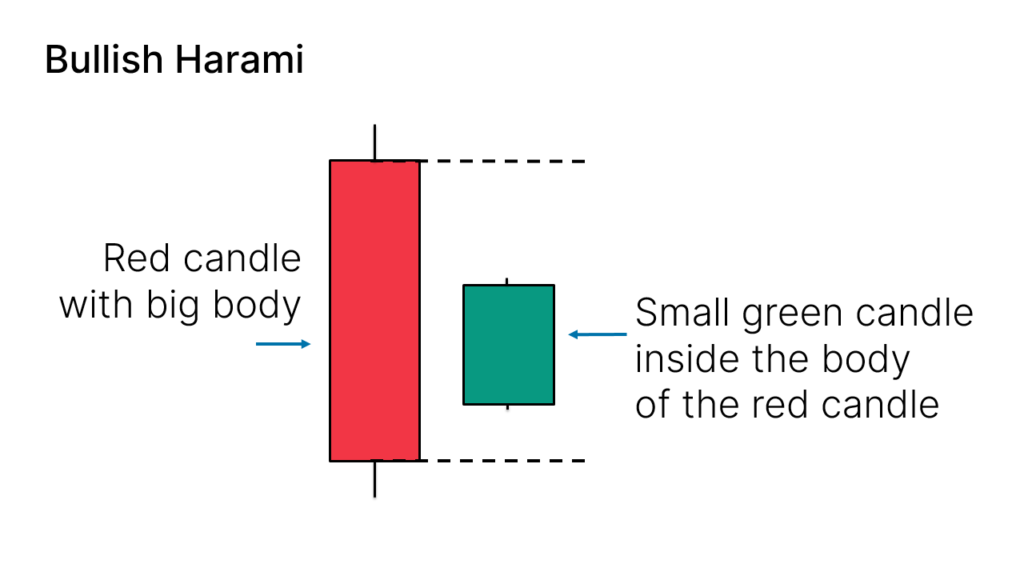
- Success Rate: 53%
- Application: Appears after a downtrend, suggesting a possible upward reversal.
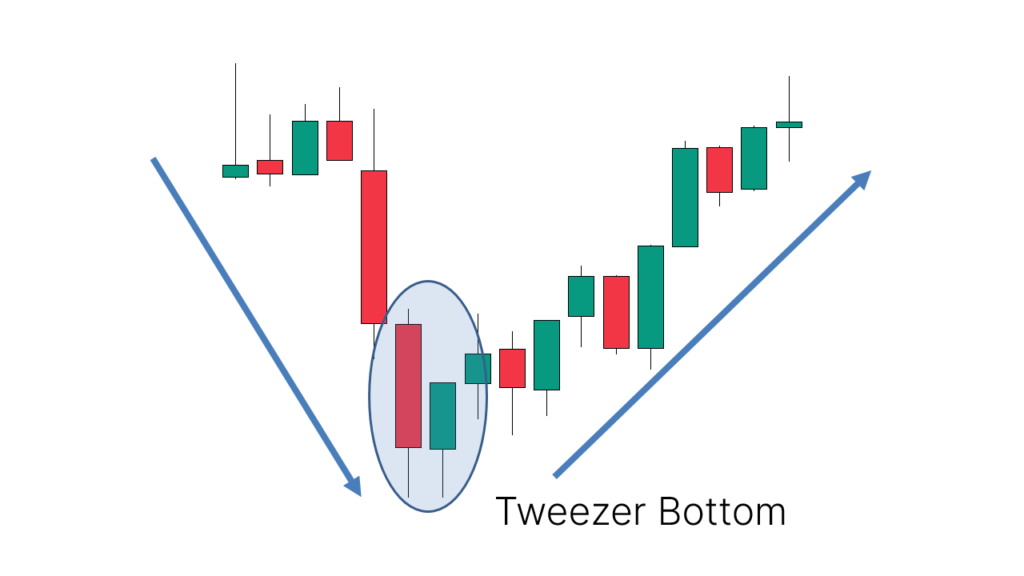
10.Tweezer Bottom
- Identification: Composed of two candlesticks; the first is bearish, and the second is bullish, with both lows at nearly the same level.
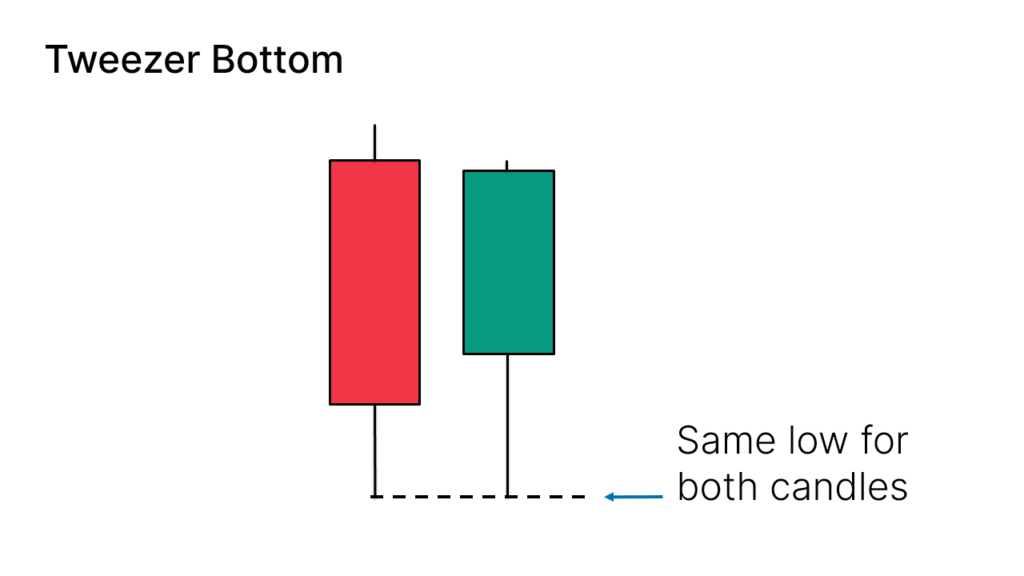
- Success Rate: 56%
- Application: Appears after a downtrend, indicating a potential upward reversal.
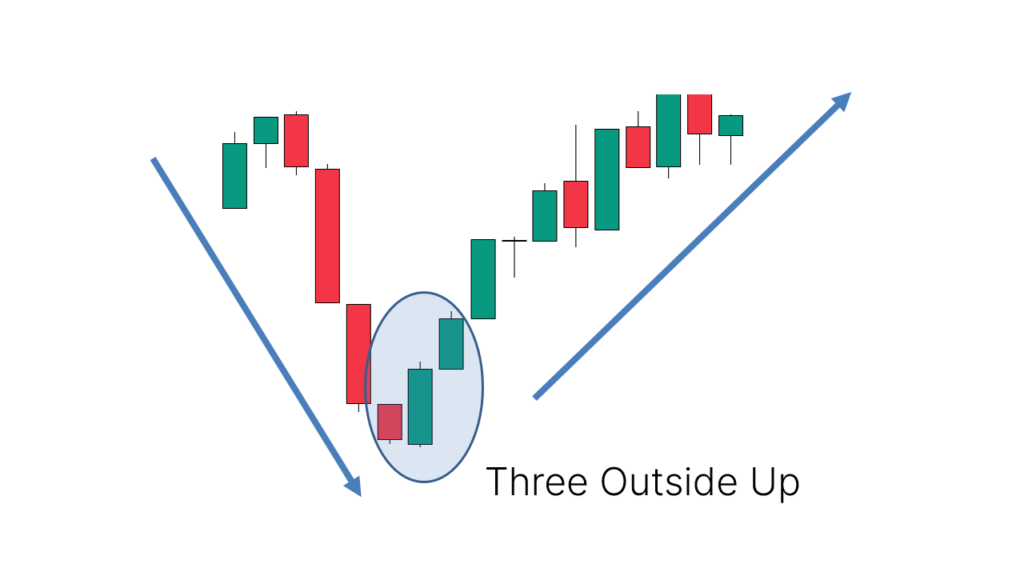
11.Three Outside Up
- Identification: Composed of three candlesticks; the first is a small bearish candlestick, the second fully engulfs the first, and the third is bullish.
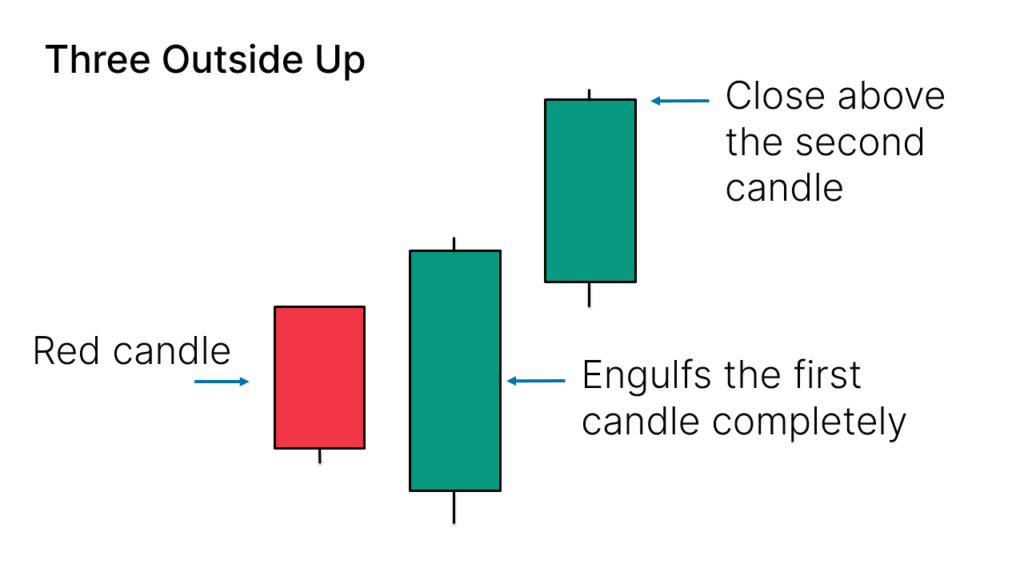
- Success Rate: 75%
- Application: Appears after a downtrend, signaling a potential upward reversal.
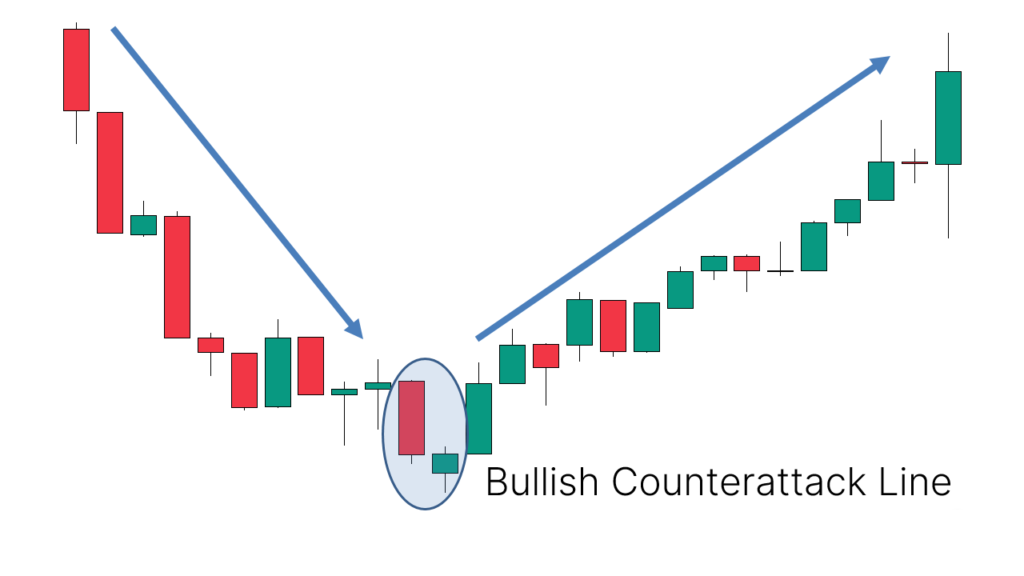
12.Bullish Counterattack Line
- Identification: Composed of two candlesticks; the first is a large bearish candlestick, and the second is a small bullish candlestick with the same closing price as the first.
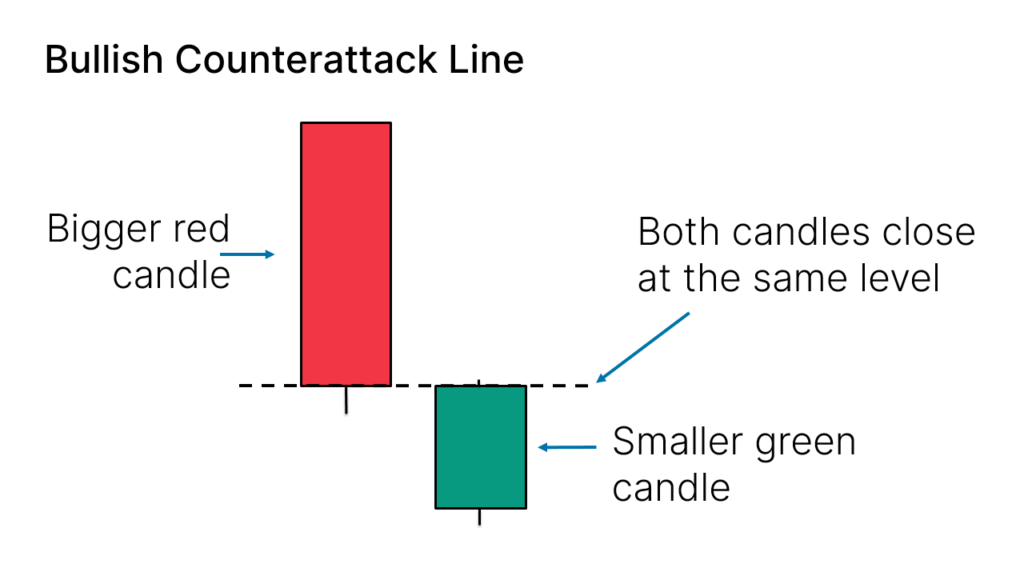
- Application: Appears after a downtrend, suggesting a possible upward reversal.
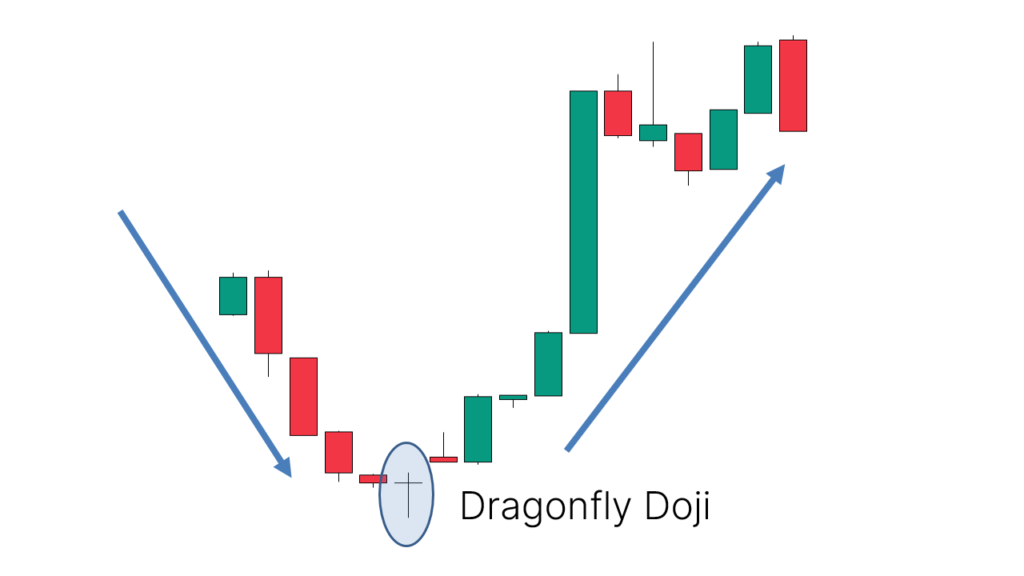
13.Dragonfly Doji
- Identification: Single candlestick with no body, a long lower shadow, and no or very short upper shadow.
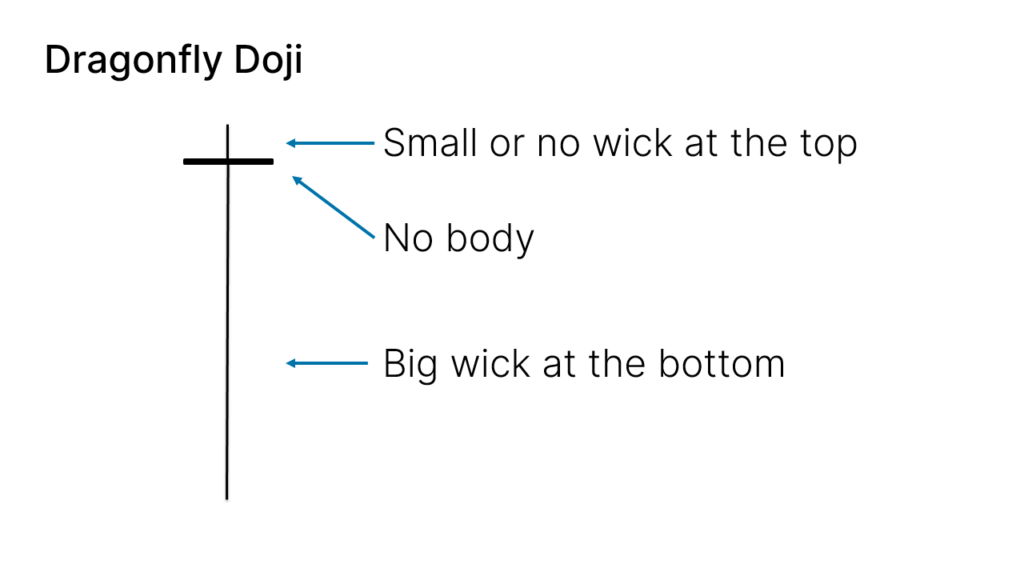
- Success Rate: 51%
- Application: Appears after a downtrend, indicating a potential upward reversal.
Bearish Reversal Candlestick Patterns
Bearish reversal candlestick patterns indicate that sellers are taking control of the market or regaining dominance. These patterns are typically used to find short-selling opportunities but can also serve as warning signals for closing positions. Below are common bearish reversal candlestick patterns and their key identification points:
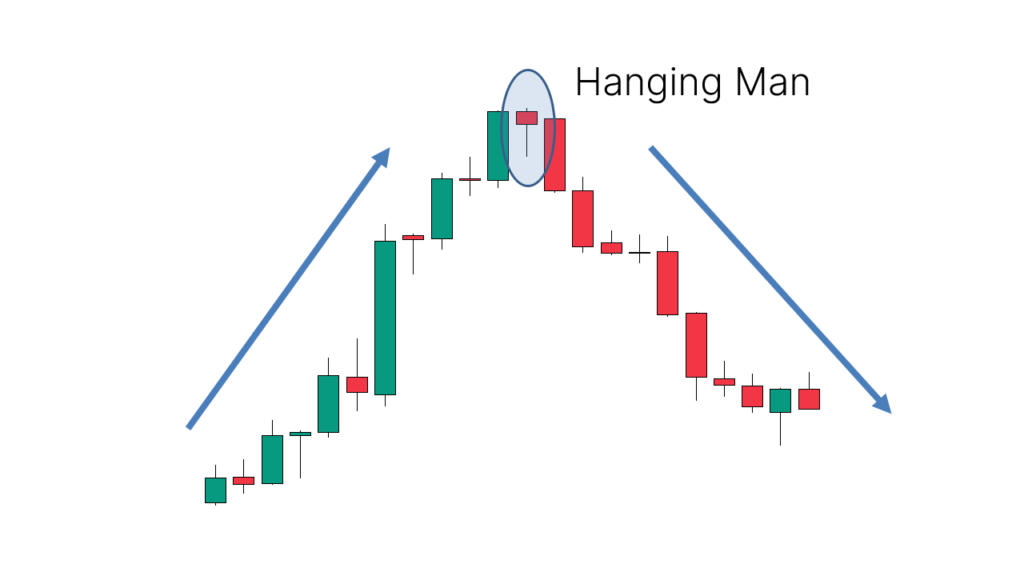
1.Hanging Man
- Identification: Single candlestick with a small body and a long lower shadow, little or no upper shadow; body color is not important.
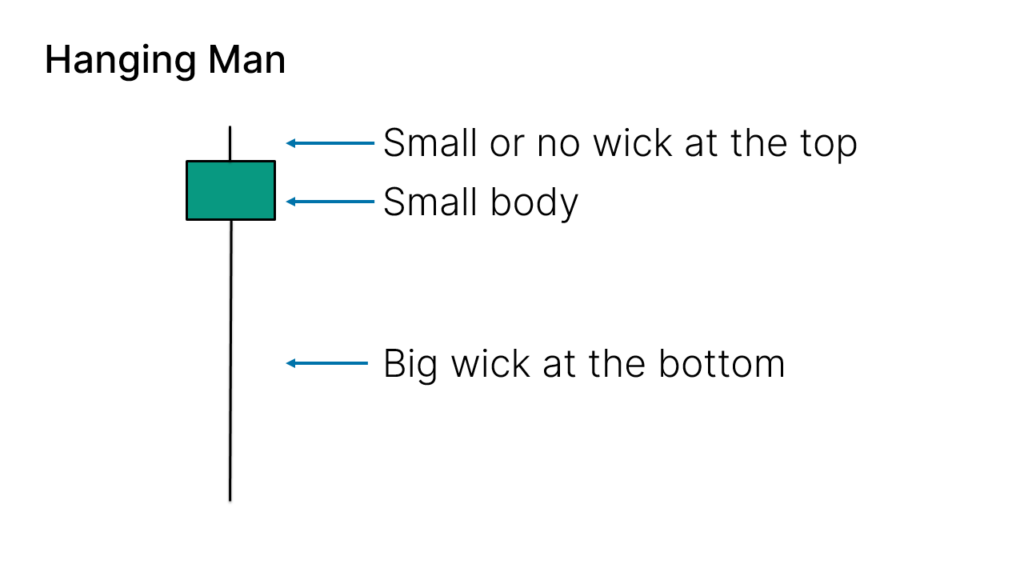
- Success Rate: 59%
- Application: Appears after an uptrend, signaling a potential reversal downwards or a continuation of a downtrend after a rally.
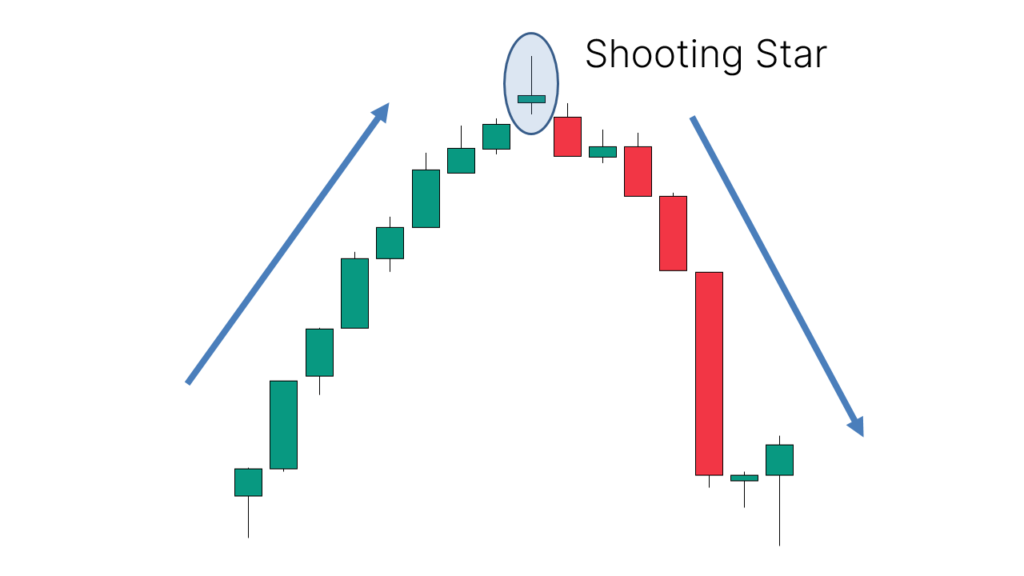
2.Shooting Star
- Identification: Single candlestick with a small body and a long upper shadow, little or no lower shadow; body color is not important.
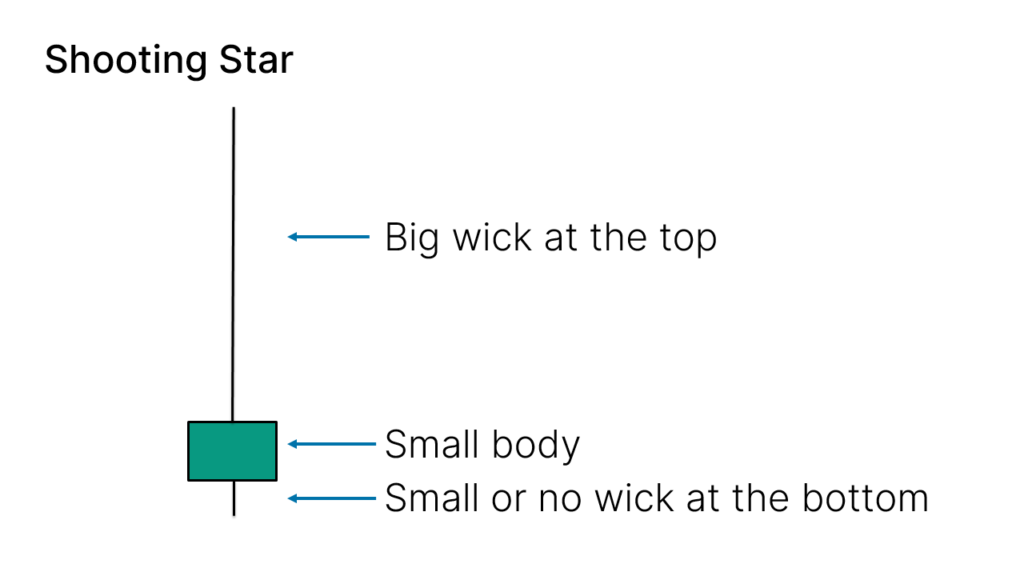
- Success Rate: 60%
- Application: Appears after an uptrend, indicating a potential downward reversal or continuation of a downtrend after a rally.
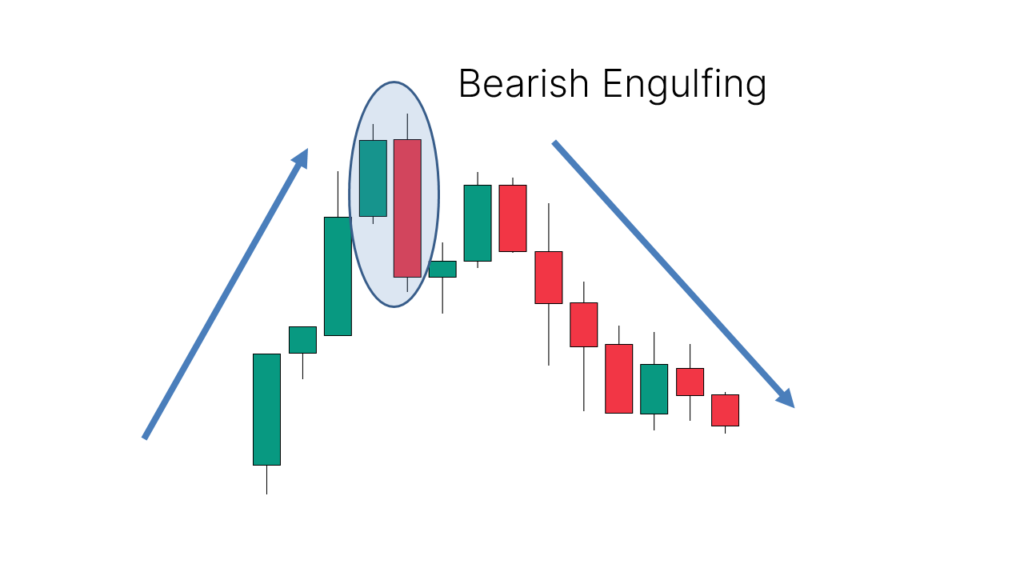
3.Bearish Engulfing
- Identification: Composed of two candlesticks; the first is bullish, and the second is bearish, with the second candlestick's body completely engulfing the first.
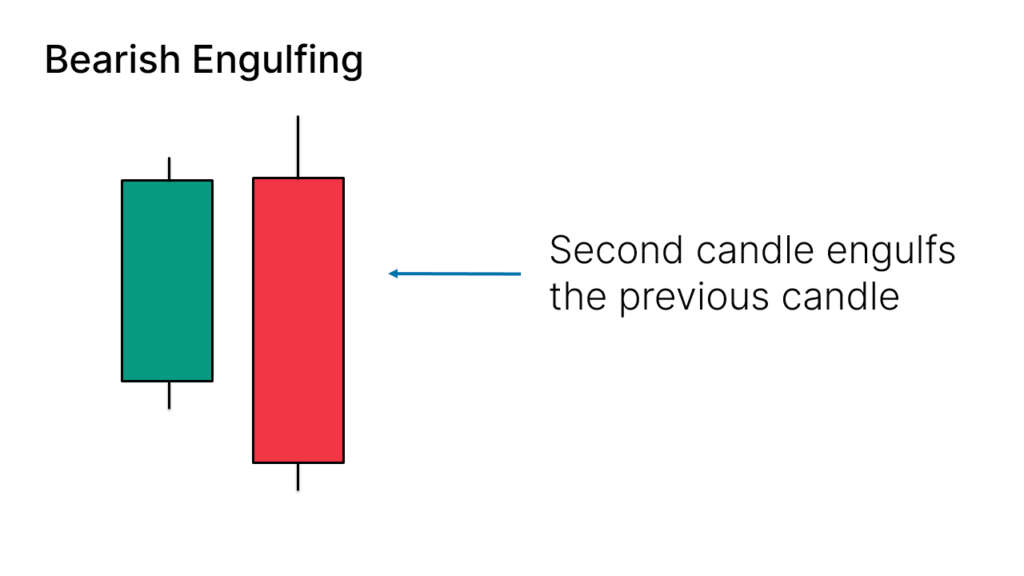
- Success Rate: 82%
- Application: Appears after an uptrend, suggesting a potential downward reversal or continuation of a downtrend.
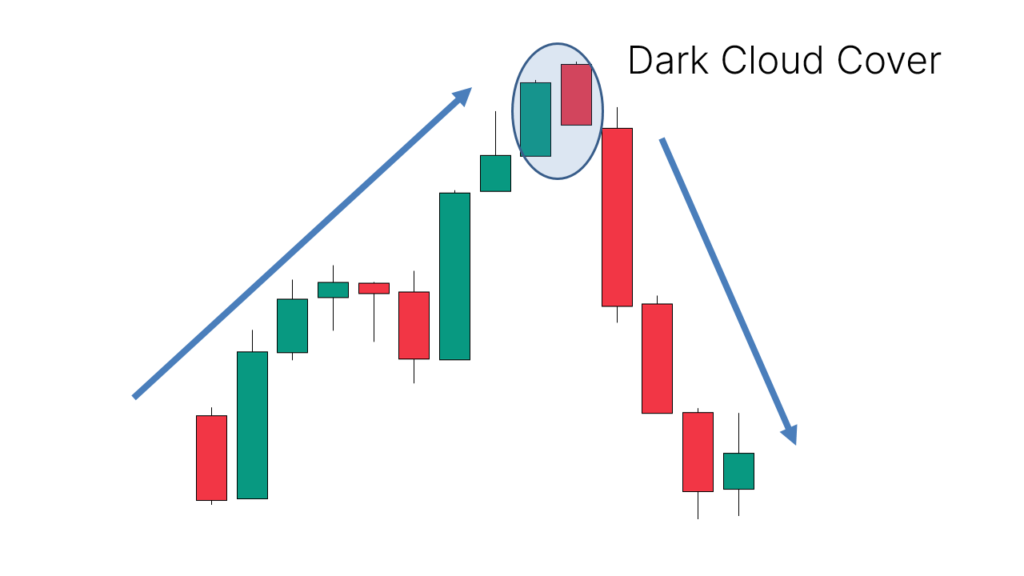
4.Dark Cloud Cover
- Identification: Composed of two candlesticks; the first is bullish, and the second is bearish, with the second candlestick opening above the first (with a gap) and closing below the 50% mark of the first candlestick's body.
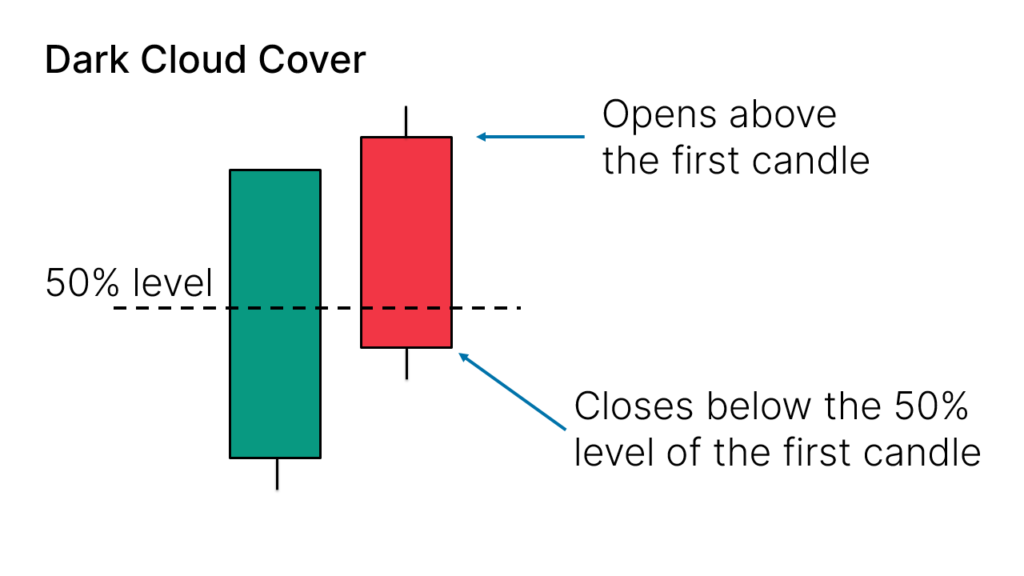
- Success Rate: 63%
- Application: Appears after an uptrend, indicating a possible downward reversal or continuation of a downtrend.
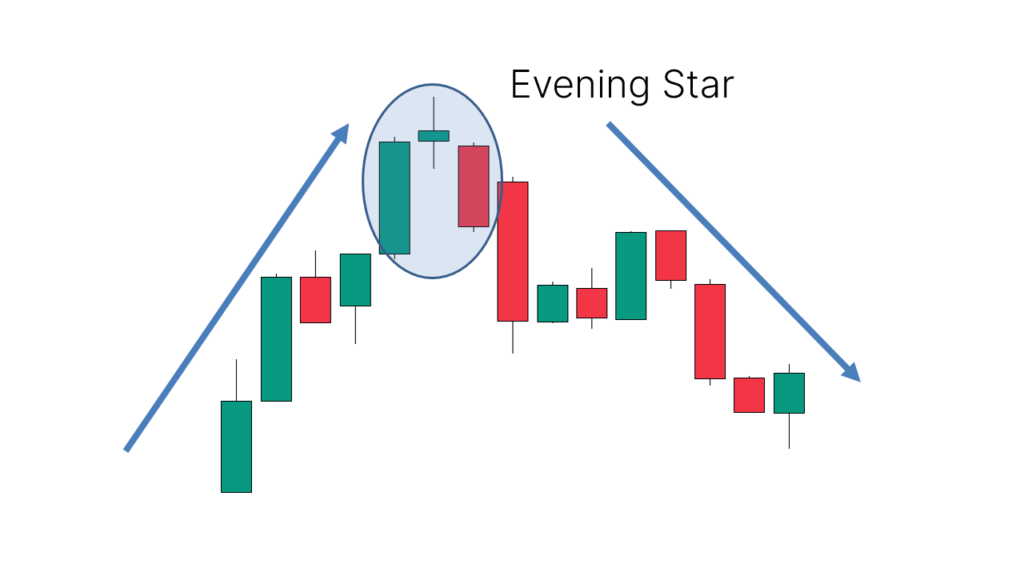
5.Evening Star
- Identification: Composed of three candlesticks; the first is bullish, the third is bearish, and the middle candlestick has a small body.
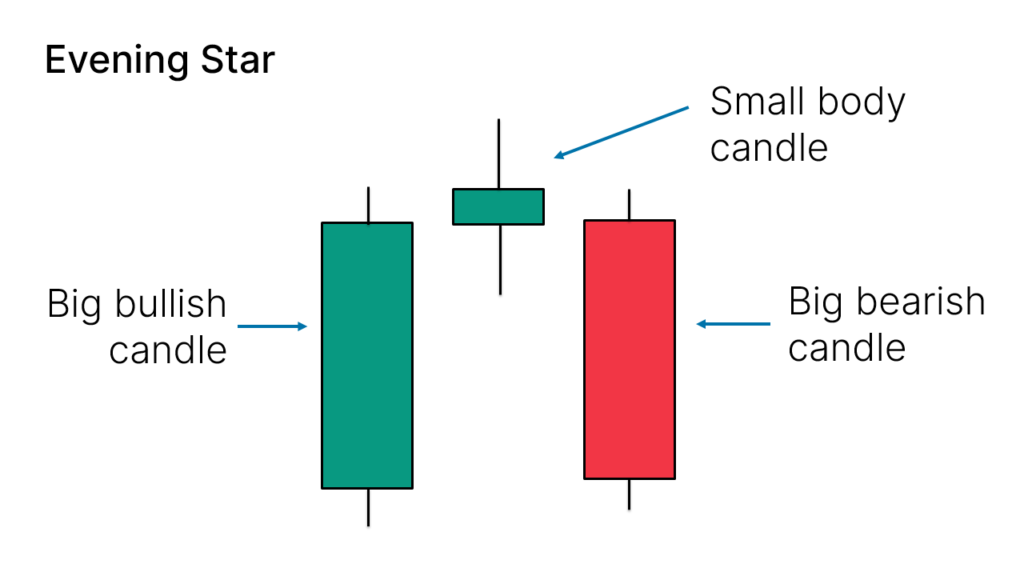
- Success Rate: 71%
- Application: Appears after an uptrend, suggesting a potential downward reversal or continuation of a downtrend.
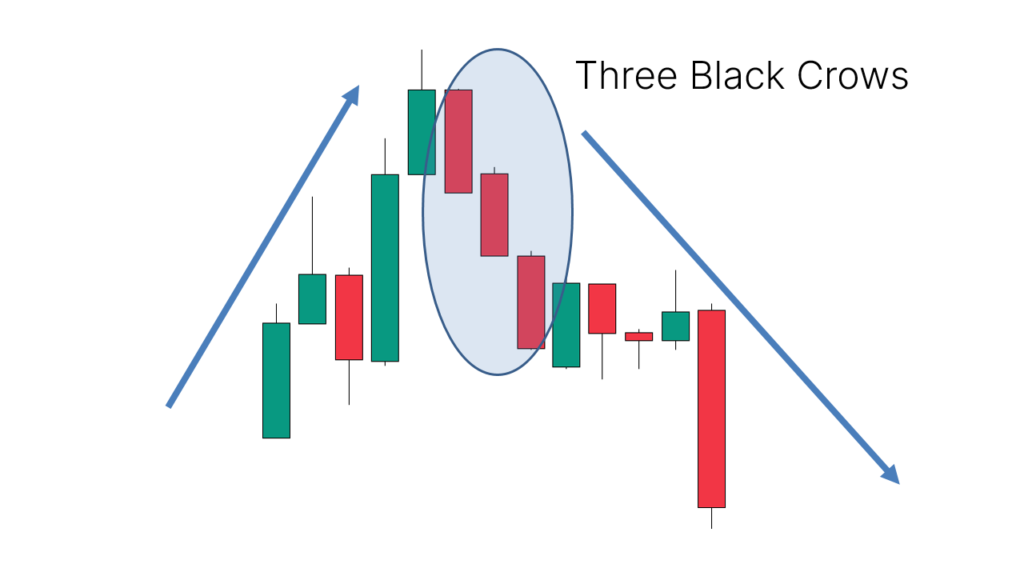
6.Three Black Crows
- Identification: Composed of three consecutive bearish candlesticks with large bodies and small or no shadows.
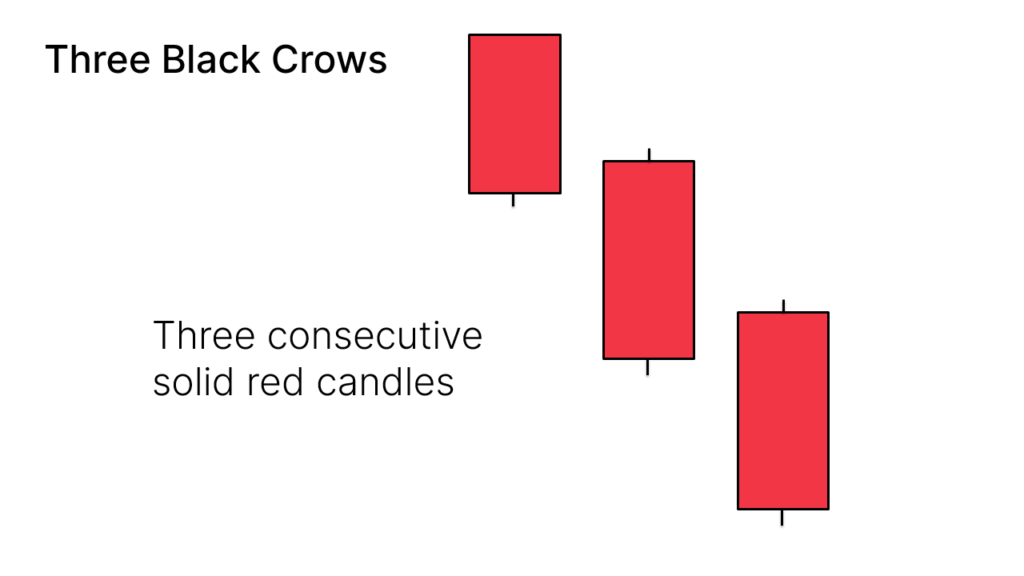
- Success Rate: 79%
- Application: Appears after an uptrend, indicating a strong potential downward move.
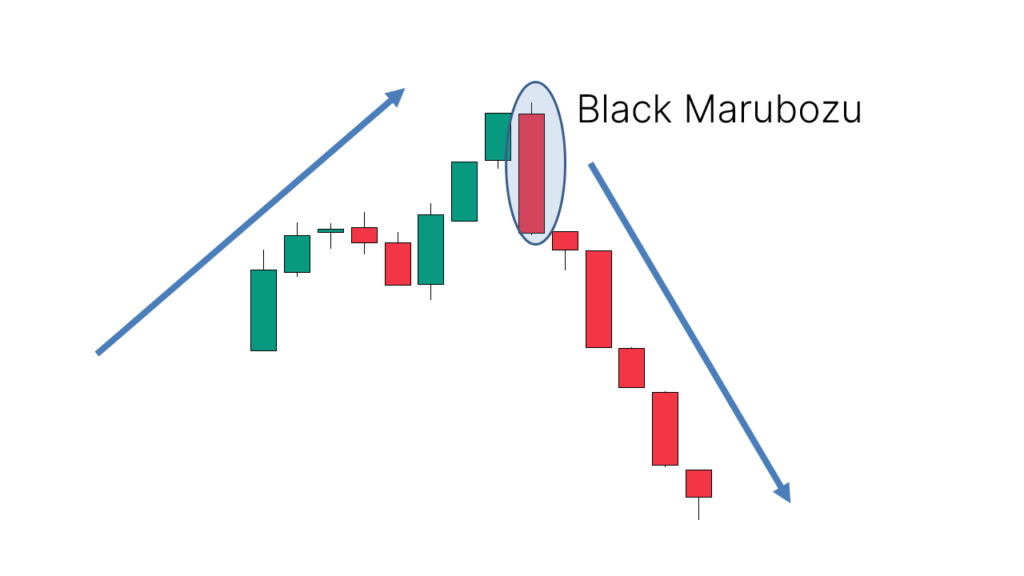
7.Black Marubozu
- Identification: Single bearish candlestick with a large body and little or no shadows.
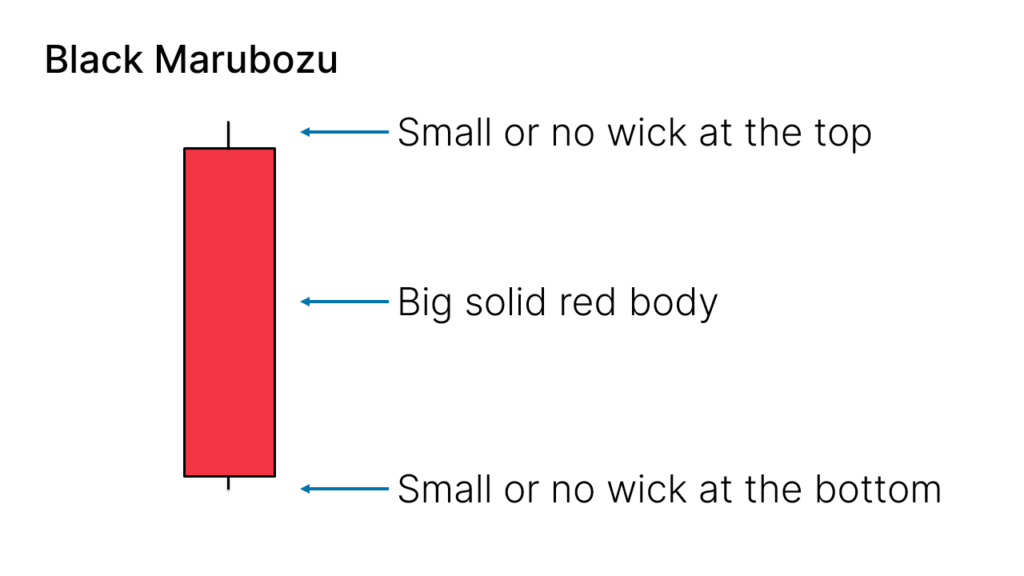
- Success Rate: 54%
- Application: Appears after an uptrend, suggesting a potential downward reversal or continuation of a downtrend.
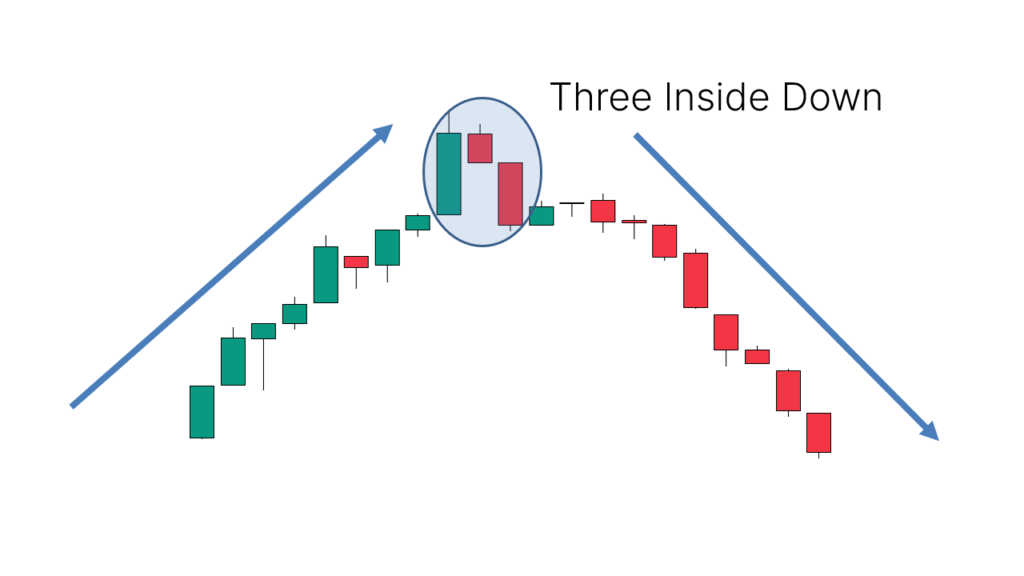
8.Three Inside Down
- Identification: Composed of three candlesticks; the first is bullish, the second is bearish, and the second candlestick's close should be below the 50% mark of the first candlestick's body, with the third closing below the first candlestick.

- Success Rate: 69%
- Application: Appears after an uptrend, indicating a potential downward reversal or continuation of a downtrend.
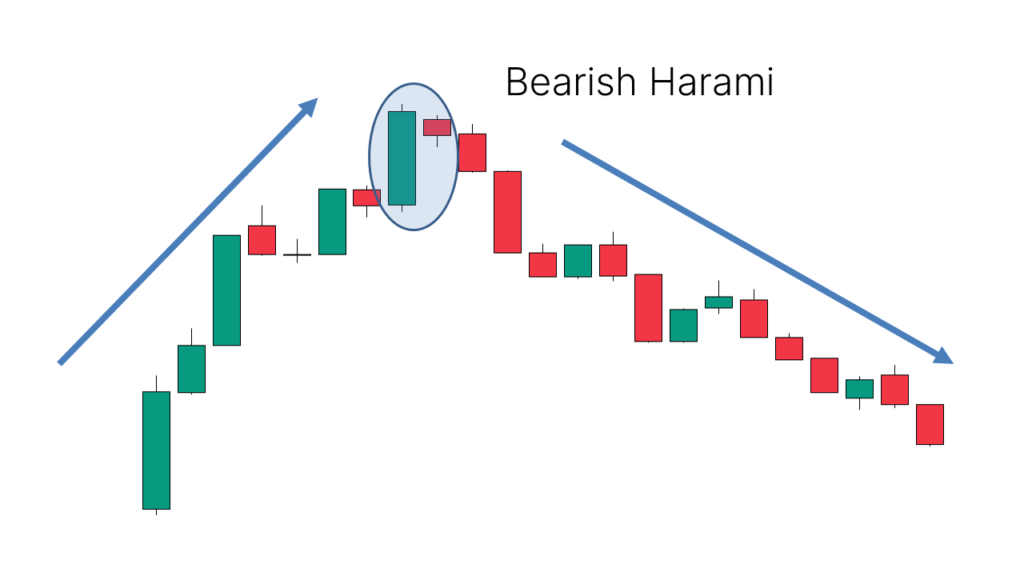
9.Bearish Harami
- Identification: Composed of two candlesticks; the first has a large bullish body, and the second has a small bearish body, completely enclosed within the first candlestick's body.
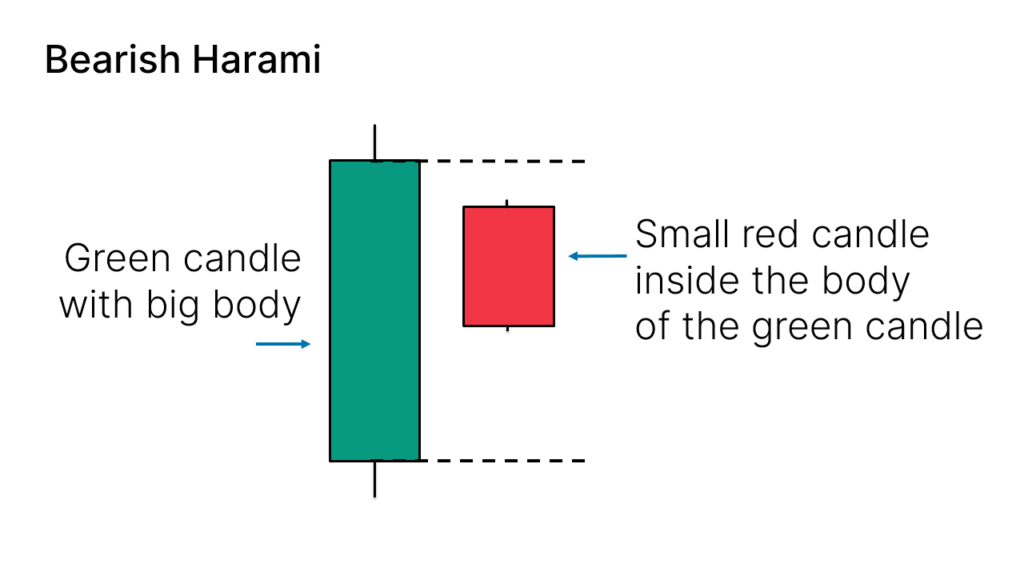
- Success Rate: 53%
- Application: Appears after an uptrend, suggesting a possible downward reversal or continuation of a downtrend.
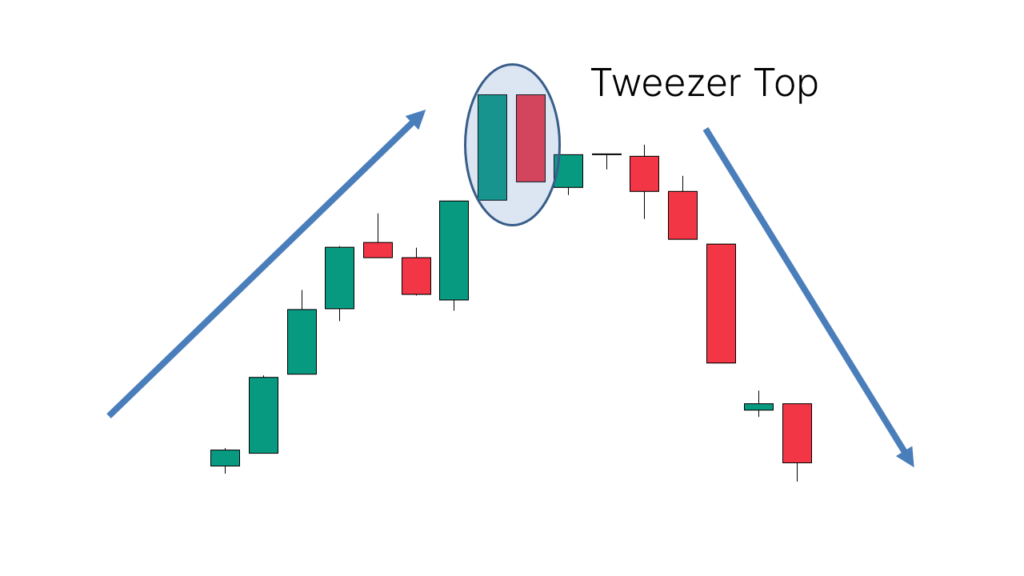
10.Tweezer Top
- Identification: Composed of two candlesticks; the first is bullish, and the second is bearish, with both highs at nearly the same level.
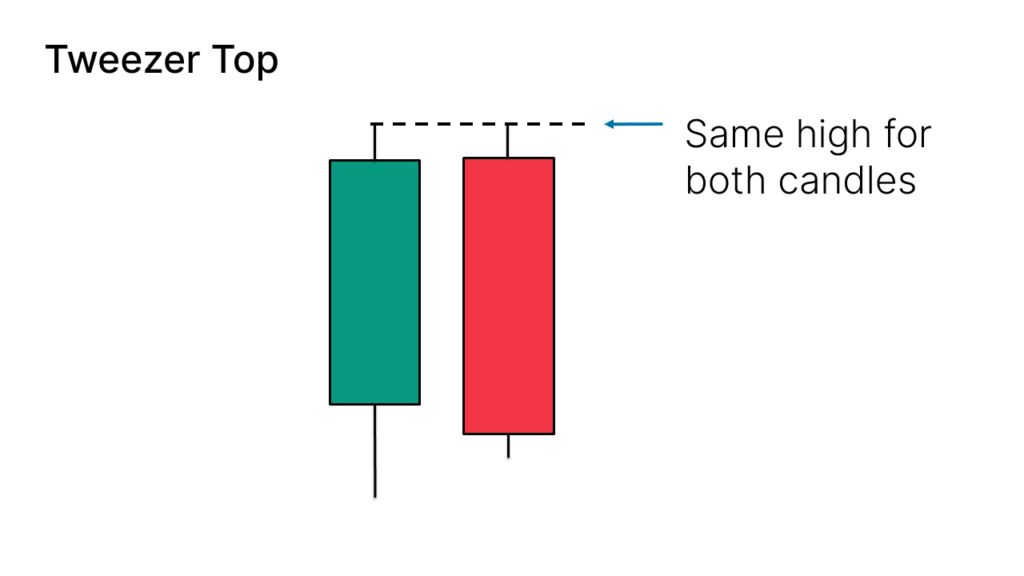
- Success Rate: 56%
- Application: Appears after an uptrend, indicating a potential downward reversal or continuation of a downtrend.
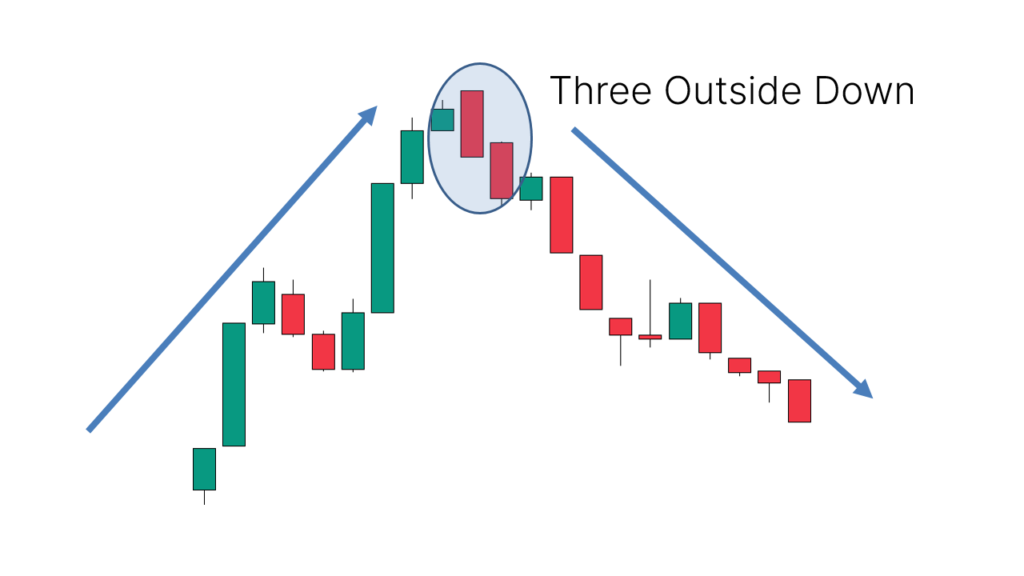
11.Three Outside Down
- Identification: Composed of three candlesticks; the first is a small bullish candlestick, the second completely engulfs the first, and the third is a bearish candlestick closing lower than the other candlesticks.
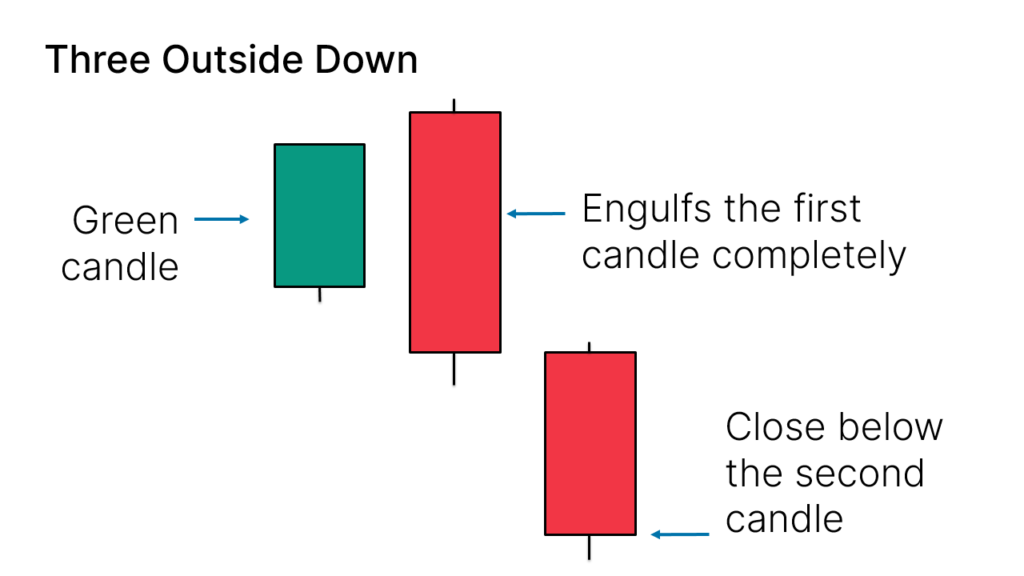
- Success Rate: 70%
- Application: Appears after an uptrend, signaling a potential downward reversal or continuation of a downtrend.
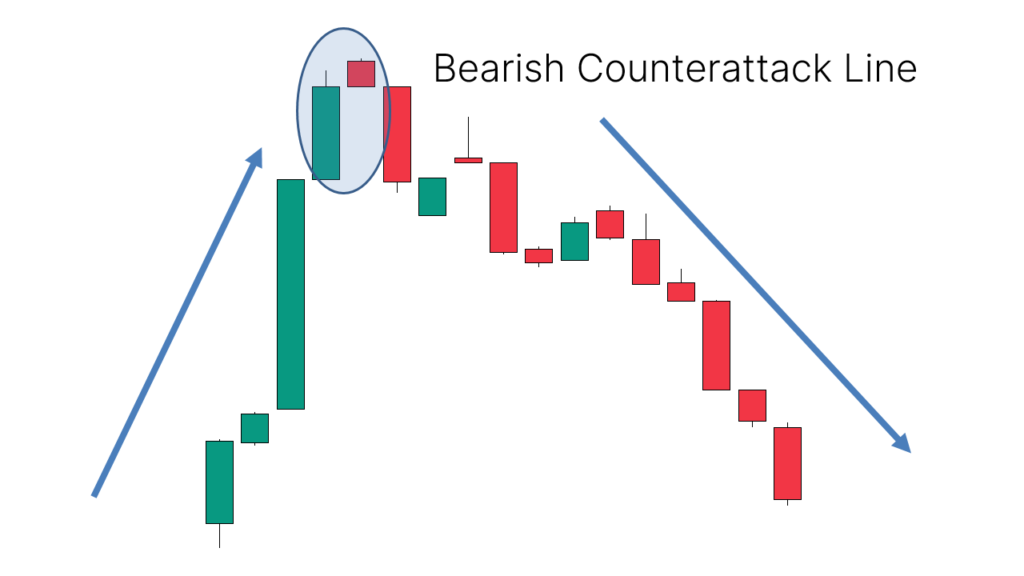
12.Bearish Counterattack Line
- Identification: Composed of two candlesticks; the first is a large bullish candlestick, and the second is a small bearish candlestick with the same closing price as the first, separated by a gap.
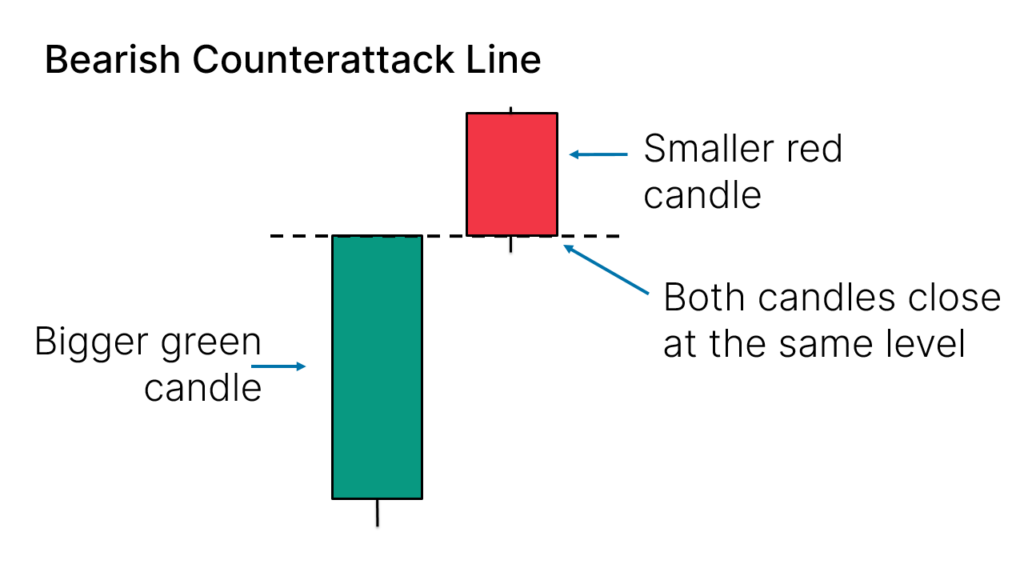
- Application: Appears after an uptrend, suggesting a possible downward reversal or continuation of a downtrend.
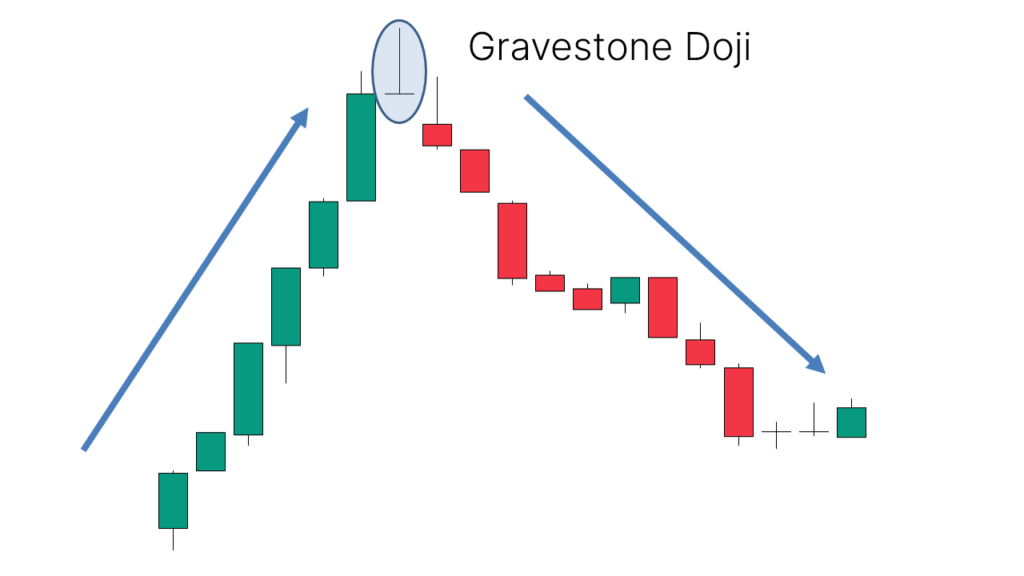
13.Gravestone Doji
- Identification: Single candlestick with a small body and a long upper shadow, with little or no lower shadow.
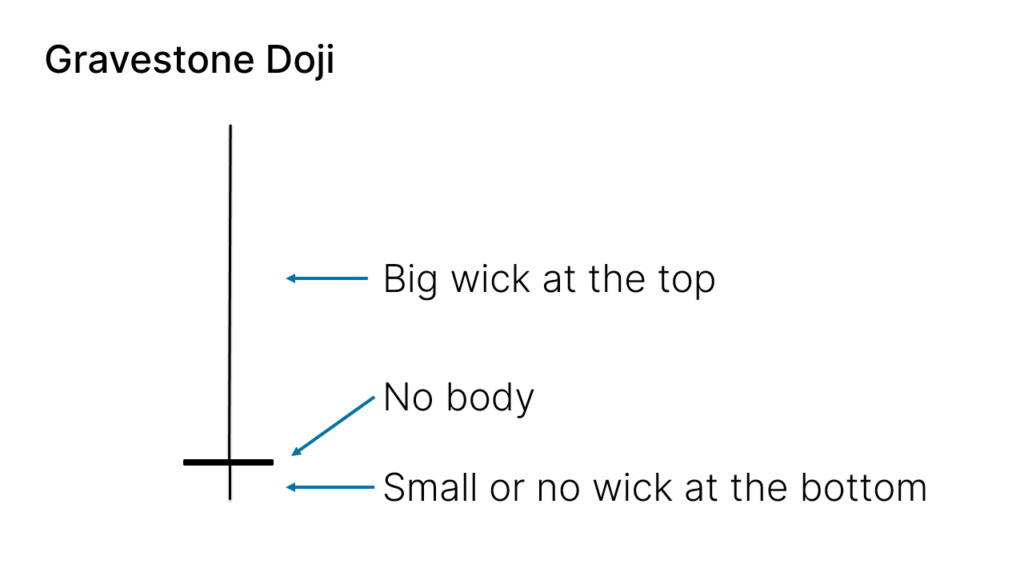
- Success Rate: 51%
- Application: Appears after an uptrend, indicating a potential downward reversal or continuation of a downtrend.
Bullish Continuation Candlestick Patterns
Bullish continuation candlestick patterns indicate that buying pressure remains dominant after a price rise. These patterns are typically used to identify long entry opportunities or to add to existing long positions. Below are some common bullish continuation candlestick patterns and their success rates:
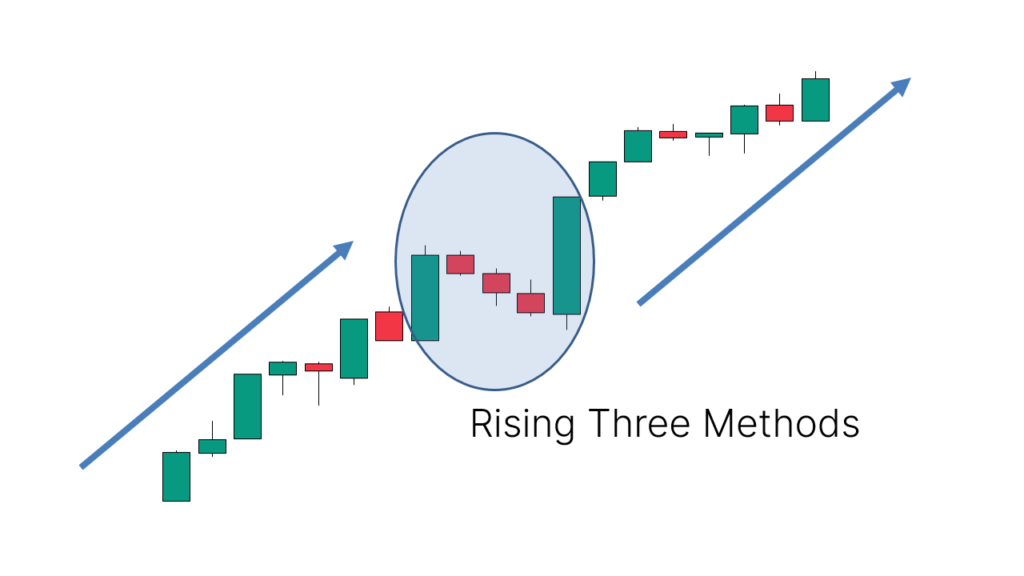
1.Rising Three Methods
- Identification: This pattern consists of five candlesticks. It starts with a large bullish candle, followed by three small bearish candles that do not exceed the high of the first bullish candle. Finally, a large bullish candle appears, closing higher than the other candles.
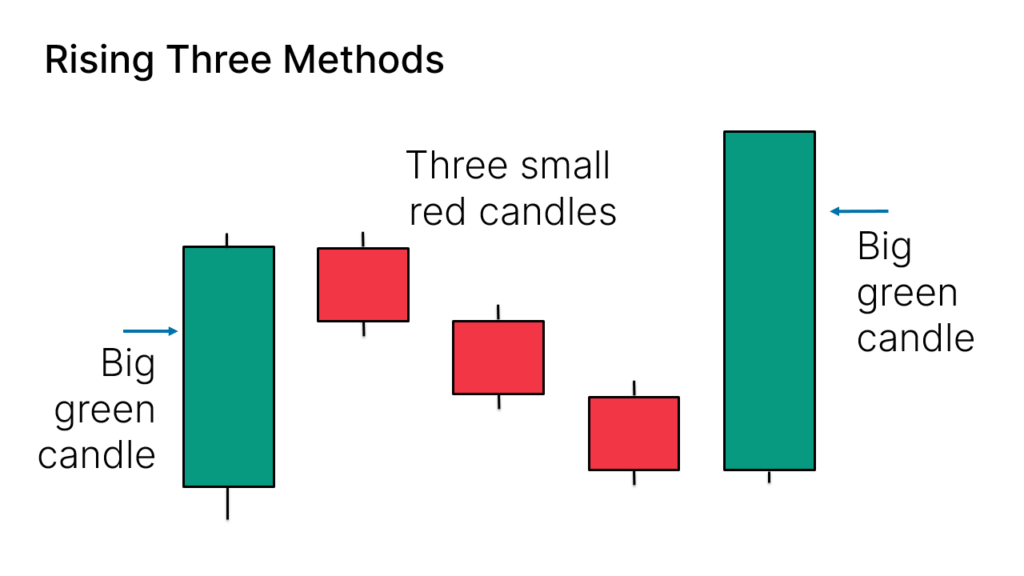
- Success Rate: 79%
- Application: Used to identify buying opportunities after a pause in an uptrend, indicating that bullish forces are regaining dominance.
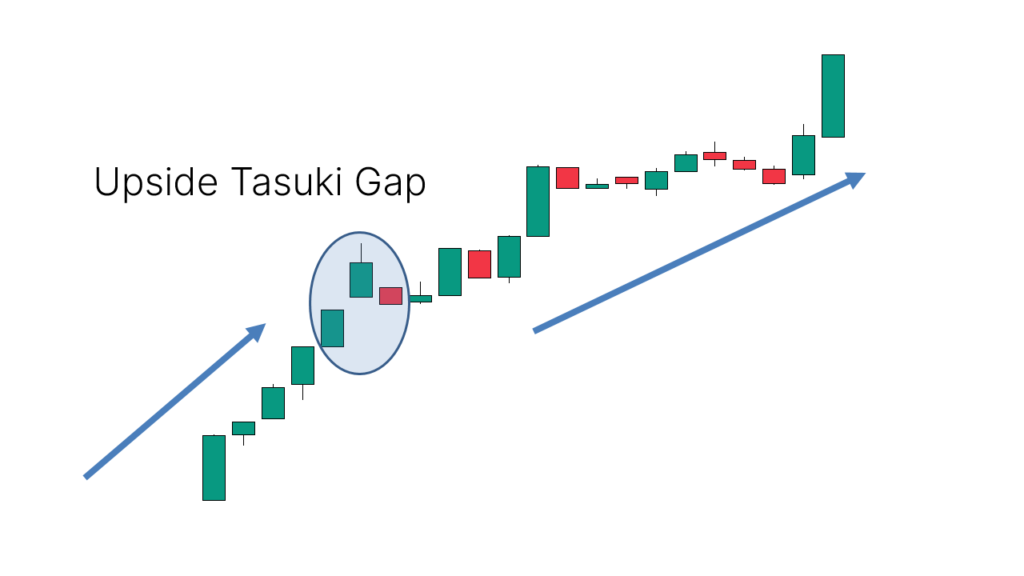
2.Upside Tasuki Gap
- Identification: This pattern consists of three candles. It begins with two consecutive large bullish candles with a gap between them, followed by a small bearish candle closing within the gap.
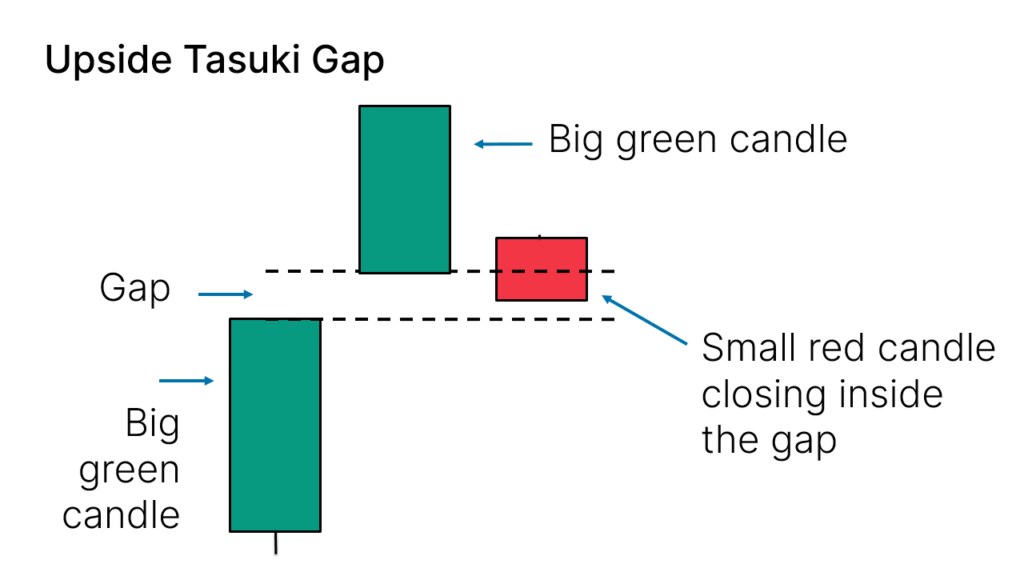
- Success Rate: 57%
- Application: Suitable for identifying buying opportunities after a pause in an uptrend, suggesting that bullish forces may continue to dominate the market.
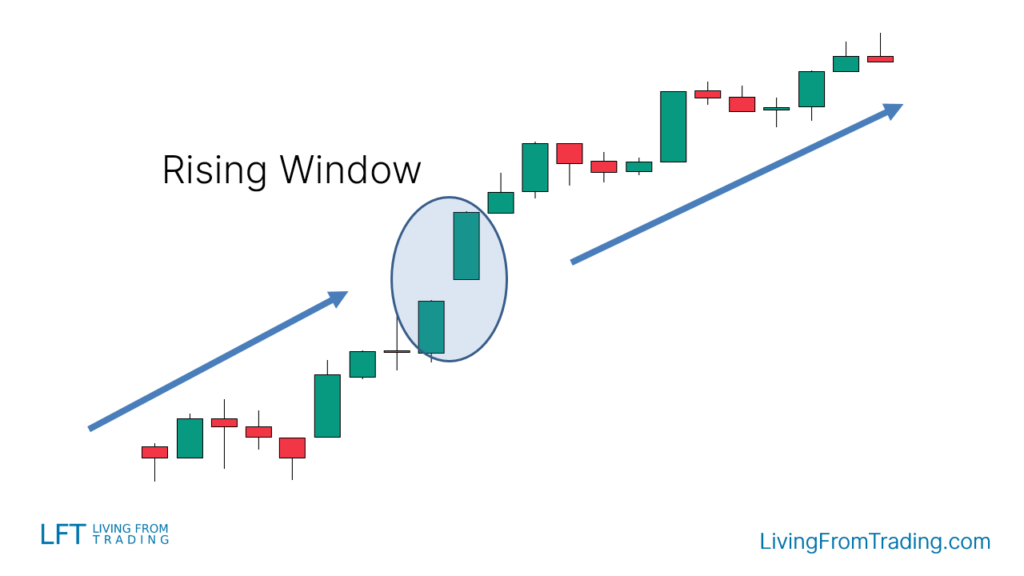
3.Rising Window
- Identification: This pattern consists of two candles. It starts with two consecutive large bullish candles with a gap between them.
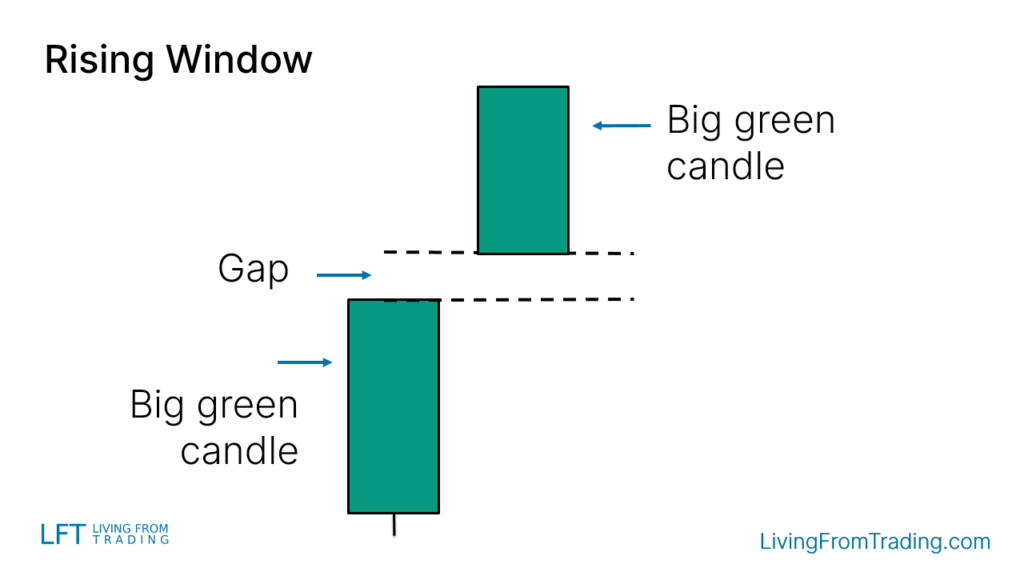
- Success Rate: 75%
- Application: Used to identify buying opportunities after a pause in an uptrend, indicating that bullish forces are recovering.
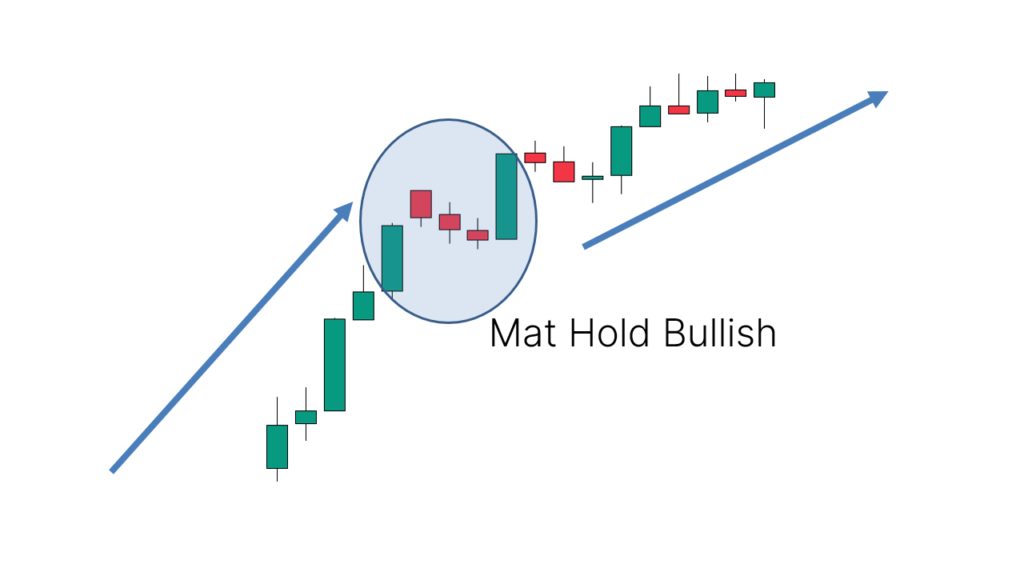
4.Mat Hold Bullish
- Identification: This pattern consists of five candles. It starts with a large bullish candle, followed by a gap and three small bearish candles that do not breach the low of the first bullish candle. The final candle is a large bullish candle closing higher than the others.
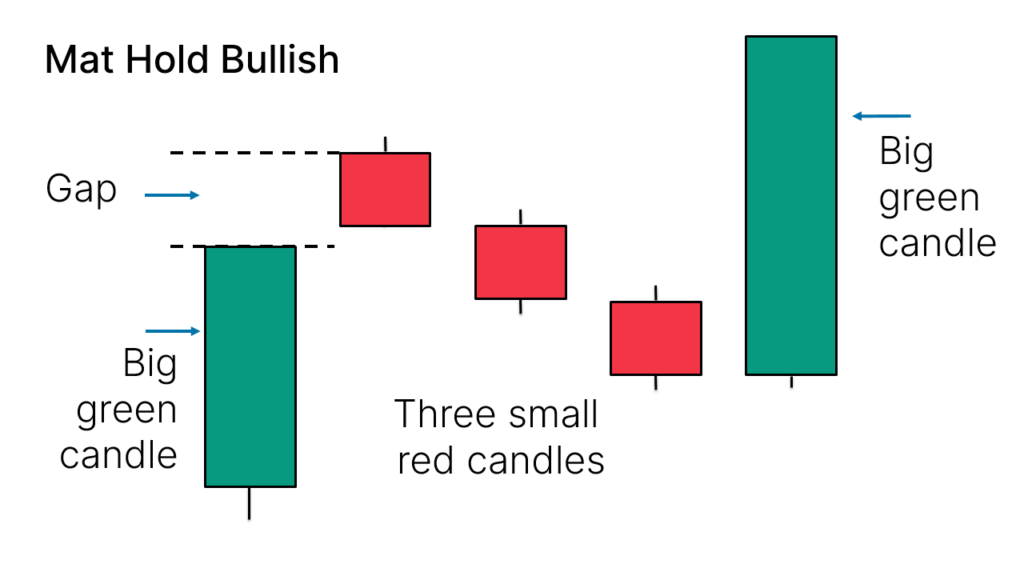
- Success Rate: 78%
- Application: Identifies buying opportunities after a pause in an uptrend, suggesting that bullish forces are likely to continue dominating.
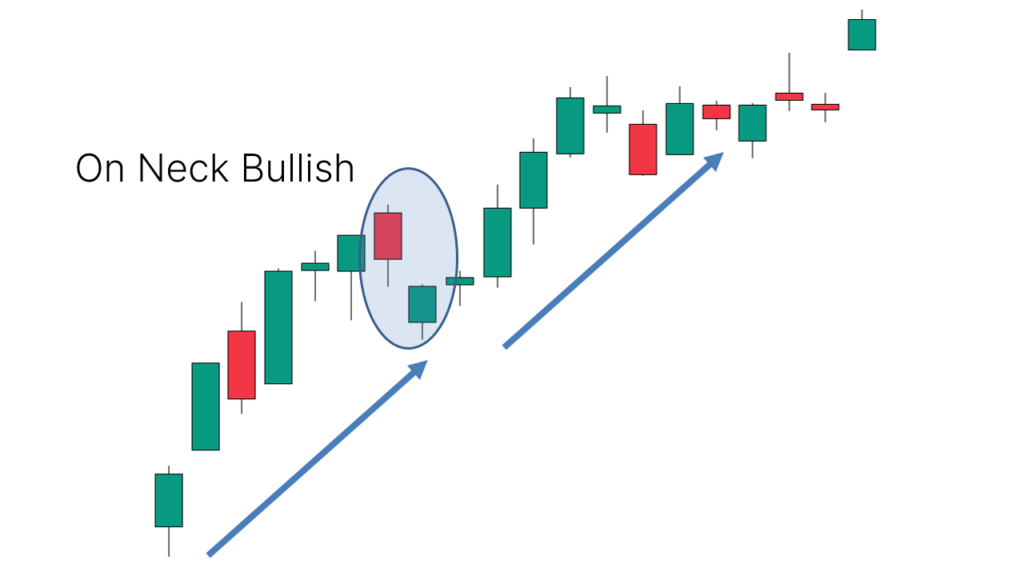
5.On Neck Bullish
- Identification: This pattern consists of two candles. It begins with a bearish candle, followed by a gap and a bullish candle whose closing price is the same as the low of the bearish candle.
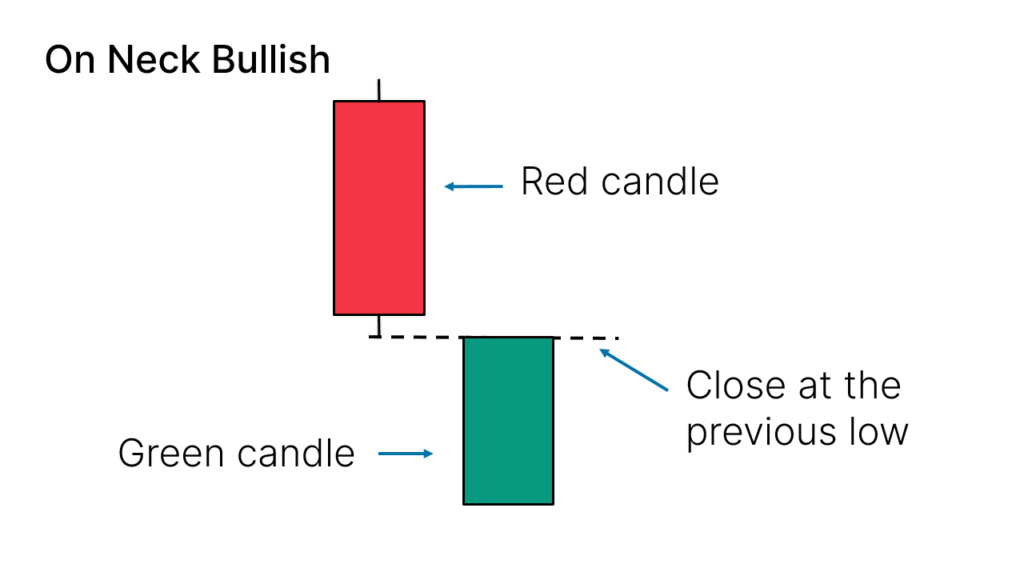
- Application: Suitable for finding buying opportunities after a pause in an uptrend.
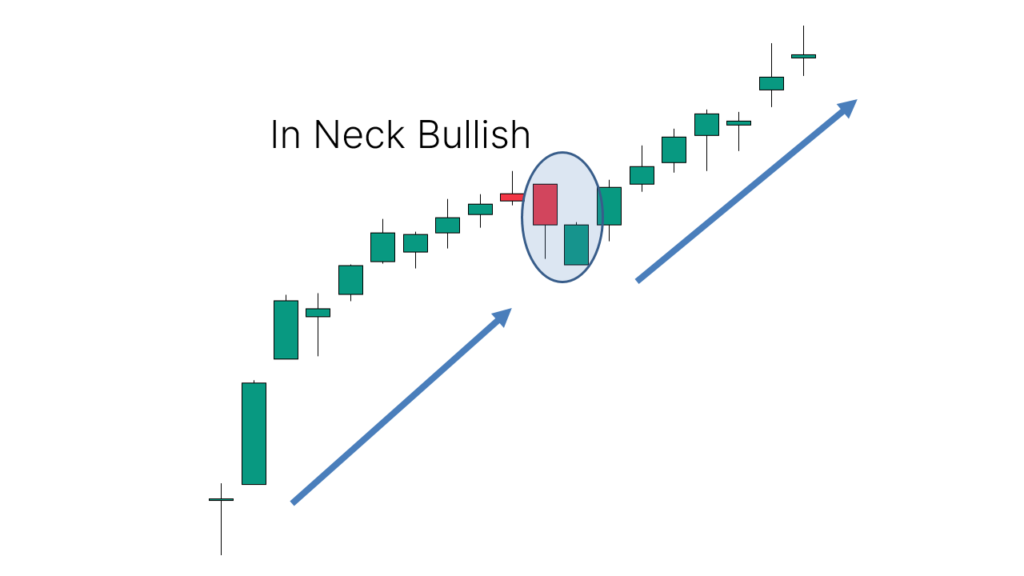
6.In Neck Bullish
- Identification: This pattern consists of two candles. It starts with a bearish candle, followed by a gap and a bullish candle whose closing price is the same as the closing price of the bearish candle.
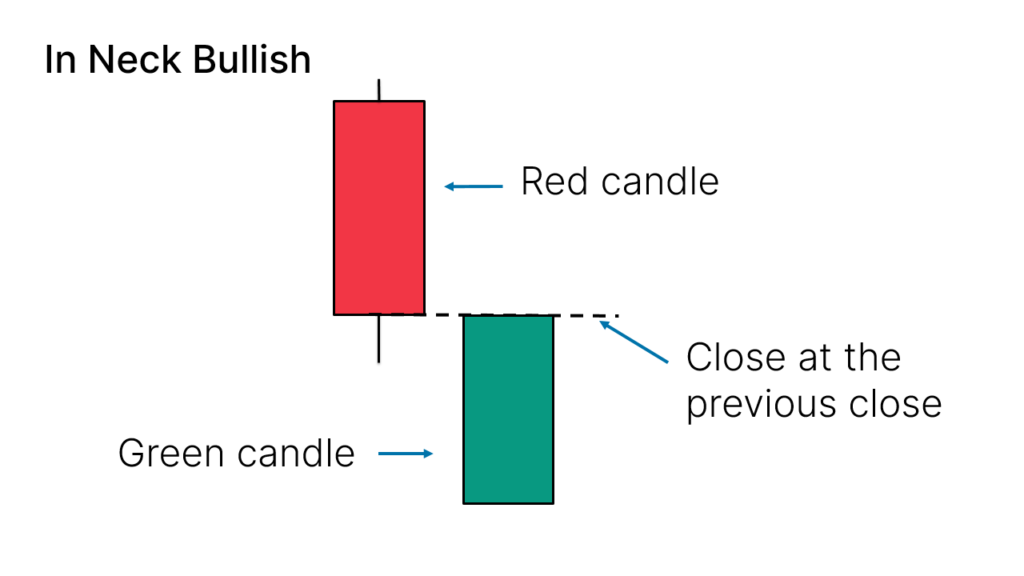
- Application: Suitable for finding buying opportunities after a pause in an uptrend.
Bearish Continuation Candlestick Patterns
Bearish continuation candlestick patterns indicate that selling pressure remains dominant after a price decline. These patterns are generally used to identify short entry opportunities or to add to existing short positions. Below are some common bearish continuation candlestick patterns and their success rates:
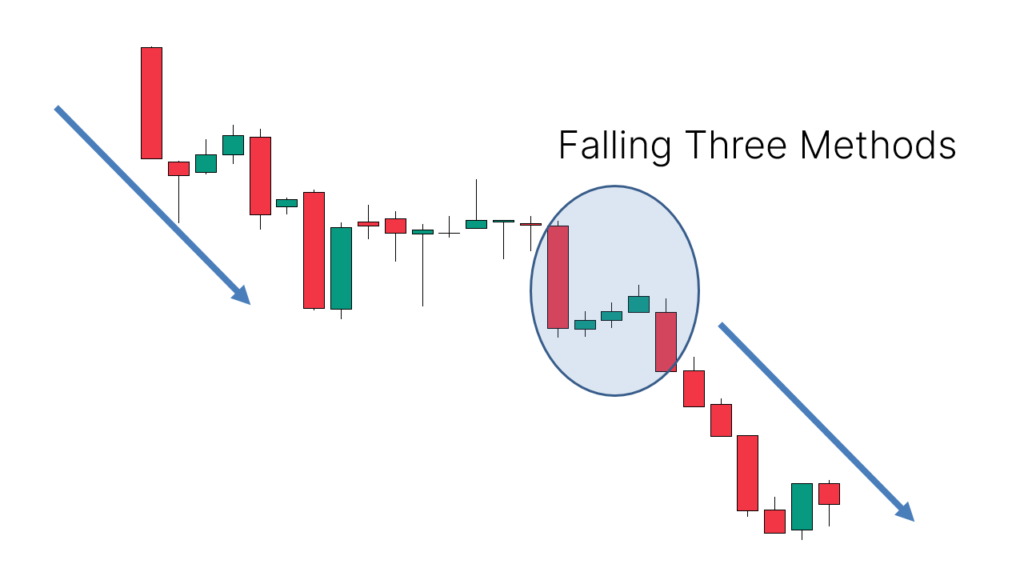
1.Falling Three Methods
- Identification: This pattern consists of five candles. It begins with a large bearish candle, followed by three small bullish candles that do not exceed the high of the first bearish candle. The final candle is a large bearish candle closing lower than the others.
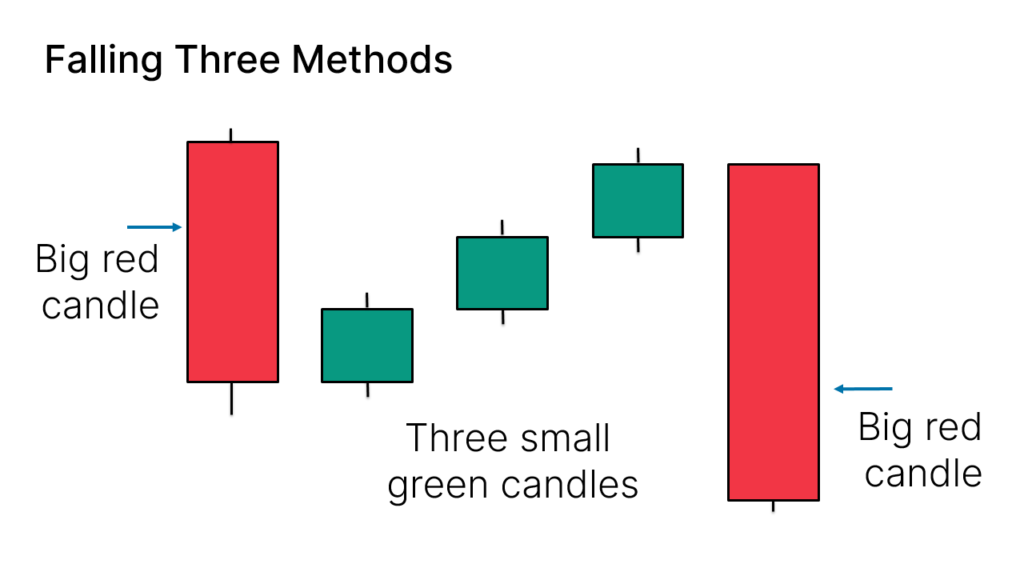
- Success Rate: 71%
- Application: Used to identify short opportunities after a pause in a downtrend, suggesting that selling pressure may continue to dominate the market.
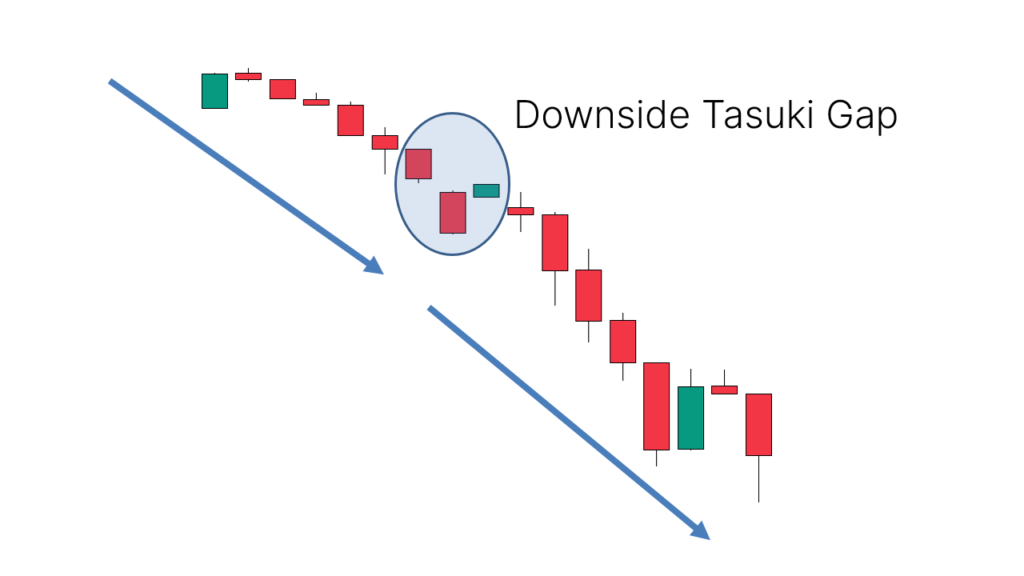
2.Downside Tasuki Gap
- Identification: This pattern consists of three candles. It starts with two consecutive large bearish candles with a gap between them, followed by a small bullish candle closing within the gap.
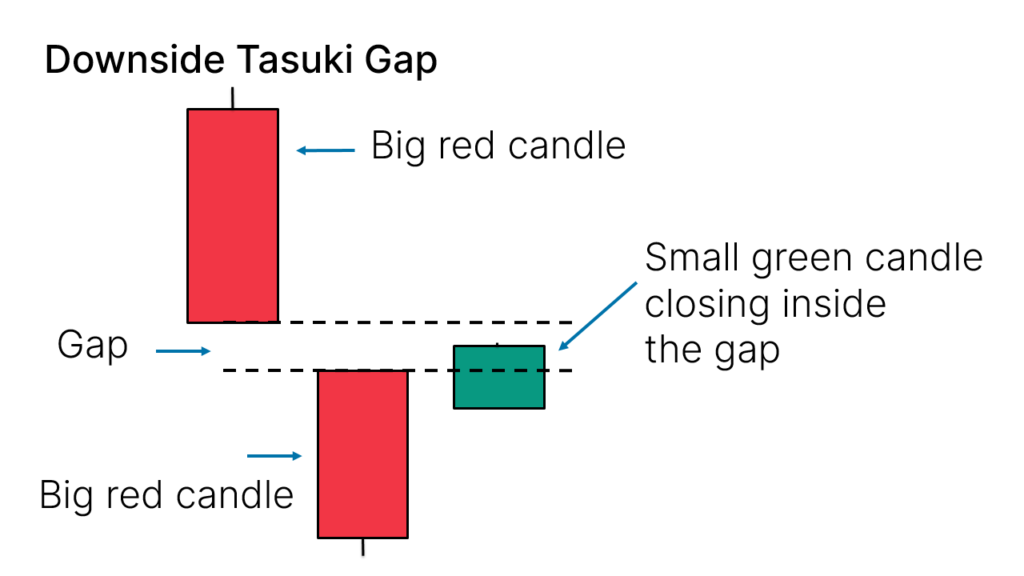
- Success Rate: 54%
- Application: Suitable for identifying short opportunities after a pause in a downtrend, indicating that selling pressure is recovering.
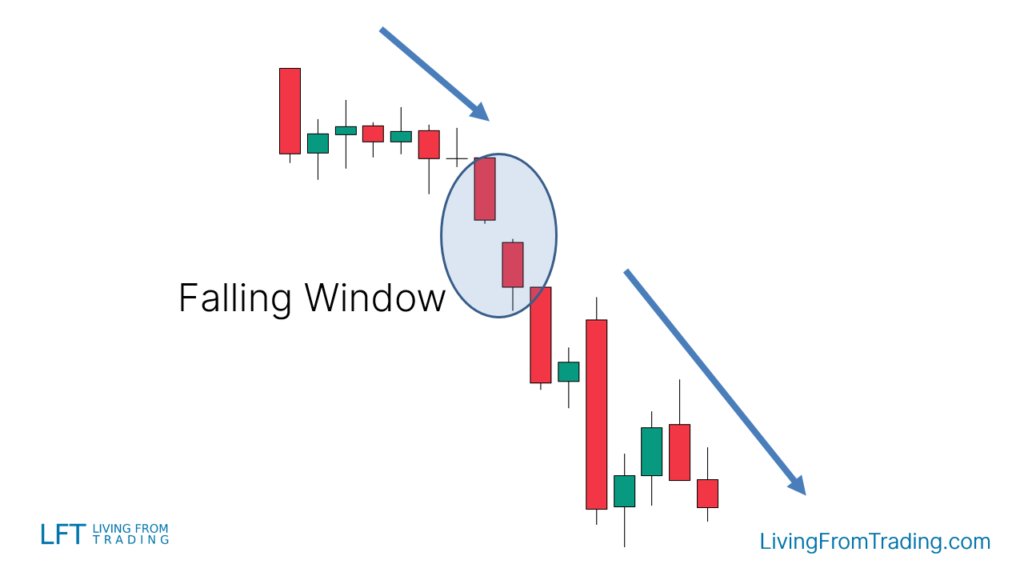
3.Falling Window
- Identification: This pattern consists of two candles. It starts with two consecutive large bearish candles with a gap between them.
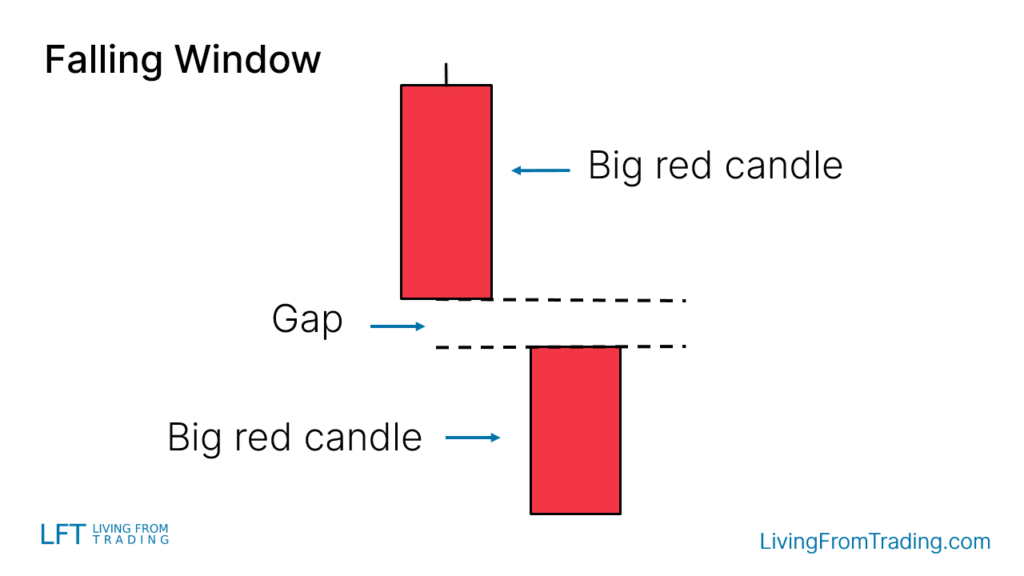
- Success Rate: 73%
- Application: Used to identify short opportunities after a pause in a downtrend, indicating that selling pressure is recovering.
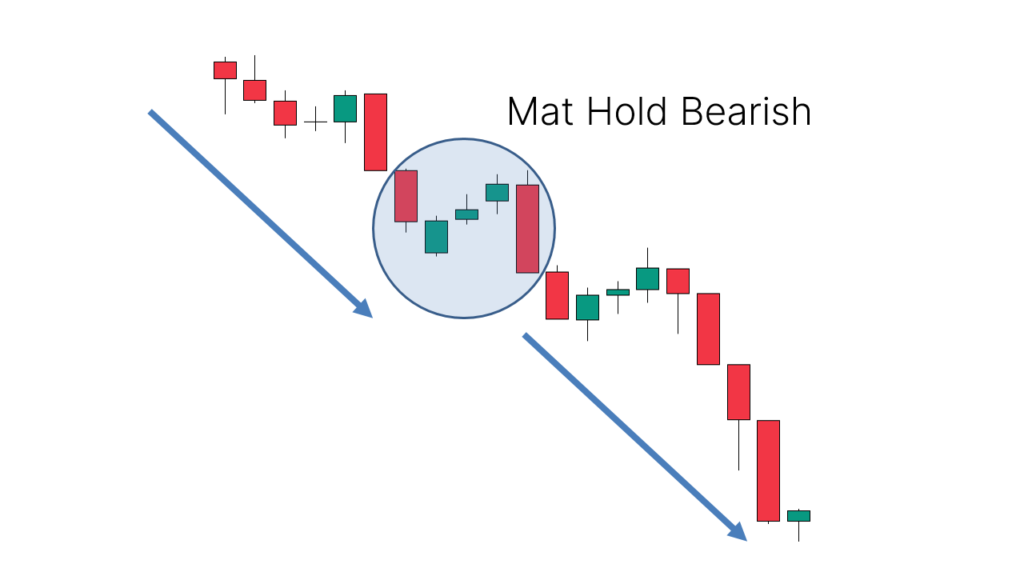
4.Mat Hold Bearish
- Identification: This pattern consists of five candles. It starts with a large bearish candle, followed by a gap and three small bullish candles that do not exceed the high of the first bearish candle. The final candle is a large bearish candle closing lower than the others.
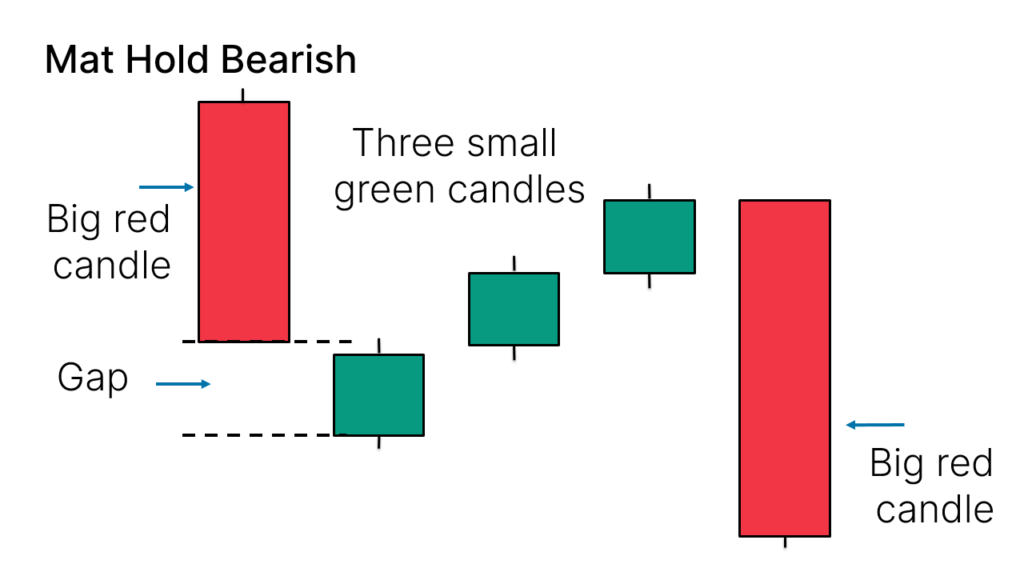
- Application: Identifies short opportunities after a pause in a downtrend, suggesting that selling pressure is likely to continue dominating.
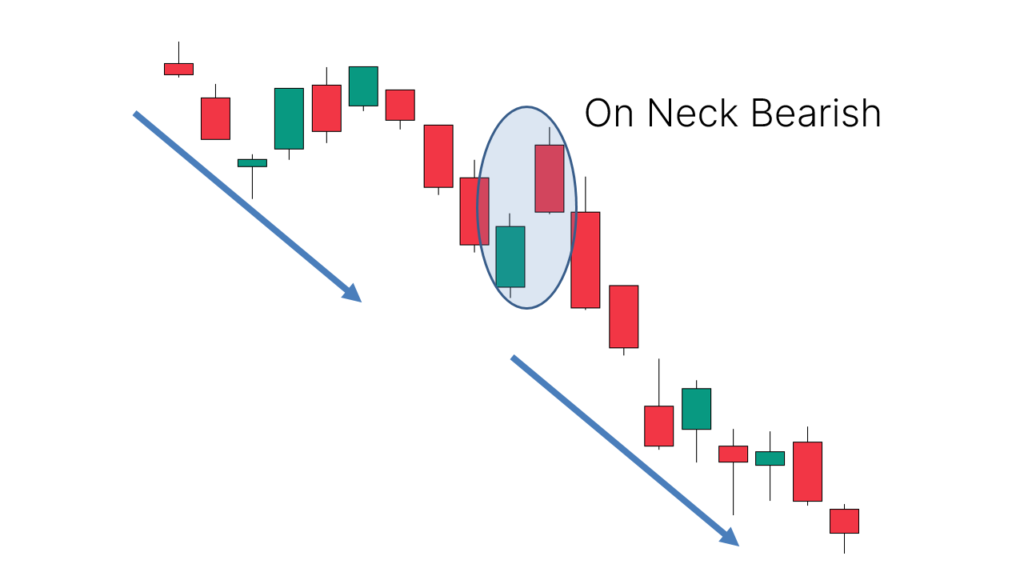
5.On Neck Bearish
- Identification: This pattern consists of two candles. It starts with a bullish candle, followed by a gap and a bearish candle whose closing price is the same as the high of the bullish candle.
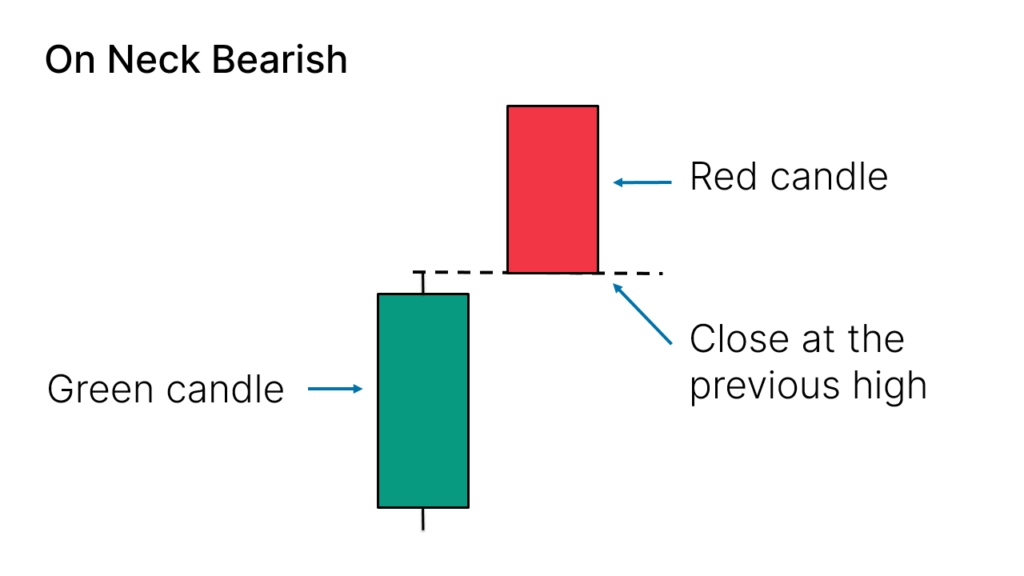
- Application: Suitable for identifying short opportunities after a pause in a downtrend.
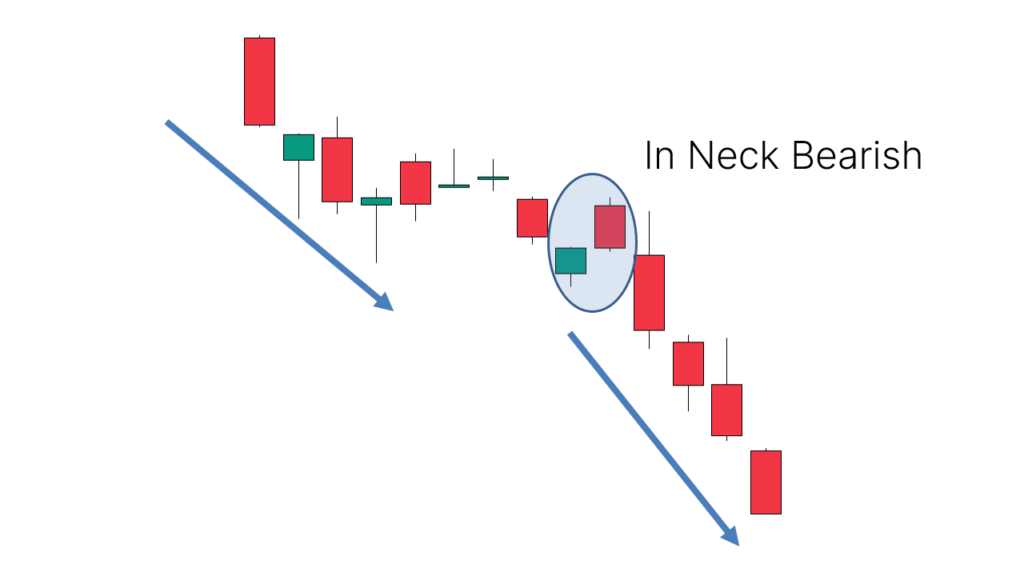
6.In Neck Bearish
- Identification: This pattern consists of two candles. It starts with a bullish candle, followed by a gap and a bearish candle whose closing price is the same as the closing price of the bullish candle.
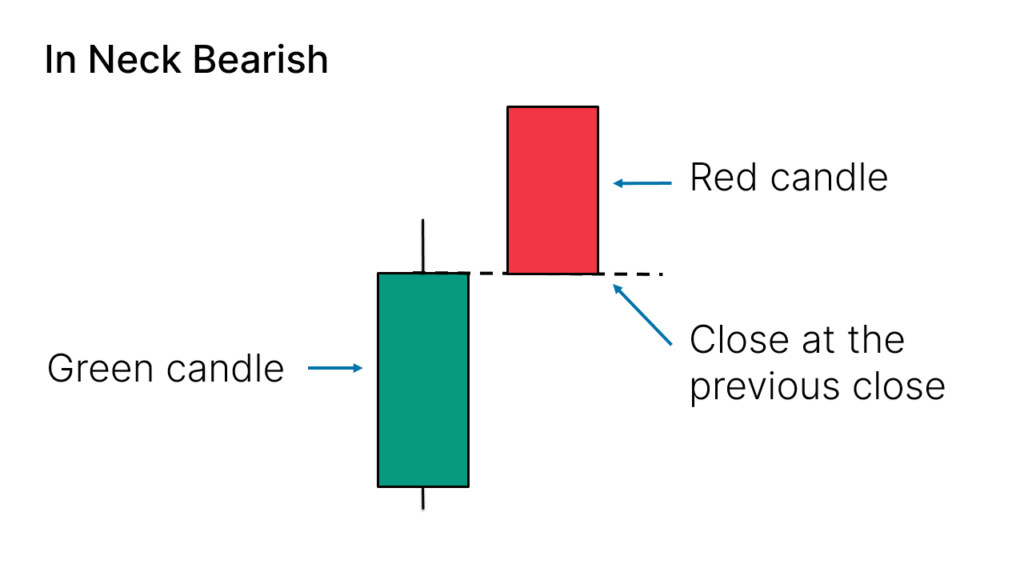
- Application: Suitable for identifying short opportunities after a pause in a downtrend.
Uncertain Candlestick Patterns Analysis
Uncertain candlestick patterns show that the market lacks a clear direction at a given moment. When encountering these patterns, it is advisable to avoid trading until a clear trend direction is shown.
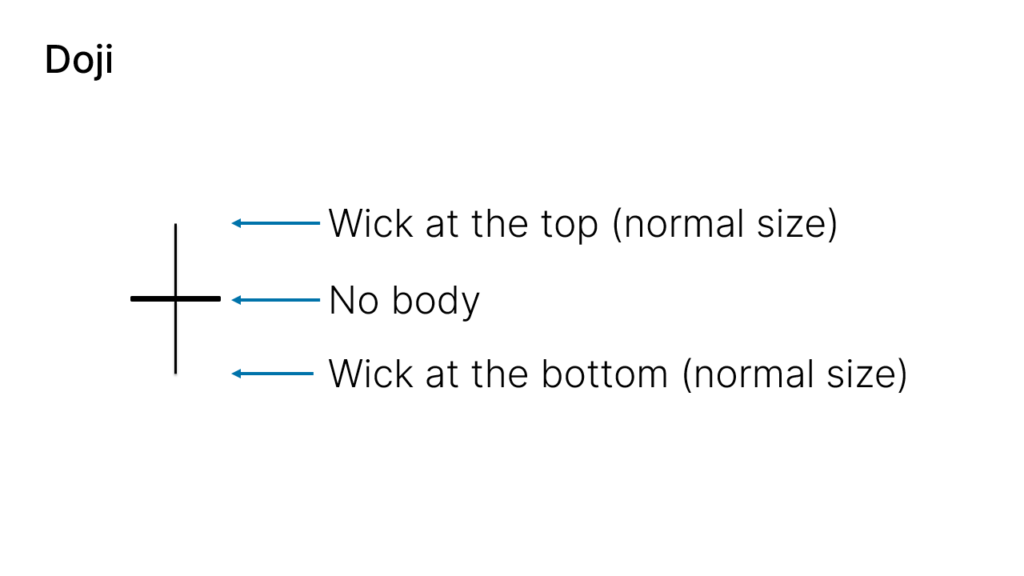
1.Doji
- Identification: A candlestick with a very small or almost nonexistent body, with upper and lower shadows, but the shadows are not very long.
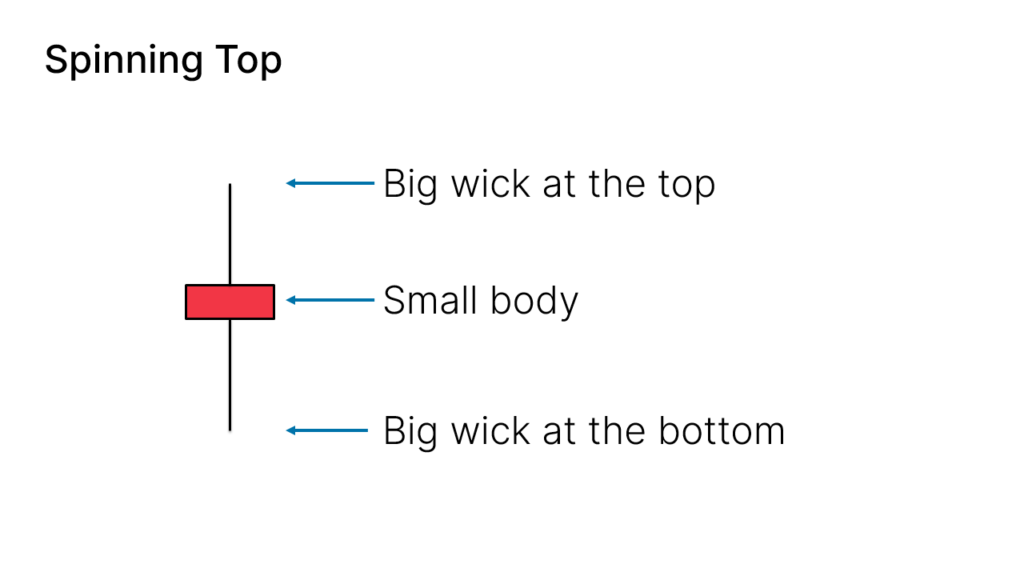
2.Spinning Top
- Identification: A candlestick with a small body and relatively long upper and lower shadows.
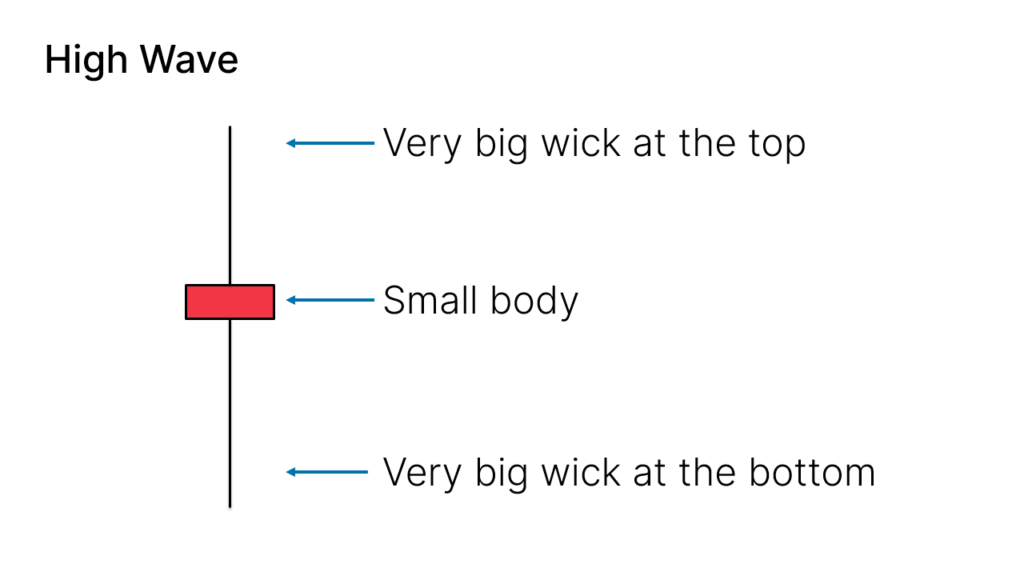
3.High Wave
- Identification: A candlestick with a very small body and exceptionally long upper and lower shadows, distinguishing it from the Spinning Top by the length of the shadows.
These candlestick patterns provide traders with powerful tools to identify market reversal points. By accurately recognizing these patterns, one can effectively time market reversals and improve trading decisions. In actual trading, it is essential to combine these patterns with other technical indicators and market information to develop a more comprehensive trading strategy.
Disclaimer: The views in this article are from the original Creator and do not represent the views or position of Hawk Insight. The content of the article is for reference, communication and learning only, and does not constitute investment advice. If it involves copyright issues, please contact us for deletion.


![[2023 Stock Forecast] Omega Diagnostics Stock](https://hawk-oss.hawkinsight.com/hawk/image/20231129/图片1_2484844696_272.png?w=3840&q=100)