What is Forex Pivot Point?
Forex pivot point is a technical indicator used to identify potential turning points in price movements。It is one of the most commonly used indicators for identifying resistance and support levels in intraday trading。
Forex pivot point is a technical indicator used to determine potential turning points in price movements and is one of the most commonly used indicators to identify resistance and support levels in intraday trading。

What is Forex Pivot Point?
Traders widely use forex pivot points to measure bullish or bearish market sentiment by applying technical analysis。There are many types of Forex pivot points, of which the standard method of calculating pivot points is the most popular。
The Forex pivot point is determined to determine the level of "profit"。Traders mark these points to be aware of points where the market may shift from "bullish" to "bearish"。Therefore, traders in financial markets use these points to determine support and resistance levels。
Types of Pivot Points Used in Forex Trading
Forex traders use many types of pivot points, of which the standard method of calculating pivot points is the most popular。In addition to this, there are other techniques for calculating Forex pivot points, including:
- Standard pivot points, also known as classical pivot points, use specific formulas to determine support and resistance levels。
- Fibonacci pivot points use important Fibonacci levels to determine where support or resistance is located。
- Camarilla pivot points use mathematical formulas to generate potential support and resistance levels。
- Tom DeMark's pivot point focuses on the latest data to identify potential turning points。
- Woody pivot points are calculated based on past price points。
How to Calculate Pivot Points
Each pivot point type is calculated differently。For some, the idea of looking at a trading pivot point formula may seem overly complicated。However, the mathematics behind these formulas is relatively basic。
For example, the standard (lower bound) pivot point is calculated as follows:
Resistance 1 (R1) = (Pivot point x 2) - Low
Resistance 2 (R2) = Pivot point + (High- Lowest)
Pivot Point (PP) = (Highest + Lowest + Closing) / 3
Support 1 (S1) = (pivot point x 2) - high
Support 2 (S2) = Pivot Point - (Highest - Lowest)
Once calculated, forex traders mark these levels on the chart。Day traders tend to use data from the previous trading session to calculate the daily pivot point。
Support and resistance levels
As mentioned above, the pivot point is used to identify the support and resistance levels on the chart。Once calculated, these are marked on the chart to determine where the market may stop or accelerate。
Therefore, pivot points are practical technical tools that can help us mark resistance and support levels。In layman's terms, the resistance level indicates where there will be a surplus of sellers and vice versa。
These two refer to the upper or lower obstacles faced by price movements.。Once price movements hit these levels, we expect some type of reaction。Therefore, we use pivot points to determine the level that may attract price action。
How to Use Pivot Points for Forex Trading
In general, there are two types of traders: traders who seek breakout trades and traders who like breakout trades。Both groups can trade based on pivot points。This versatility and ease of use is what makes pivot points popular。
In the example below, we see the EUR / USD chart。According to the classical formula, we calculate the pivot point from the data of the weekly chart。In the most common range trading method used by intraday traders, we only sell when the currency pair is close to R1。Conversely, when the price action reaches S1, we should consider buying the pair。
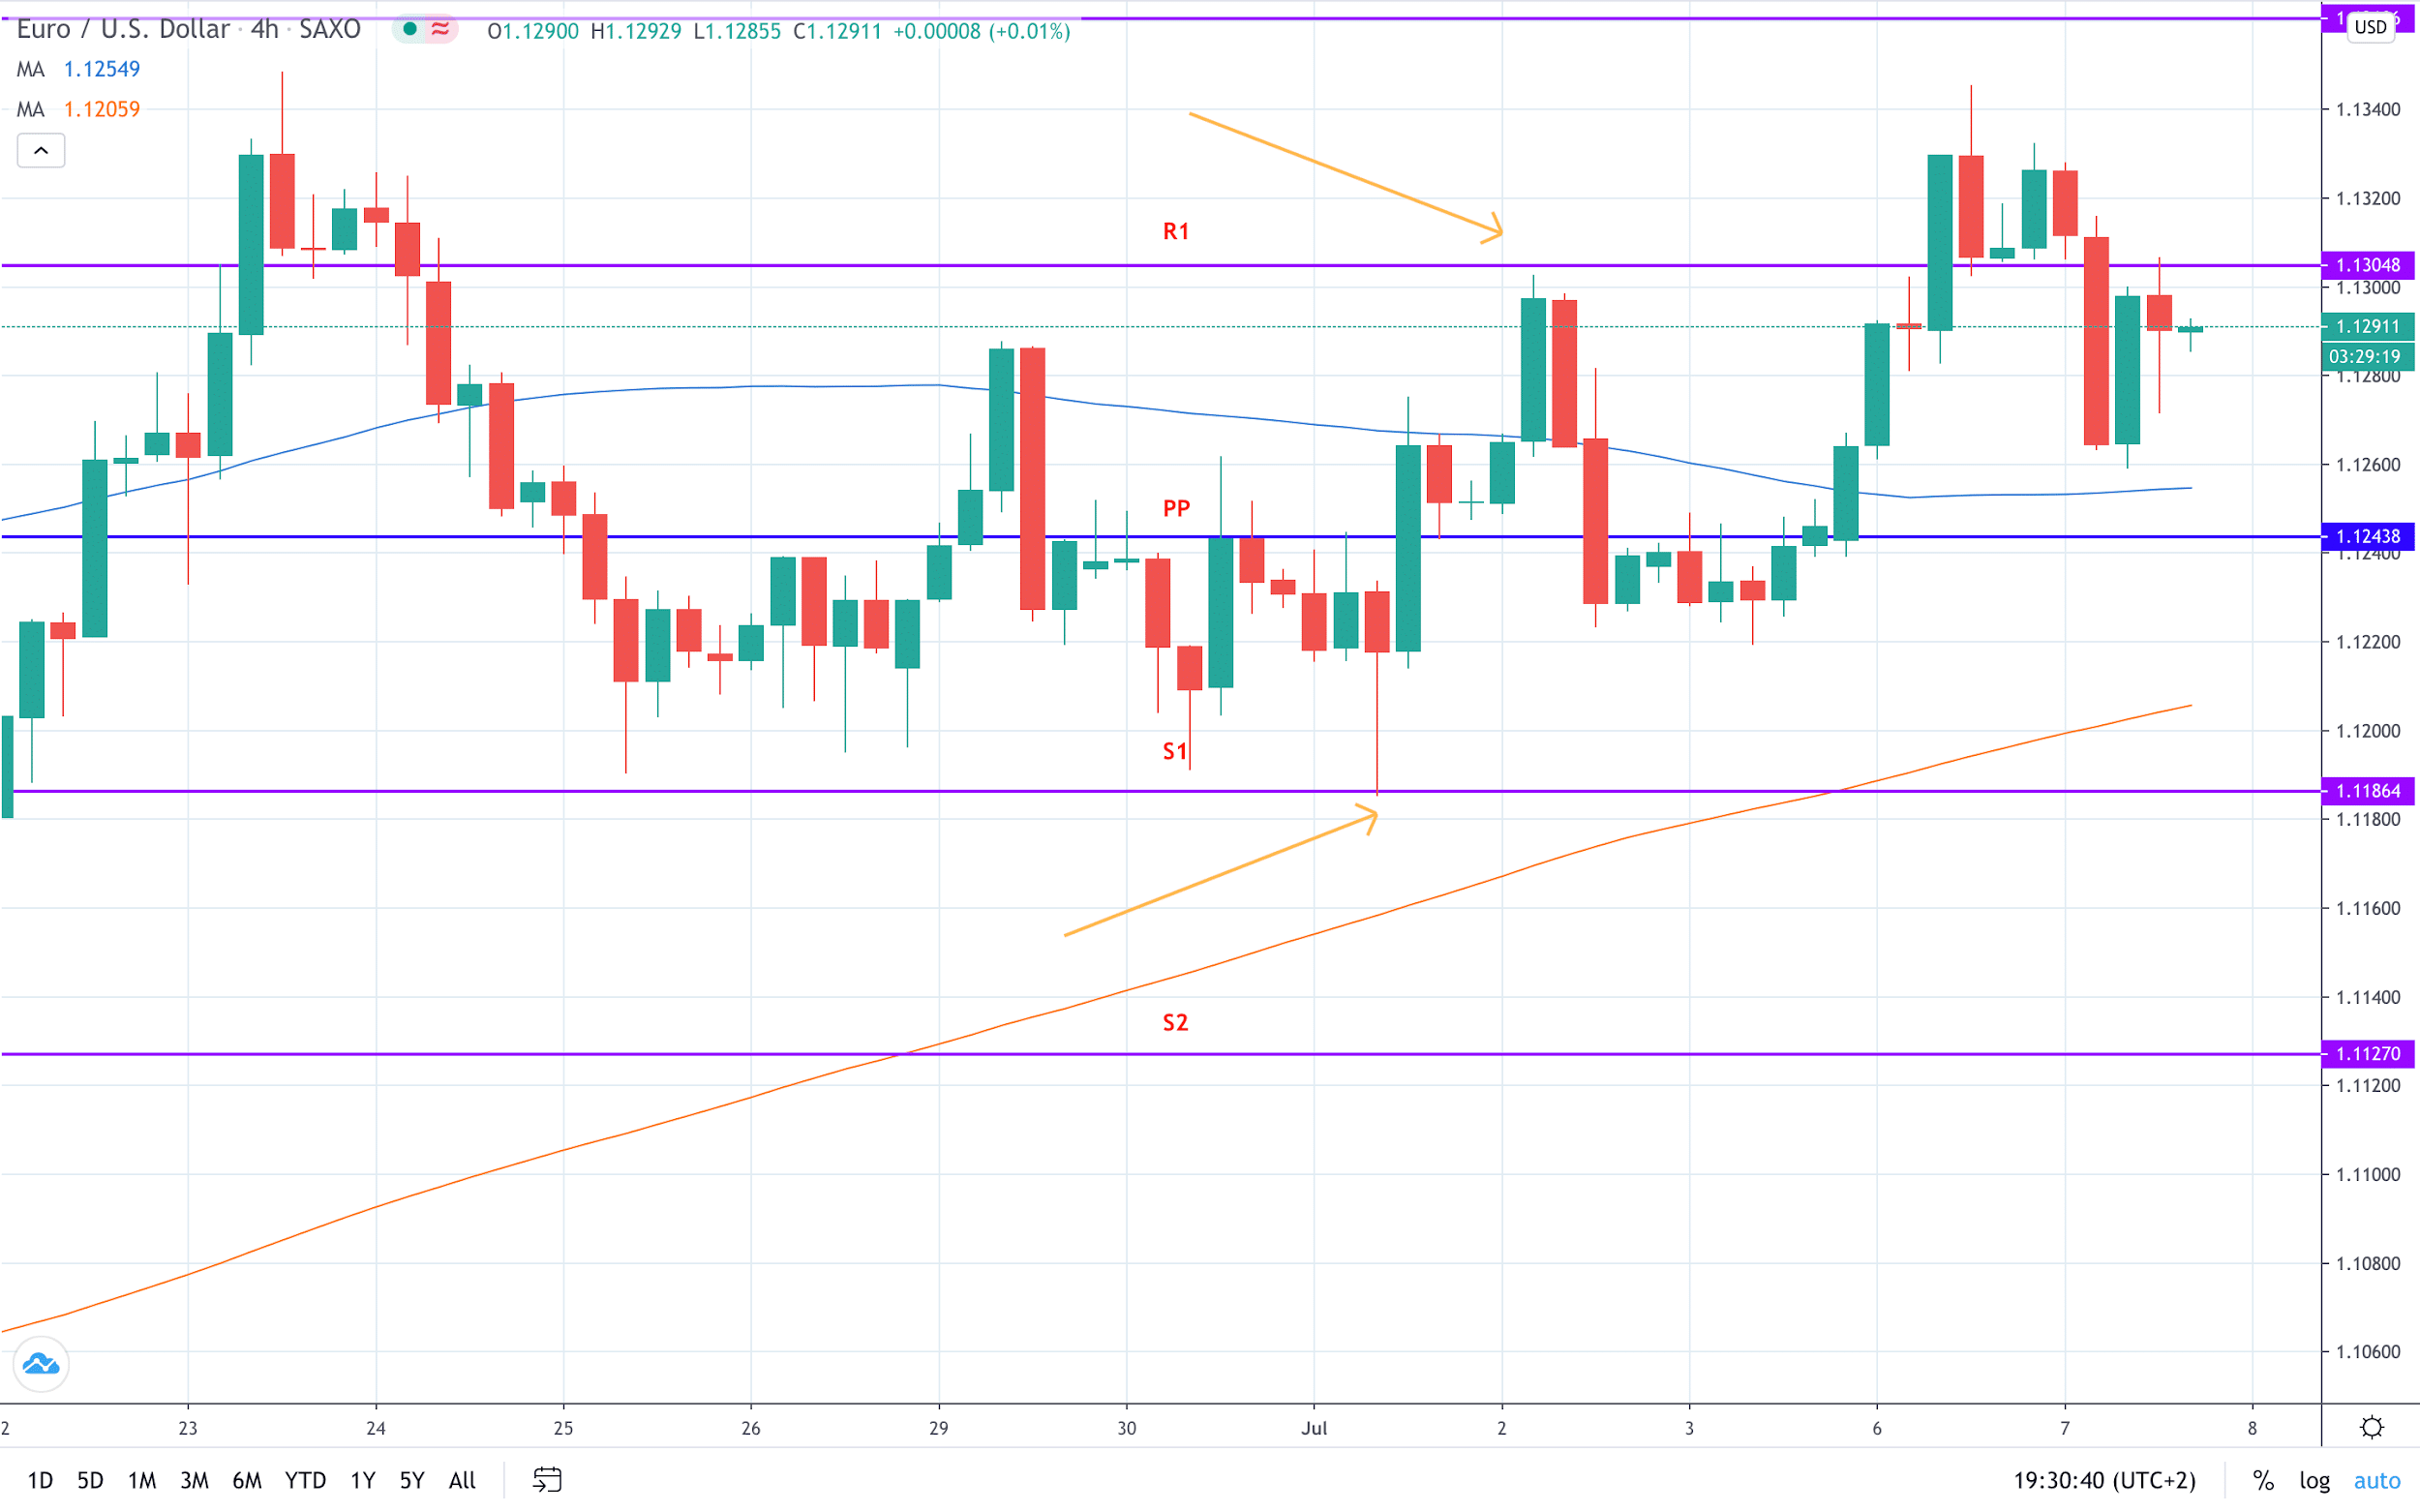
If sell, stop loss should be set above R1; if buy, stop loss should be set below S1。In this way, stop orders are usually closed, so you will avoid high-risk trades。Breaking through these price levels means our trade is void。Believers in range trading will continue to buy and sell until market conditions shift from range trading to trading。
The opposite approach is based on breakthrough。Using the same example, we see that EUR / USD breaks through R1 after fluctuating between S1 and R1。Breakout traders recommend buying when breakout R1 and below S1。This way, you've actually decided to adopt a "trend-following" strategy。
Pivot Point Forex Trading Strategies
In addition to breakout and range trading, traders use other pivot point trading strategies。Here we will share two basic pivot point trading strategies to further enhance your forex trading capabilities。
Trading Pivot Points with MACD
Moving Average Convergence / Divergence (MACD) is a popular trading indicator that measures the strength, direction, momentum and duration of a trend in a market.。
We use the same example to demonstrate how to combine pivot points and MACD。At the bottom of the page, you will see a separate window for the MACD, with two lines - the MACD (blue line) and the signal line (yellow line) - interacting。
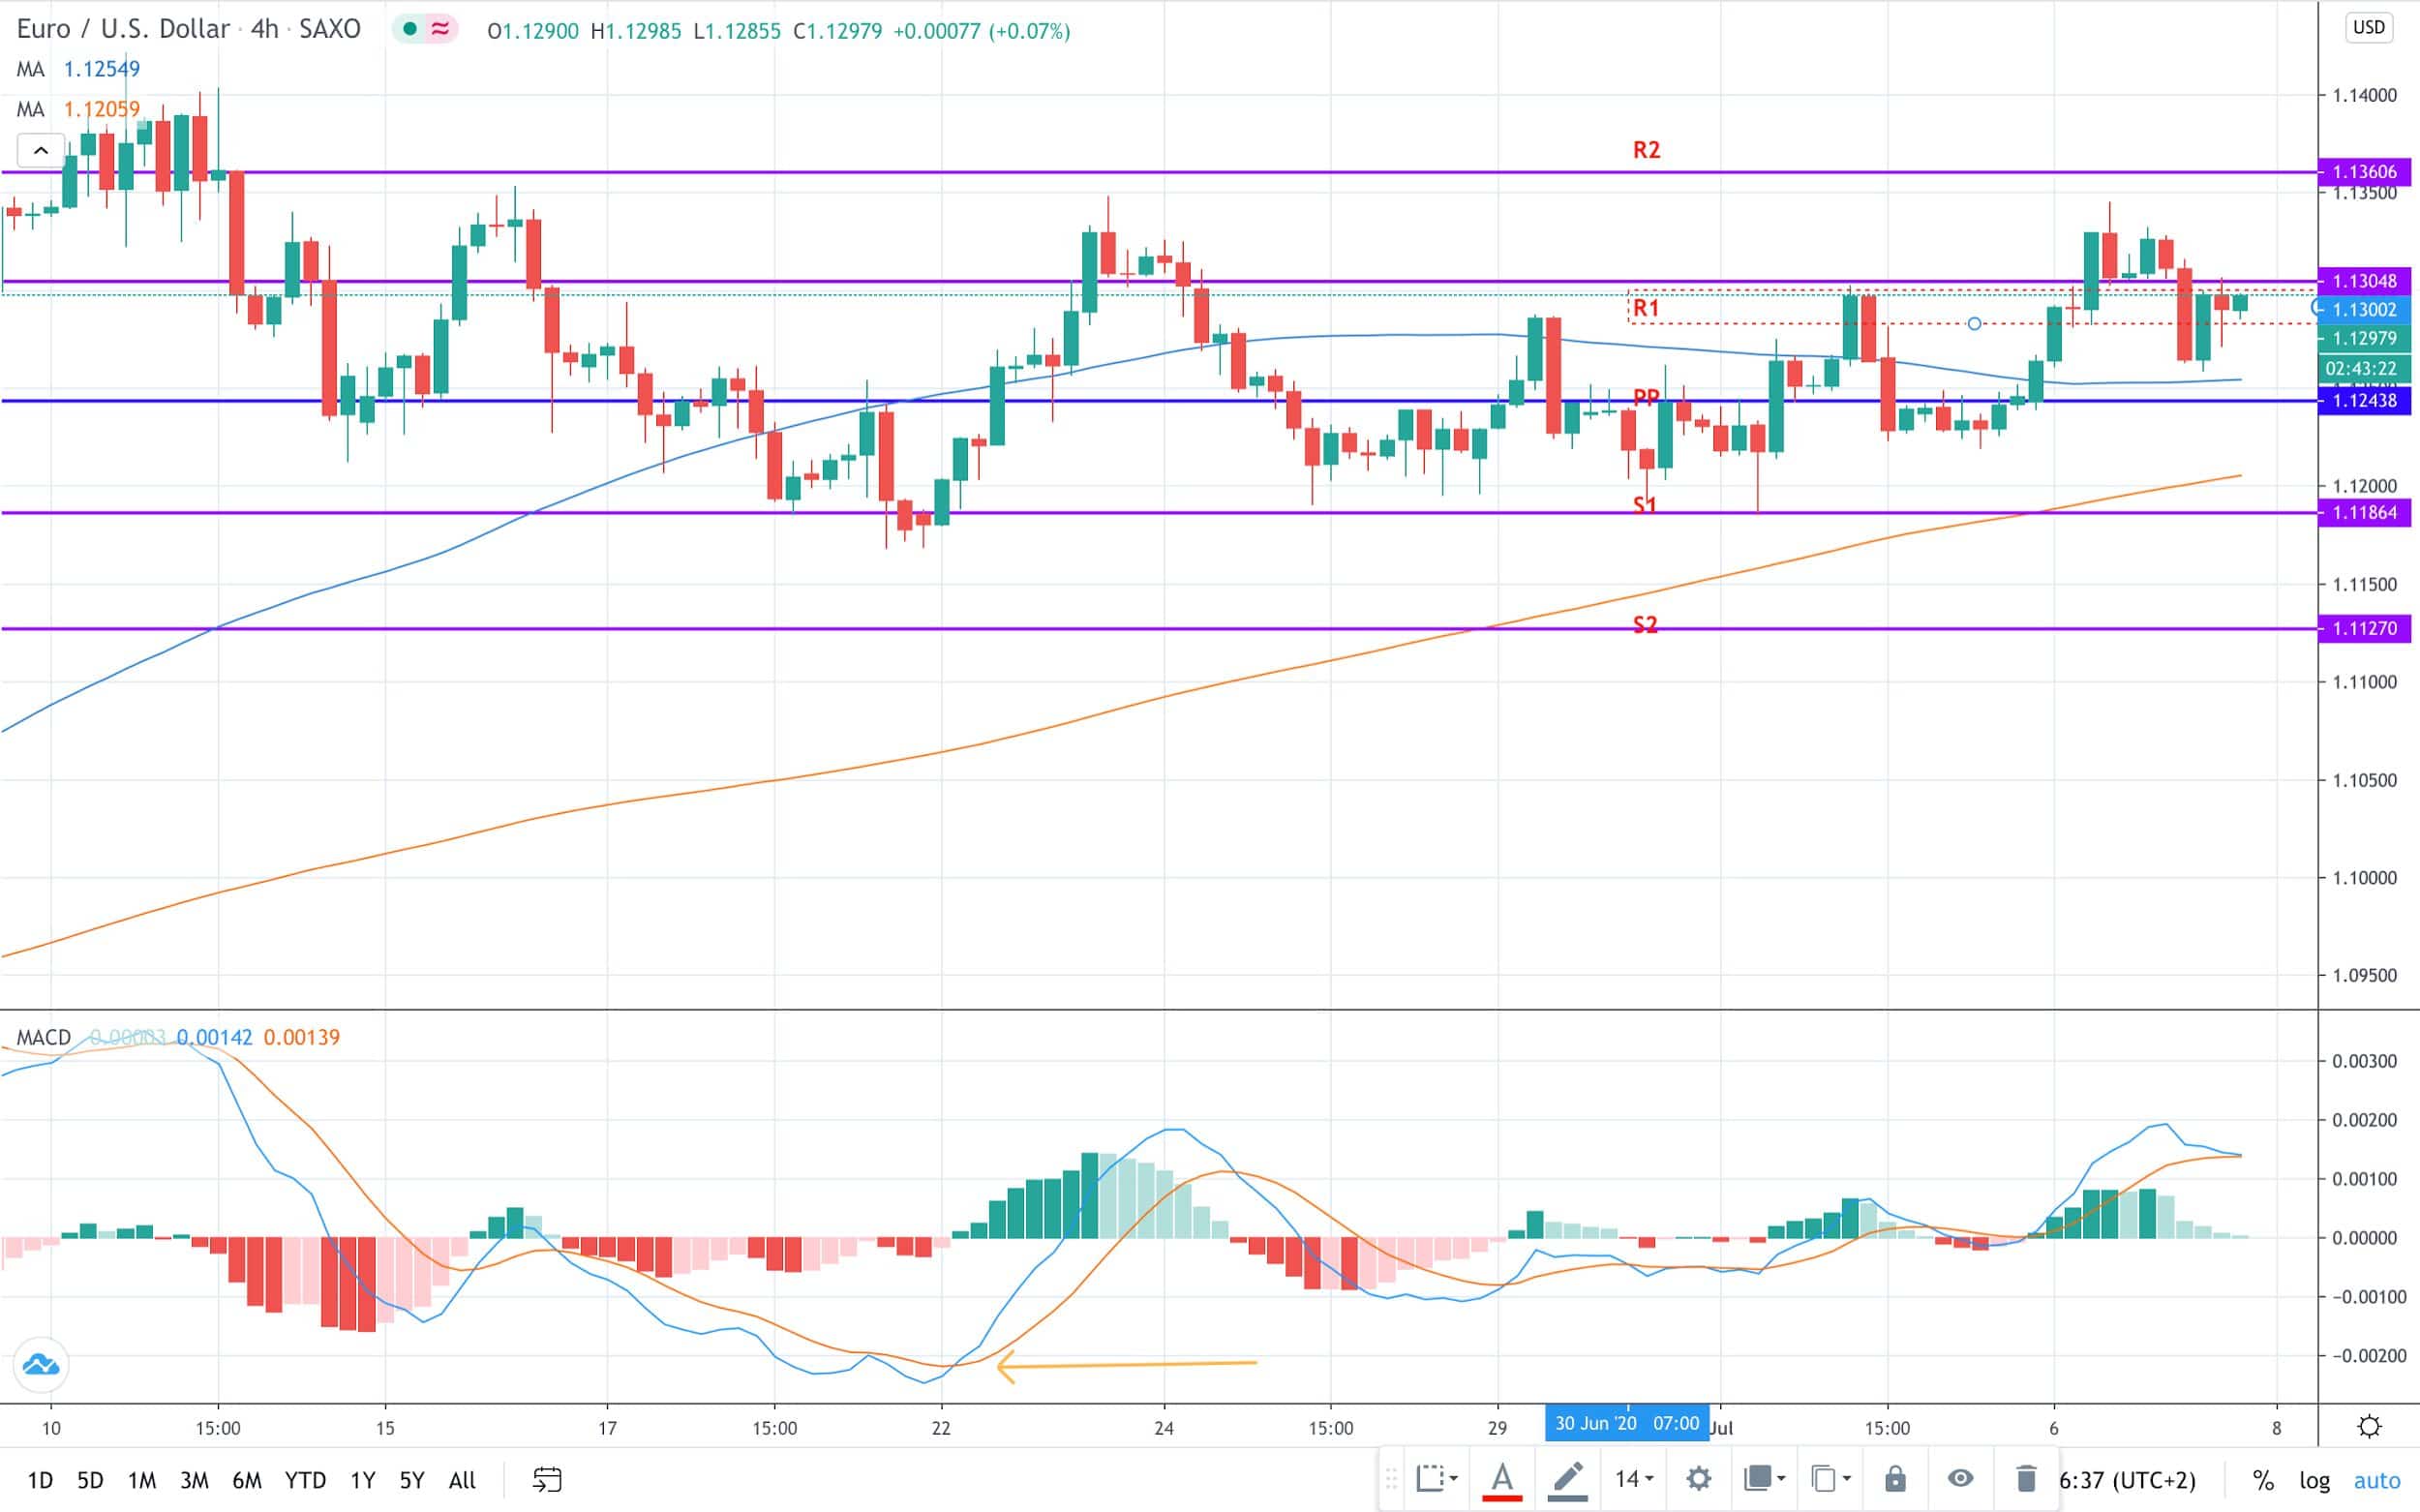
Once the short-term line (MACD) moves above the slower line (signal), a buy signal is issued。This signal is then cross-checked with the price action to verify that the price is close to the pivot point support level。
The yellow arrow at the bottom shows a cross consistent with the price action trade on S1。A long position should be established and the stop loss set below S1。Setting up a profit-taking order depends on your R: R preference。In general, the proposal will go back to PP as a target。
Use the RSI Deviation Trading Pivot Point
The Relative Strength Index (RSI) is arguably the most commonly used momentum indicator, in addition to generating divergence signals used to generate trading ideas。
In the example shown in the figure, we note that the RSI is diverging, meaning that the price is falling, but the RSI is higher。Positive divergence generates a buy signal as price action is expected to catch up with RSI。
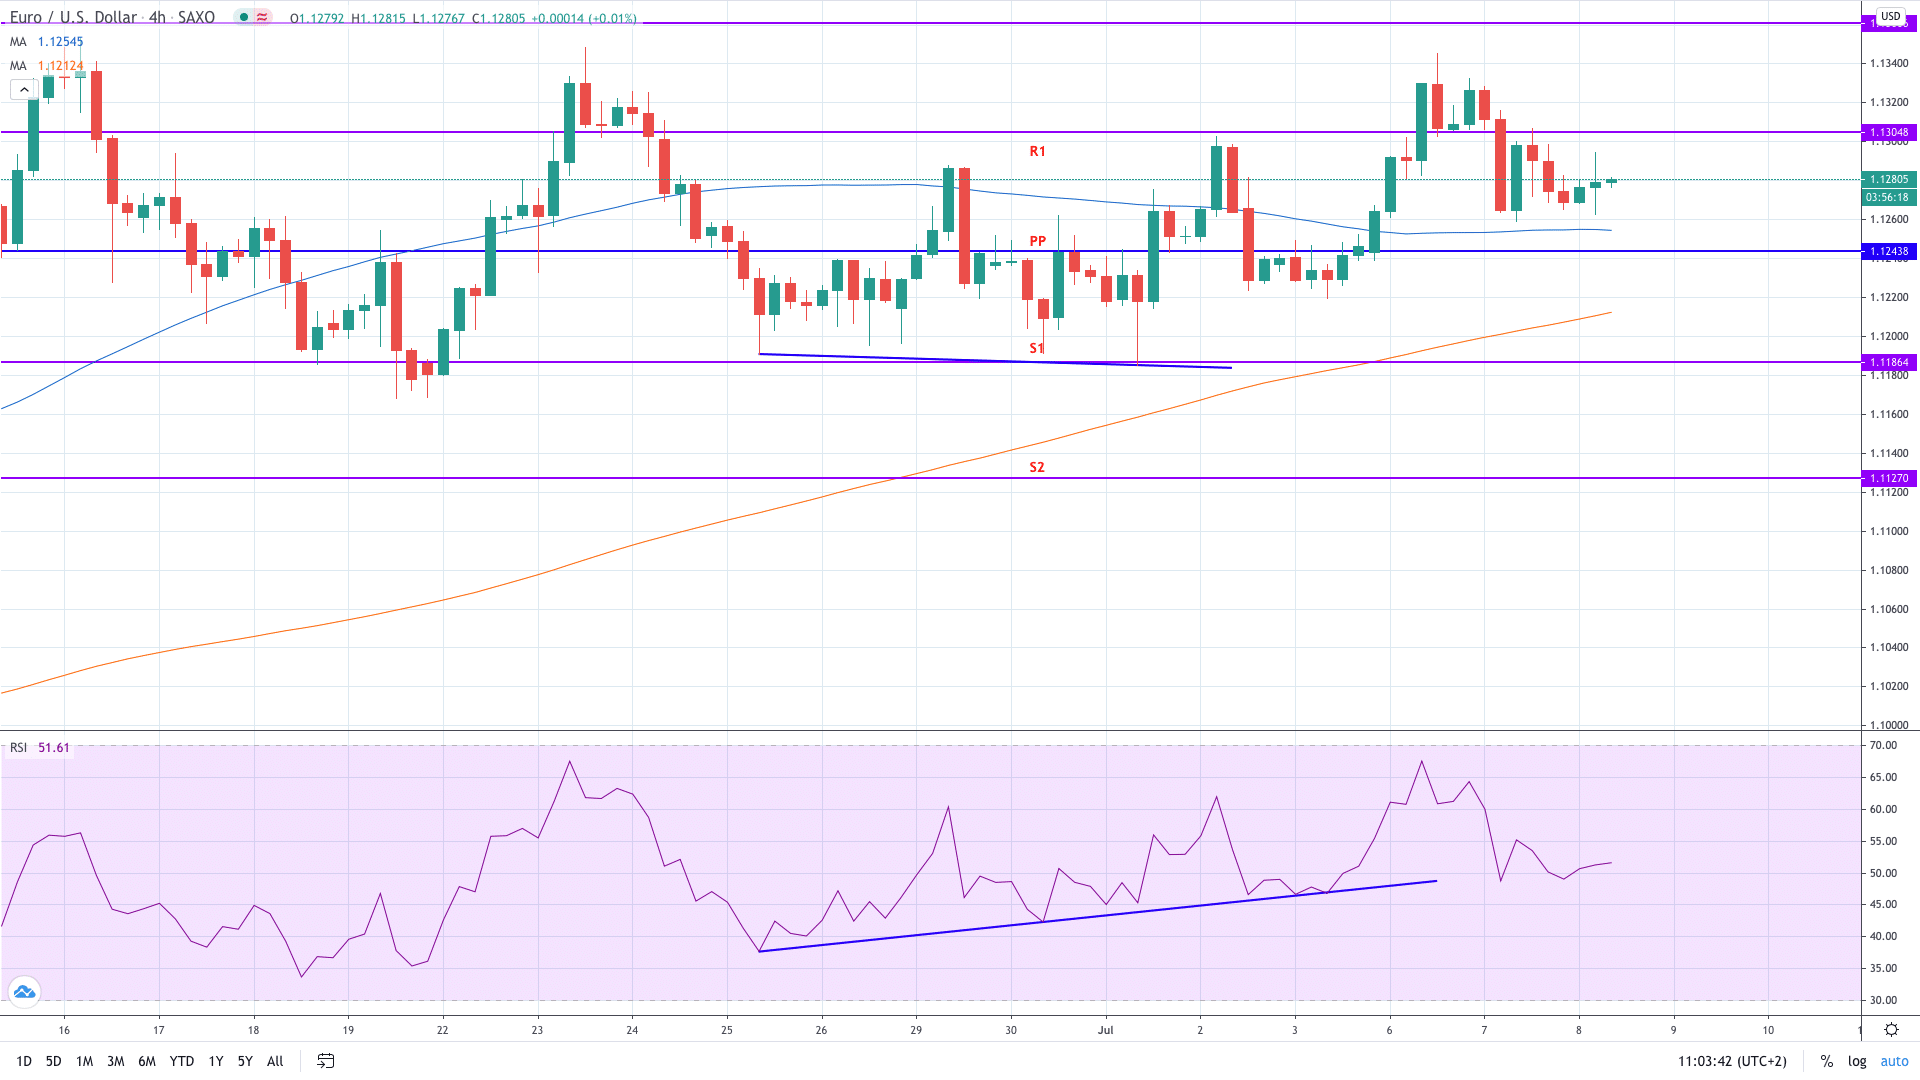
Similar to the MACD trading strategy, the positive divergence occurs near S1。We therefore hold a long EUR / USD position with the aim of returning to the PP。More aggressive trading styles may also target R1。
Conclusion
- Forex Pivot Points are a technical indicator used to identify potential turning points in price action.
- There are several types of forex pivot points, with the standard method of calculating pivot points being the most popular.
- Traders often use pivot points to trade ranges and breakout markets.
- Pivot points are considered a valuable tool for trading different financial instruments.
- Using MACD and RSI to trade pivot points is very profitable.
·Original
Disclaimer: The views in this article are from the original Creator and do not represent the views or position of Hawk Insight. The content of the article is for reference, communication and learning only, and does not constitute investment advice. If it involves copyright issues, please contact us for deletion.