Dogecoin Drops 30% from Yearly Highs, Risks Falling Below $0.20
Dogecoin price tumbles 30% from its yearly peak as bearish patterns signal potential declines below $0.20.
- Dogecoin has dropped over 30% from its yearly high of $0.48, signaling heightened bearish sentiment and risk of further decline.
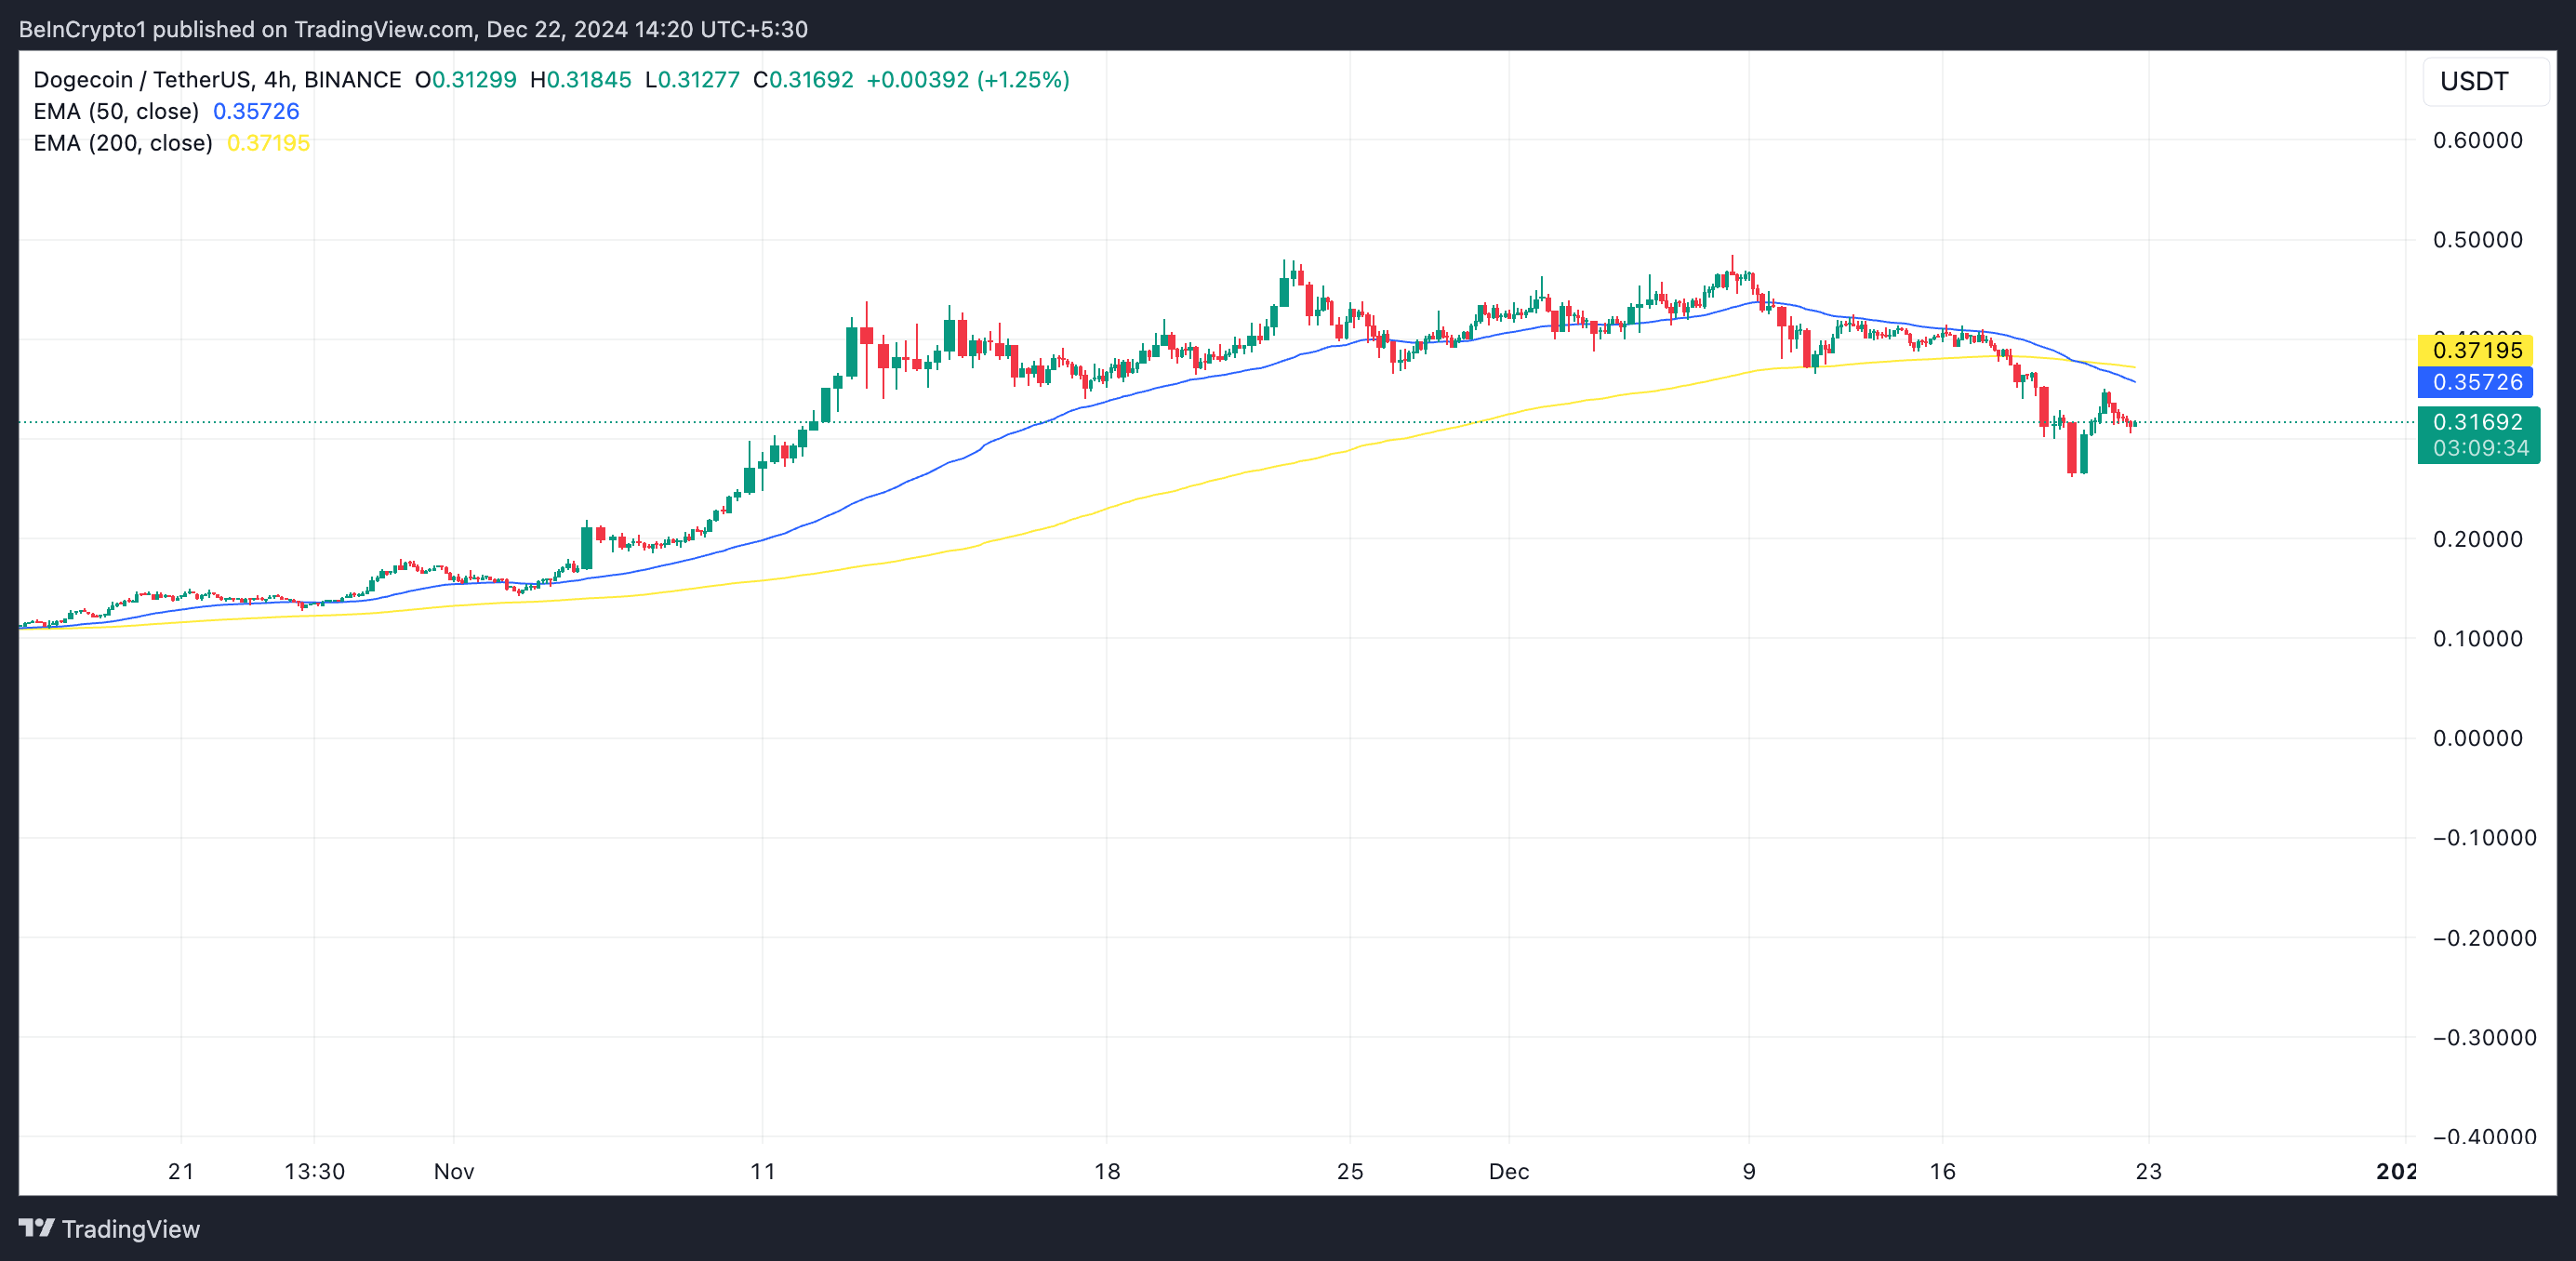
- A "Death Cross" on the daily chart signals a bearish trend, with the 50-day MA crossing below the 200-day MA on December 18.
- DOGE faces key support at $0.28, and if bearish momentum persists and support levels fail, it risks slipping below $0.20.

Dogecoin (DOGE) price has dropped over 30% from its yearly high of $0.48 earlier this month. This decline is linked to multiple bearish signals, increasing the likelihood of further price decreases.
As the year draws to a close and bearish pressure mounts, technical indicators point to a further decline in DOGE’s price, possibly slipping below $0.20. Here is why.
Dogecoin’s Bearish Patterns Put It at Risk
A “Death Cross” pattern has been formed on the DOGE/USD one-day chart. This is a bearish pattern that is formed when an asset’s short-term moving average (often the 50-day moving average) crosses below its long-term moving average (commonly the 200-day moving average), suggesting a shift in market sentiment from positive to negative.

Readings from the DOGE/USD chart showed that DOGE’s 50-day MA crossed below its 200-day MA on December 18, and the meme coin’s price has since plummeted by 20%. This crossover is a bearish signal, suggesting a weakening trend, with recent price declines outweighing long-term price gains.
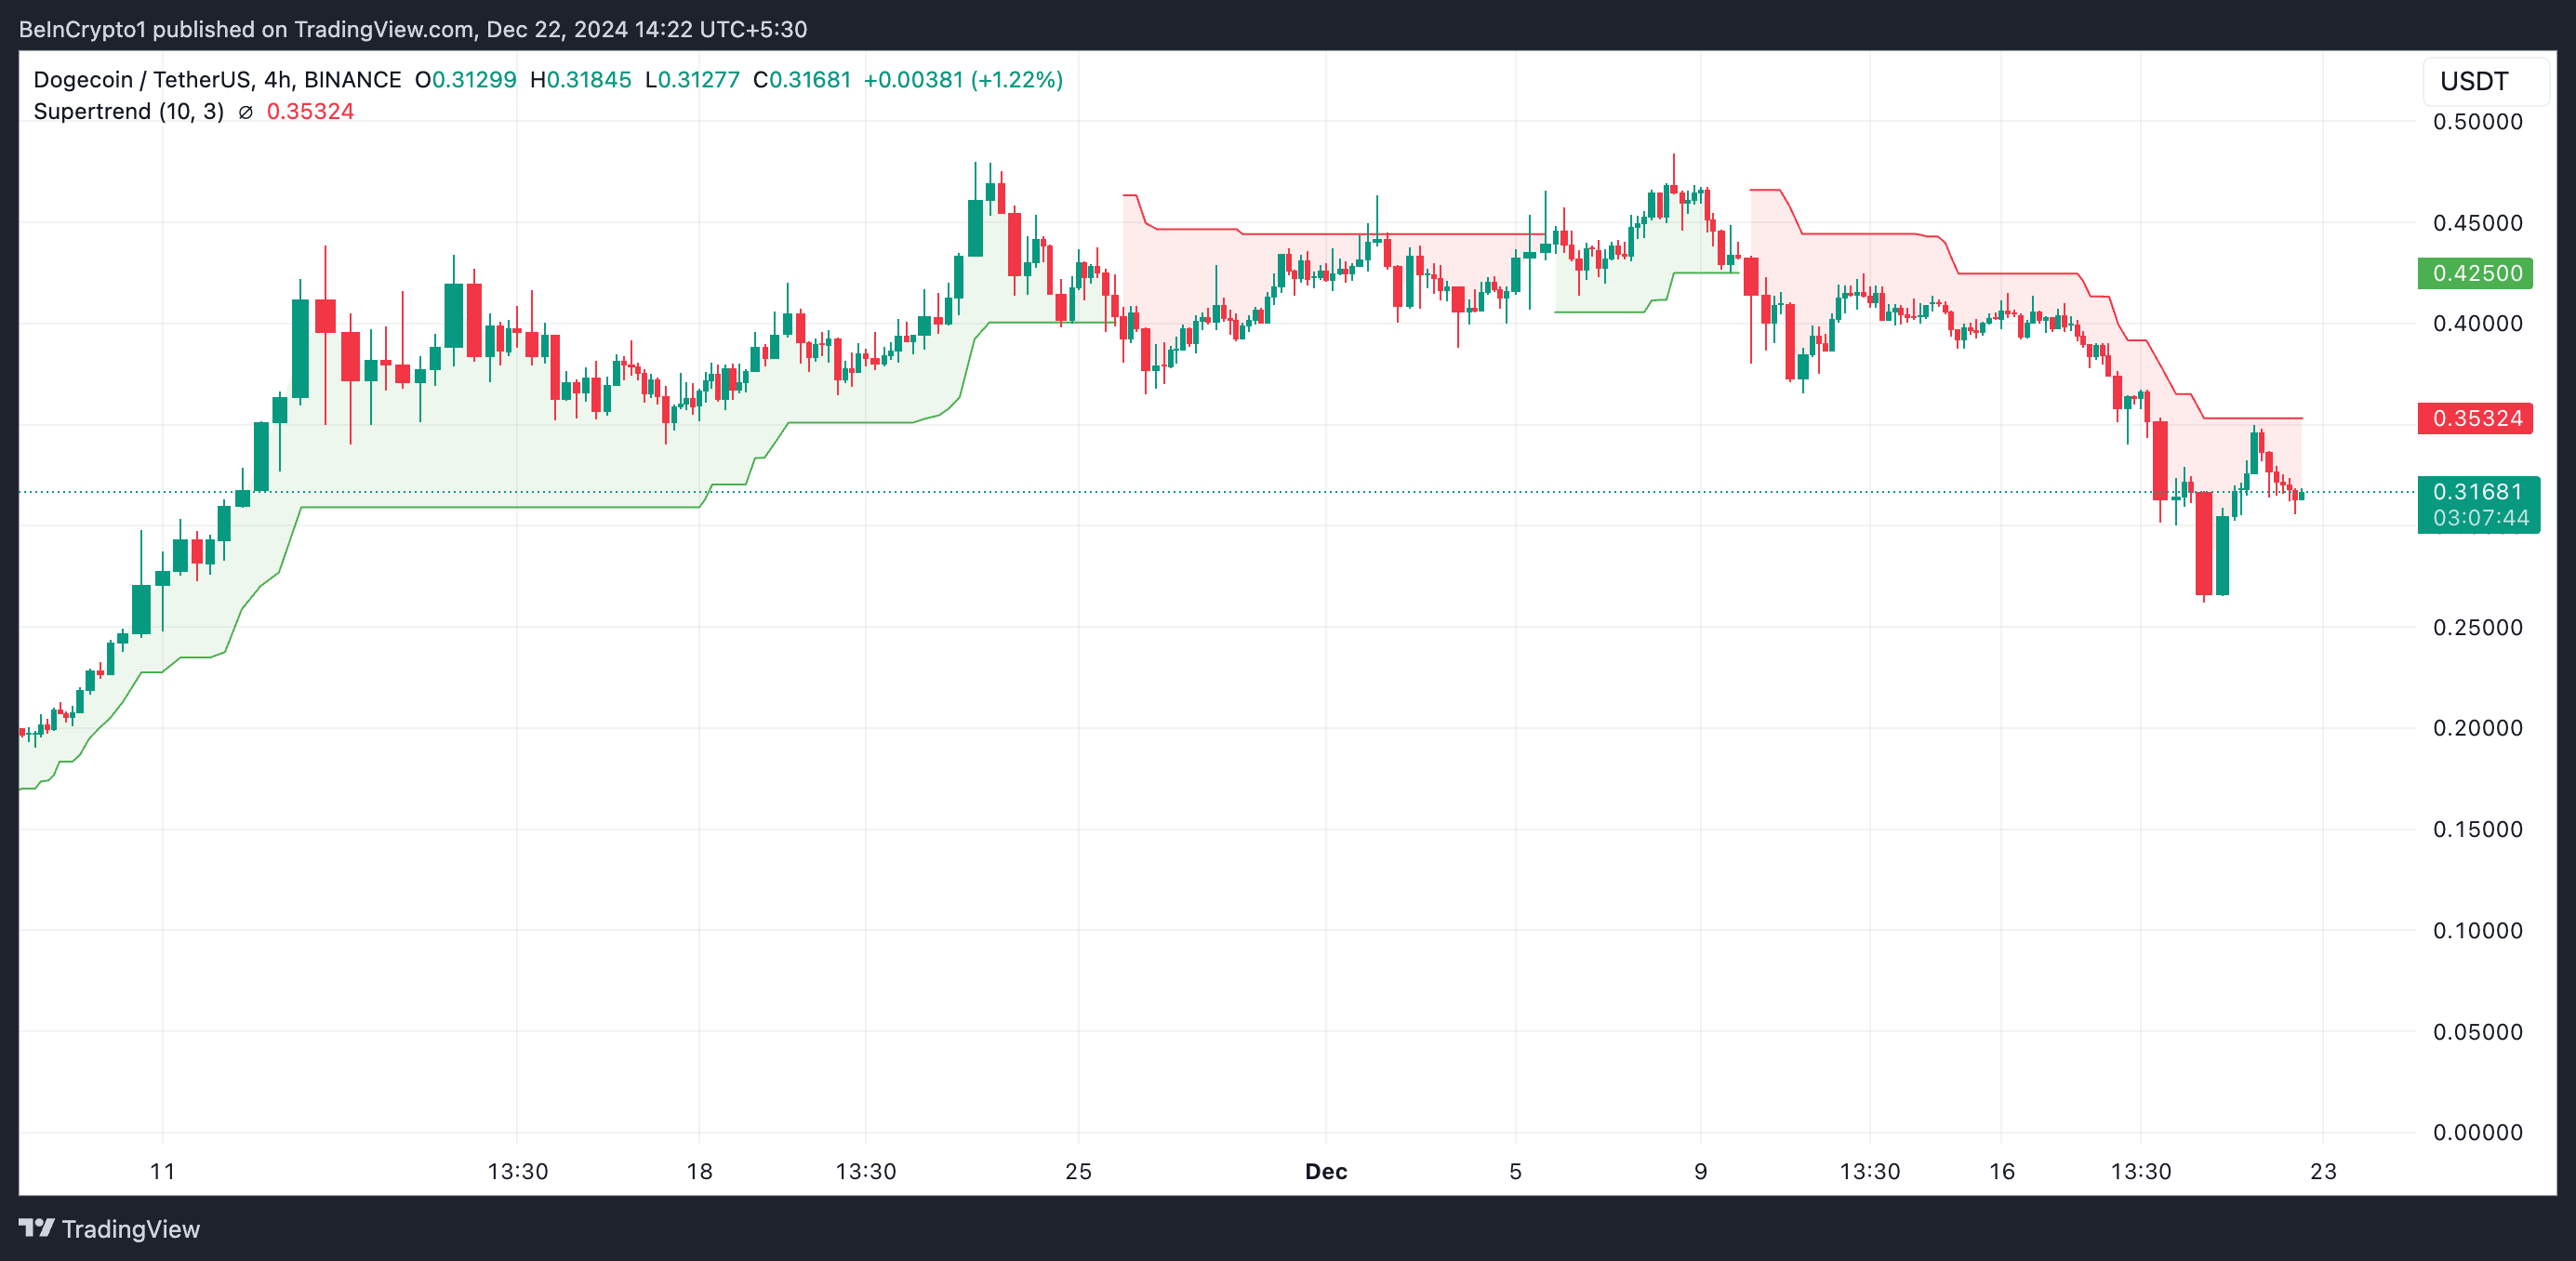
Moreover, the bearish readings from DOGE’s Super Trend Indicator confirm the possibility of further downsides. As of this writing, DOGE’s price rests below the red line of this indicator.

The Super Trend indicator tracks the overall direction and strength of a trend in asset prices. It appears as a line on the price chart that changes color to reflect the trend direction: red for a downtrend and green for an uptrend. When an asset’s price appears below the Super Trend line, it indicates a downward trend, suggesting bearish momentum is likely to persist.
DOGE Price Prediction: Meme Coin Eyes Sub $0.20
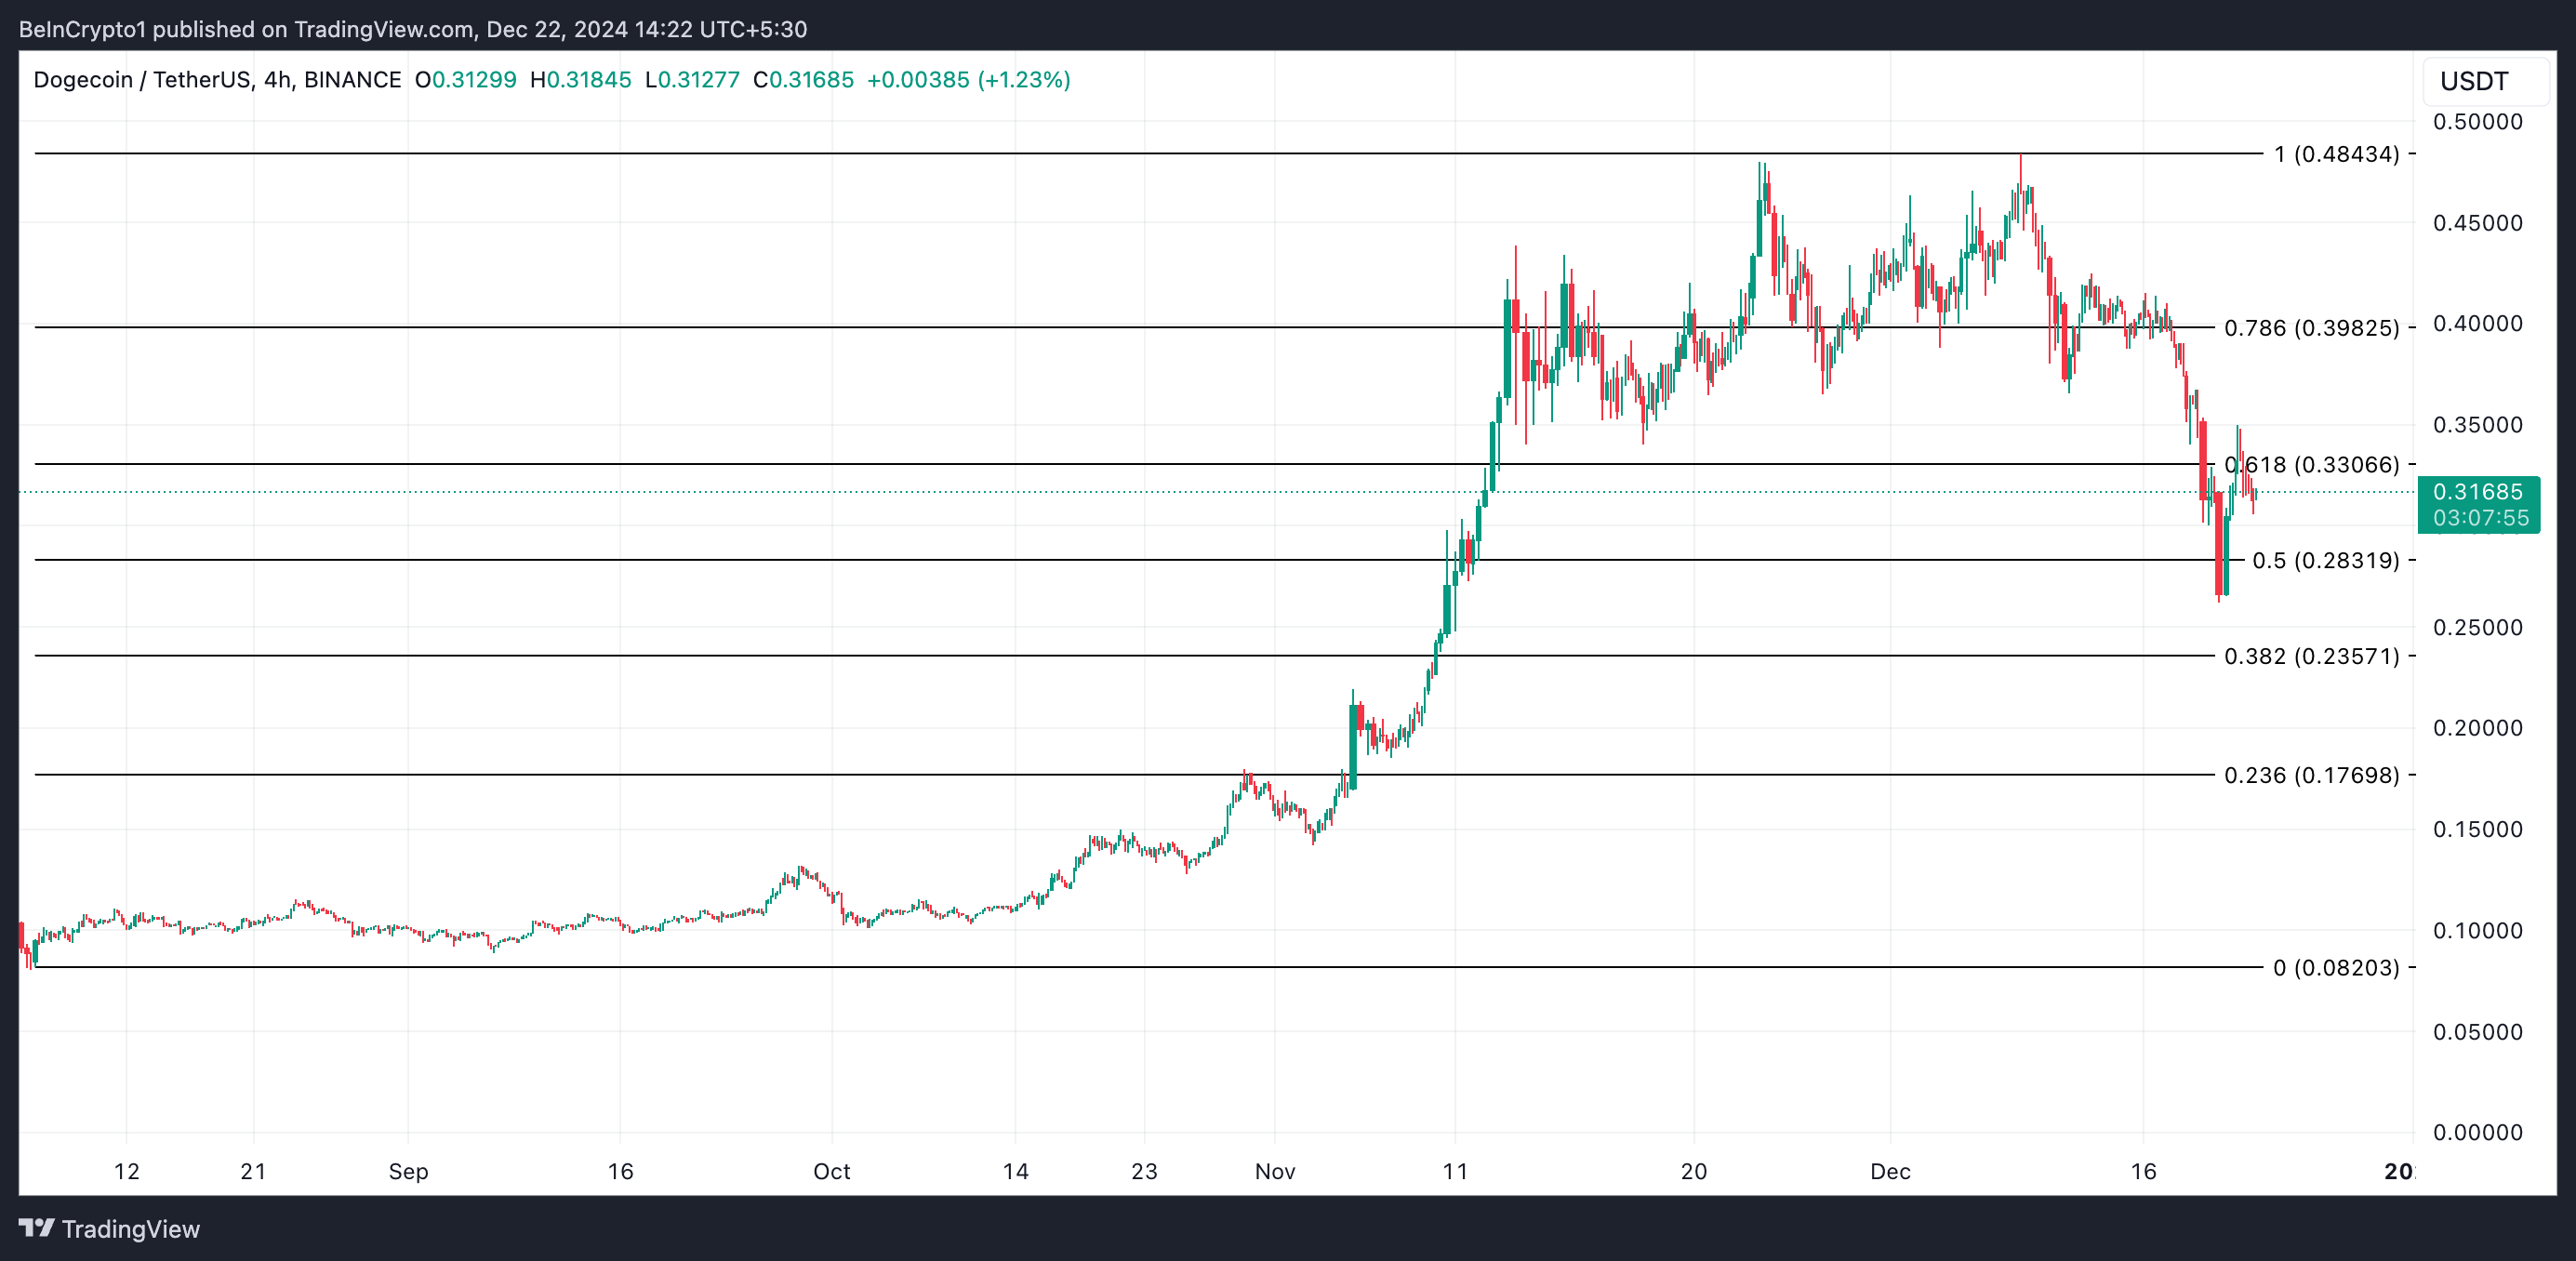
On the daily chart, DOGE is trading below the resistance at $0.33. Persistent spikes in selling pressure at this level could drive its price down to the support at $0.28.
Should this support fail, DOGE’s next key level lies at $0.23. If bulls cannot defend this level, the meme coin could slip below the $0.20 zone, potentially reaching $0.17.

On the other hand, a successful breach of the $0.33 resistance level could propel DOGE towards its yearly peak of $0.48.
Disclaimer: The views in this article are from the original Creator and do not represent the views or position of Hawk Insight. The content of the article is for reference, communication and learning only, and does not constitute investment advice. If it involves copyright issues, please contact us for deletion.