VIRTUAL Token Surges Past $380 Million in Daily Volume, Eyes All-Time High Comeback
VIRTUAL token rallies 24% with $383 million in trading volume. Bullish sentiment and 20-day EMA support hint at further gains
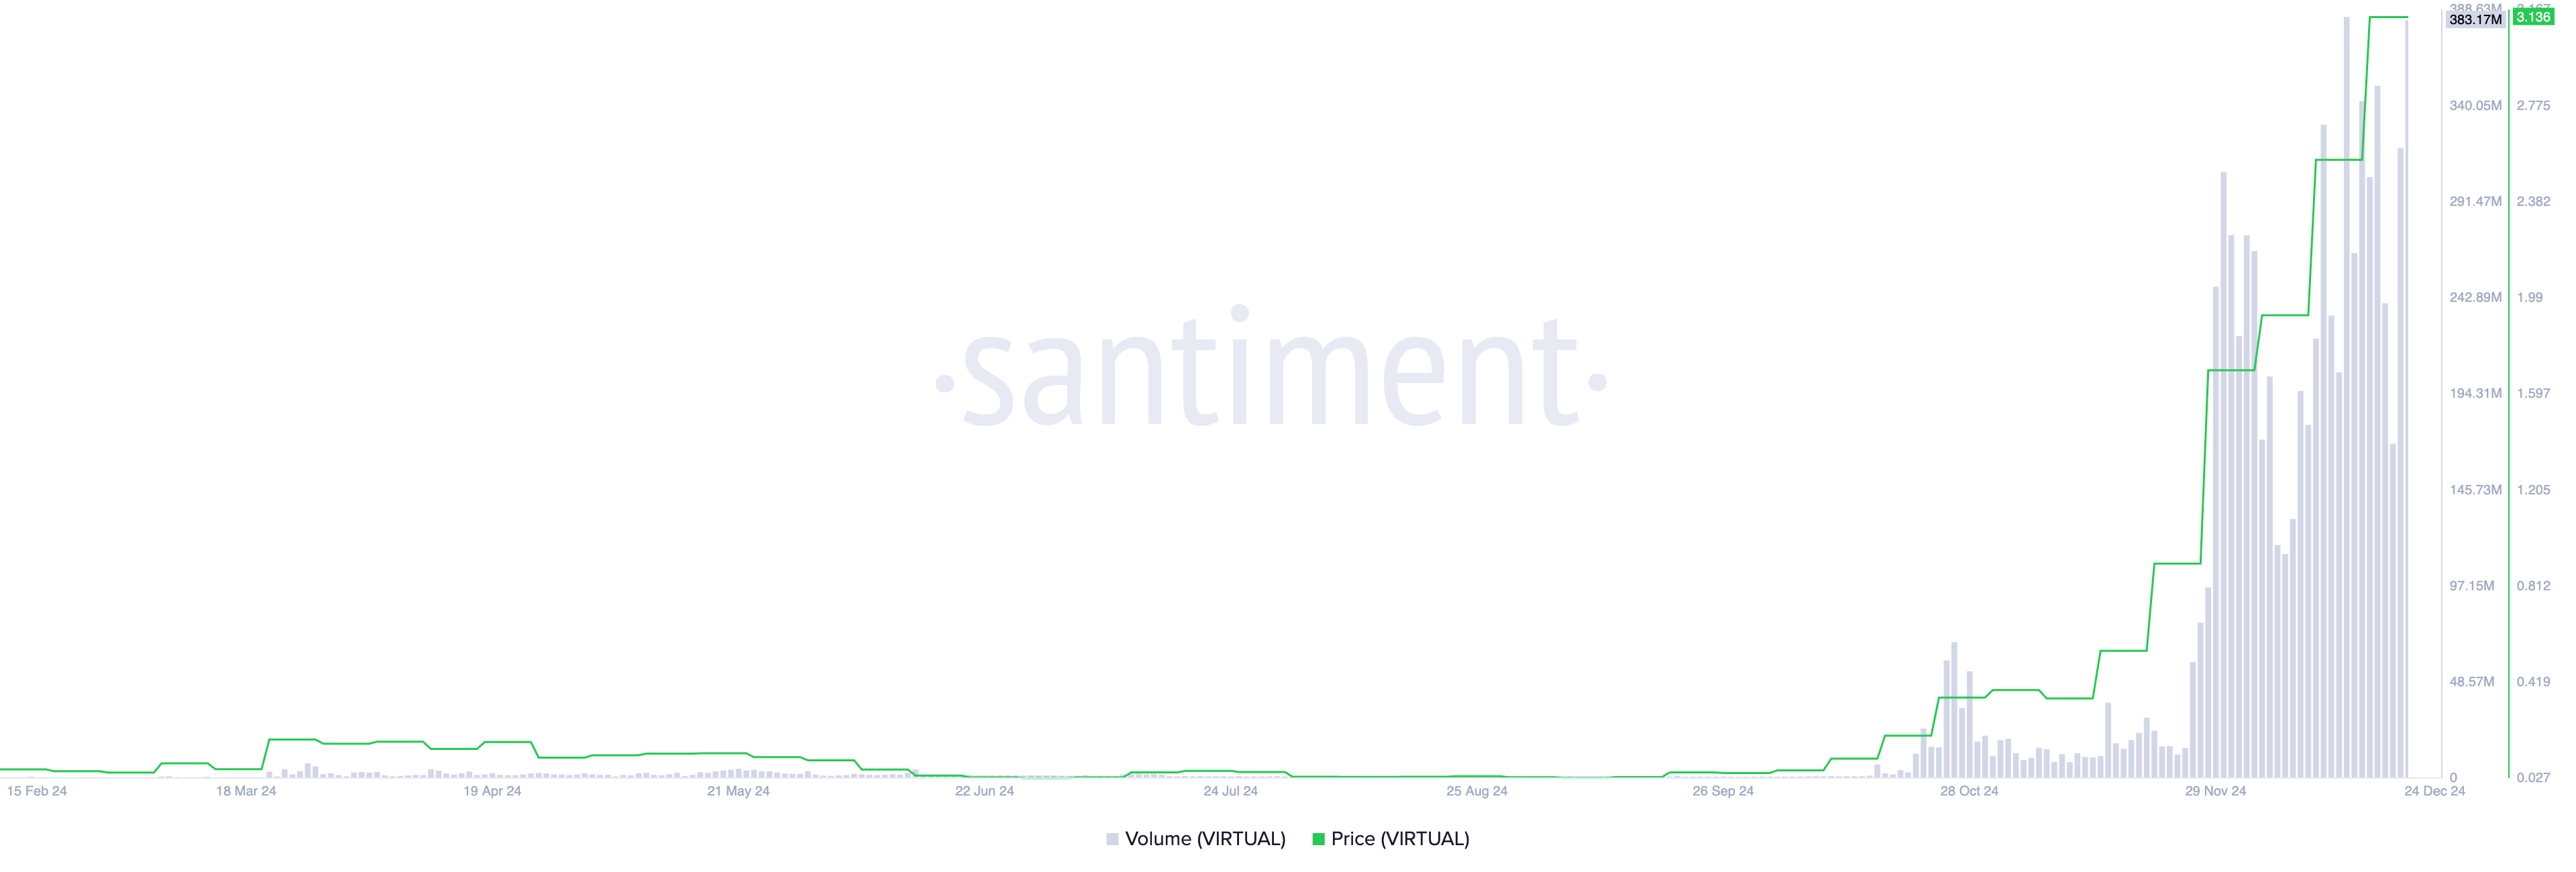
- VIRTUAL soared 24% in the last 24 hours, driven by a 109% spike in trading volume, reaching $383 million.
- A Long/Short Ratio of 1.02 reflects bullish sentiment, with traders optimistic about further price gains and sustained momentum.
- The 20-day EMA acts as key support, and if buying pressure holds, VIRTUAL will eye a rally past its $3.30 all-time high.

VIRTUAL, the native token that powers the decentralized platform for creating AI agents Virtuals Protocol, has rocketed by 24% in the past 24 hours. This double-digit rally has propelled the altcoin to the top of the gainers list during the review period.
VIRTUAL’s rally is accompanied by a remarkable surge in its daily trading volume. This indicates heightened interest and demand for the altcoin, suggesting that the current rally may continue.
VIRTUAL Sees Rise in Demand
The 24% surge in VIRTUAL’s value has been driven by a 109% spike in daily trading volume over the past 24 hours, reaching an impressive $383 million within that timeframe. This is a bullish indicator, signaling that the altcoin is poised to extend its gains.

When an asset’s price increases alongside its trading volume, it indicates strong market interest and heightened activity around the asset. This combination suggests that the price increase is backed by significant buyer participation, making it more likely to be sustained.
Further, VIRTUAL’s Long/Short Ratio supports this bullish outlook. Per Coinglass, it is 1.02 at press time, indicating a higher demand for long positions.

When an asset’s Long/Short Ratio is above 1, there are more long positions (bets that the asset’s price will rise) than short positions (bets that the price will fall) in the market. Higher demand for long positions reflects bullish sentiment, indicating traders are optimistic about the asset’s future price movement.
VIRTUAL Price Prediction: The 20-day EMA Is Key
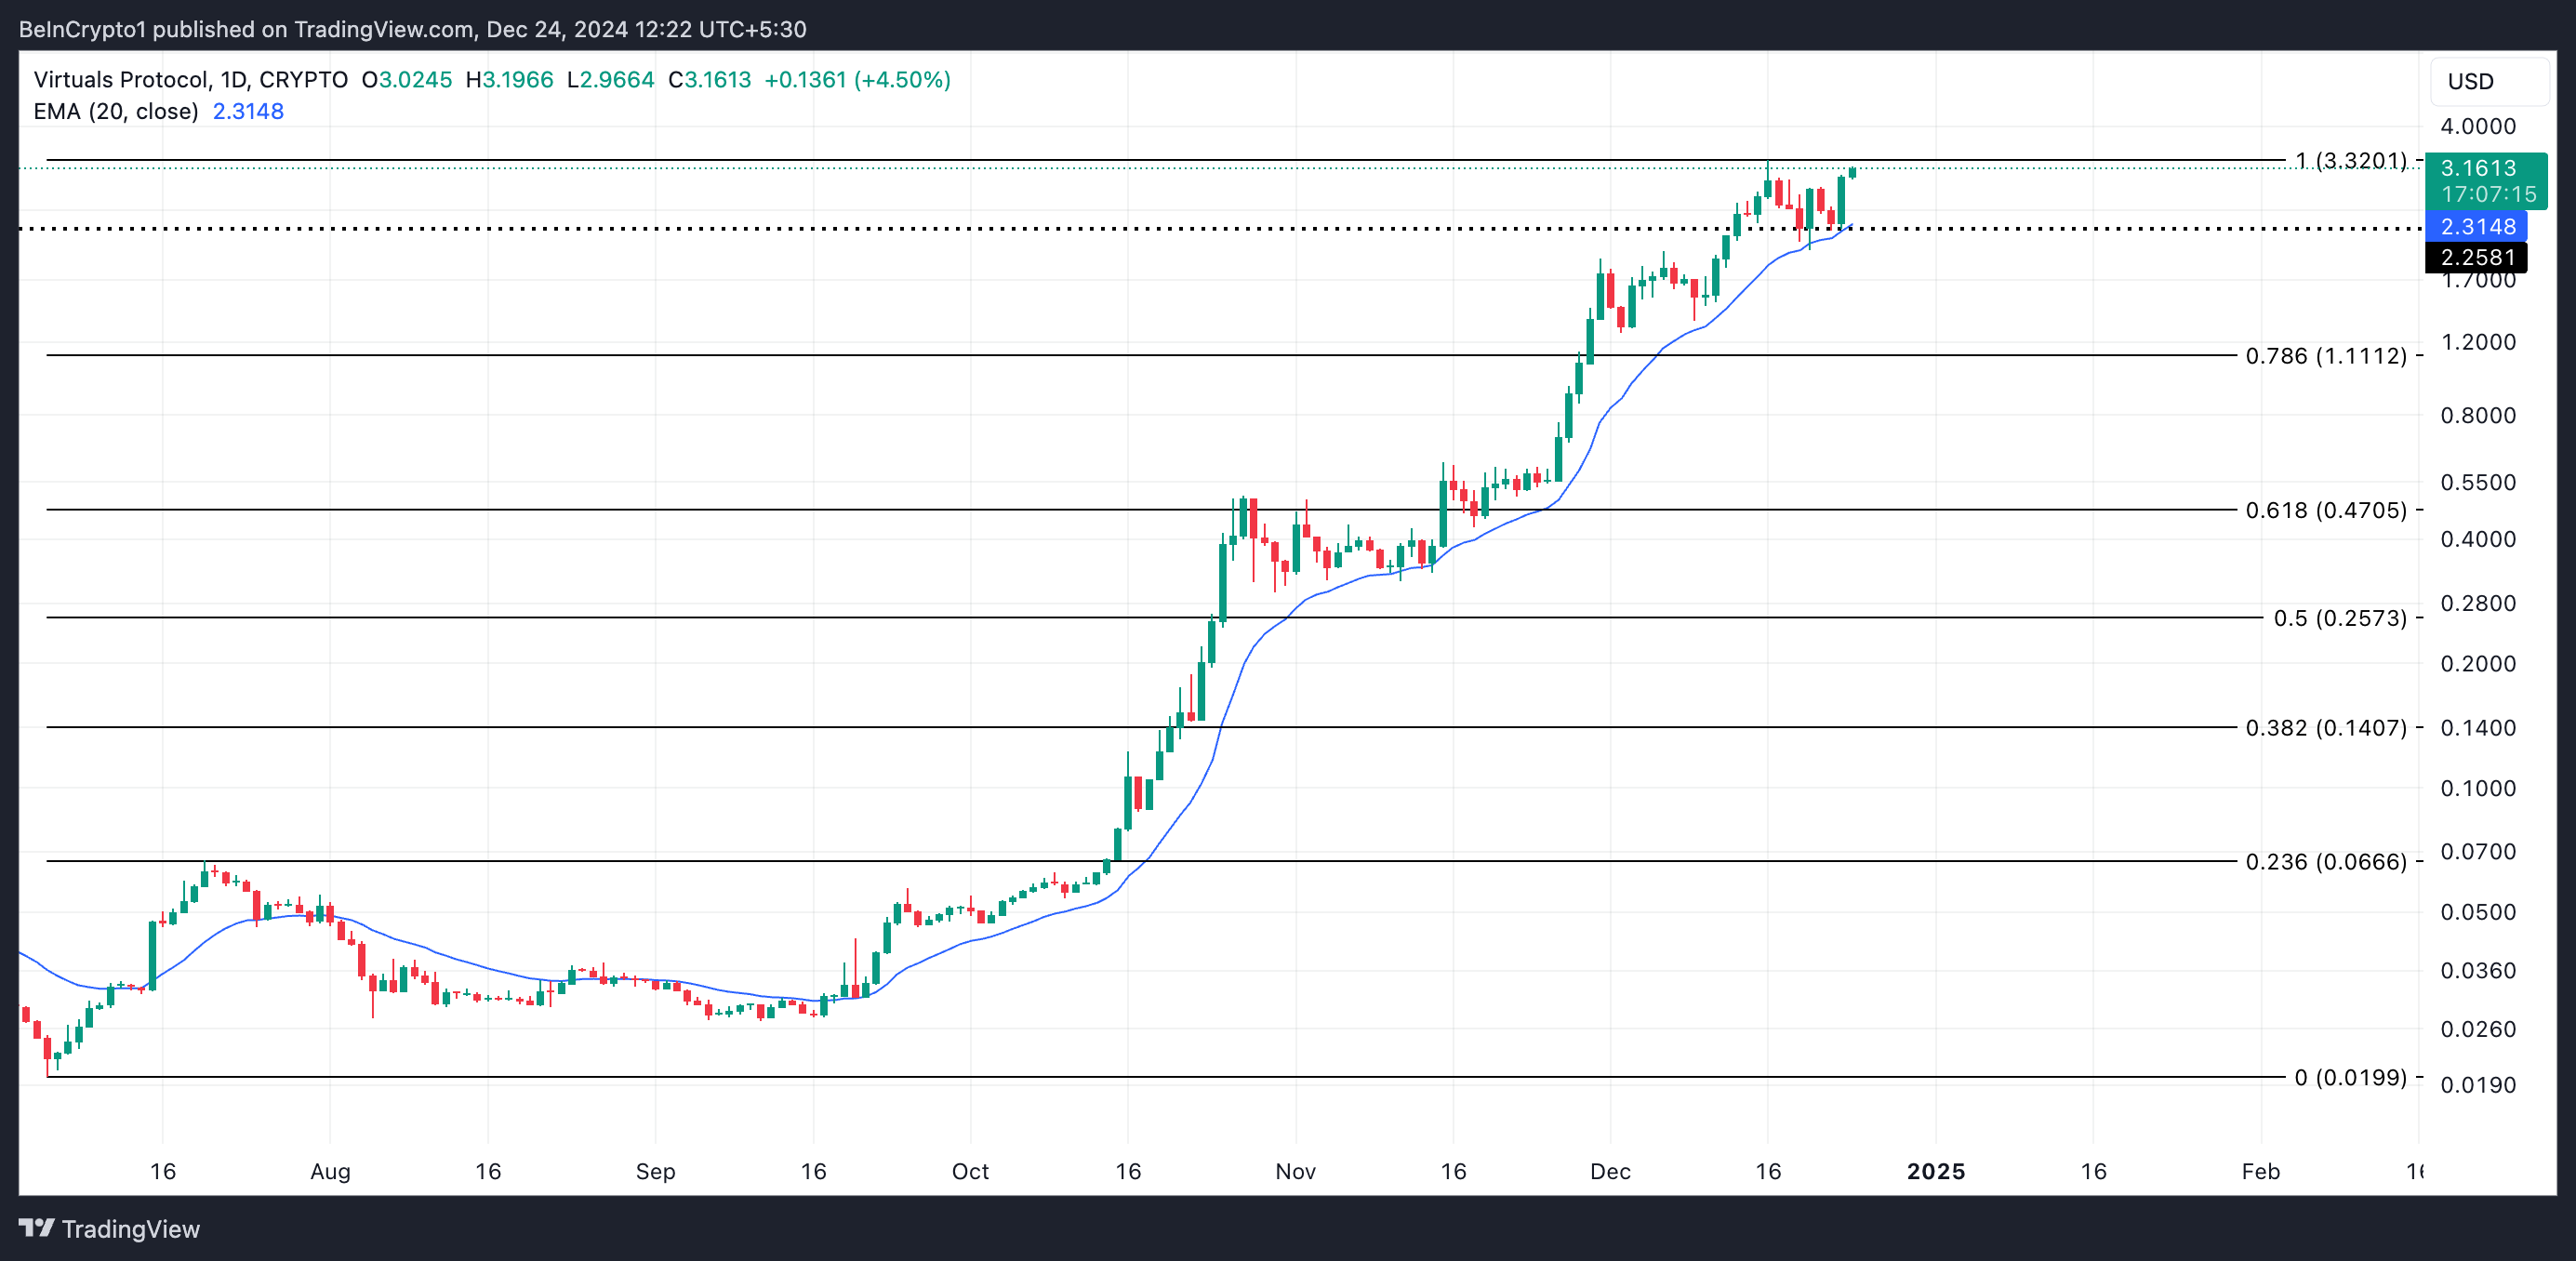
On the daily chart, VIRTUAL trades just below its all-time high of $3.32, which it last reached on December 16. This comes after it bounced off the support offered by its 20-day Exponential Moving Average (EMA) at $2.31 during Monday’s trading session.
This key moving average tracks the average price of an asset over the last 20 days, giving more weight to recent prices for better trend analysis. When an asset bounces off the 20-day EMA as support, buyers are defending this level, reinforcing a bullish trend. If this support level continues to hold, VIRTUAL could reclaim its all-time high and rally past it.

However, if market sentiment shifts and the VIRTUAL token breaks below the 20-day EMA, its price could fall toward $1.11.
Disclaimer: The views in this article are from the original Creator and do not represent the views or position of Hawk Insight. The content of the article is for reference, communication and learning only, and does not constitute investment advice. If it involves copyright issues, please contact us for deletion.