Ascending Triangle Pattern Analysis: A Key Bullish Signal in the Market
Learn what is an ascending triangle.Trading strategies to trade them, catch expensive moves, and how to maximize your profits.
In technical analysis of financial markets, the ascending triangle is a highly regarded chart pattern used to identify potential bullish signals. It not only helps traders capture market trends but also provides clear trading strategies. This article delves into the formation, characteristics, trading strategies, and applications of the ascending triangle to help traders effectively utilize this technical analysis tool.
What is an Ascending Triangle?
An ascending triangle is a classic bullish chart pattern typically seen in an uptrend. Its main features include:
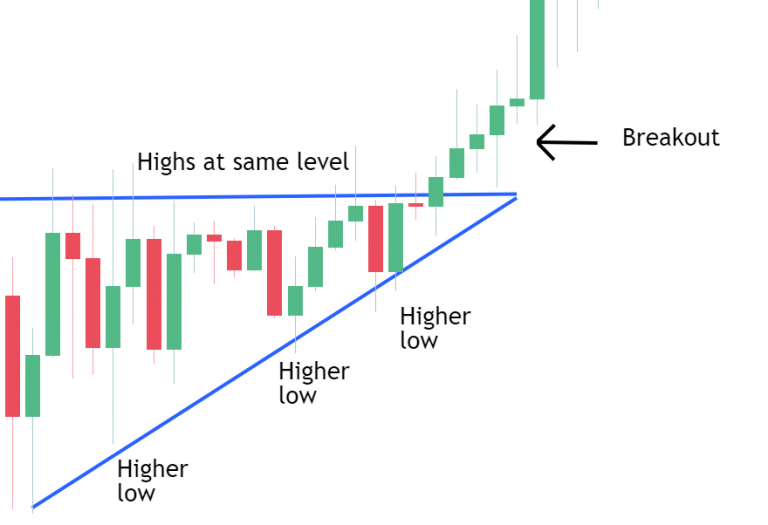
- Horizontal Resistance: The price forms a horizontal resistance line on the chart, testing it multiple times without breaking through.
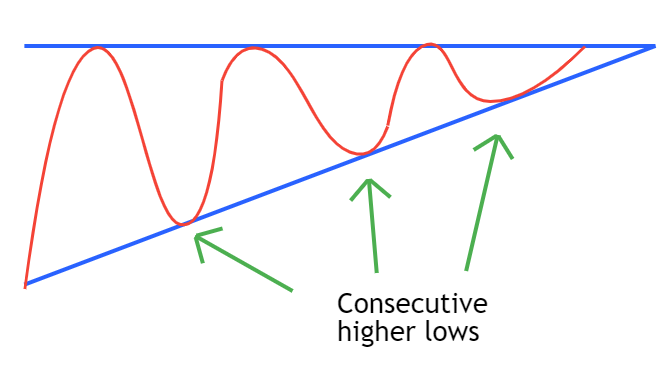
- Gradually Rising Lows: The price forms higher lows during each pullback, indicating increasing buying pressure.
- Converging Range: The price's volatility gradually narrows over time, forming a converging triangle structure.
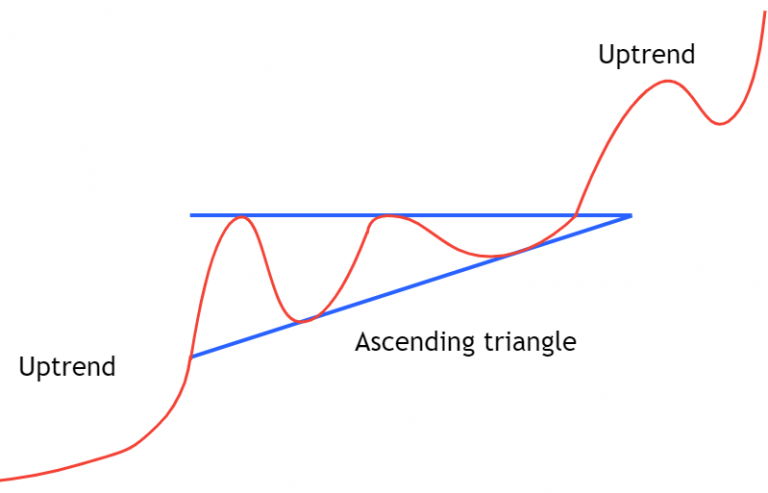
The ascending triangle pattern is usually illustrated as follows:
Market Implications of the Ascending Triangle
The ascending triangle is considered a strong bullish signal for several reasons:
- Diminishing Selling Pressure: Although the price repeatedly tests the upper resistance, each pullback is smaller, indicating that selling pressure is weakening.
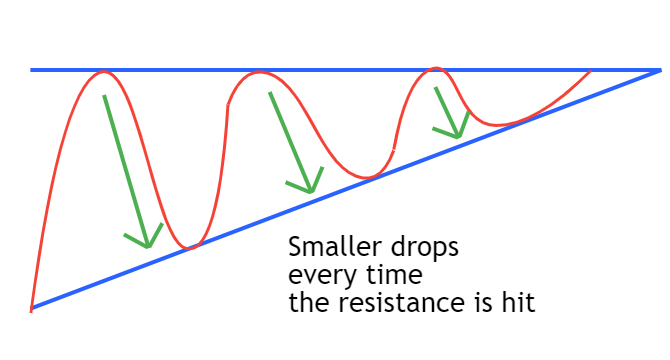
- Buying Dominates the Market: Each pullback forms a higher low, suggesting that buyers are increasingly in control and willing to buy at higher prices.
- Momentum After Breakout: Once the price breaks through the resistance, it often triggers a surge in buy orders and a significant increase in trading volume, further driving the price up.
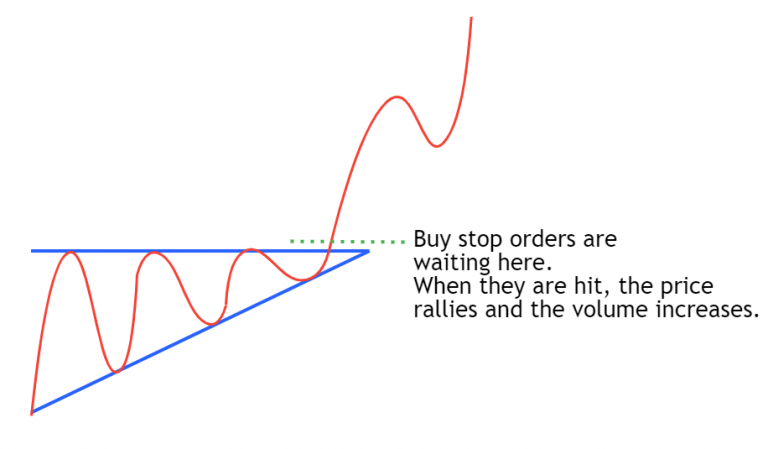
The strength of the ascending triangle lies in the accumulation of buying momentum, which often leads to explosive price increases following a breakout.
Comparison of Ascending Triangle and Descending Triangle
Ascending Triangle and Descending Triangle have opposite implications in market trends:
- Ascending Triangle: Typically appears in an uptrend and suggests that the price may continue to rise.
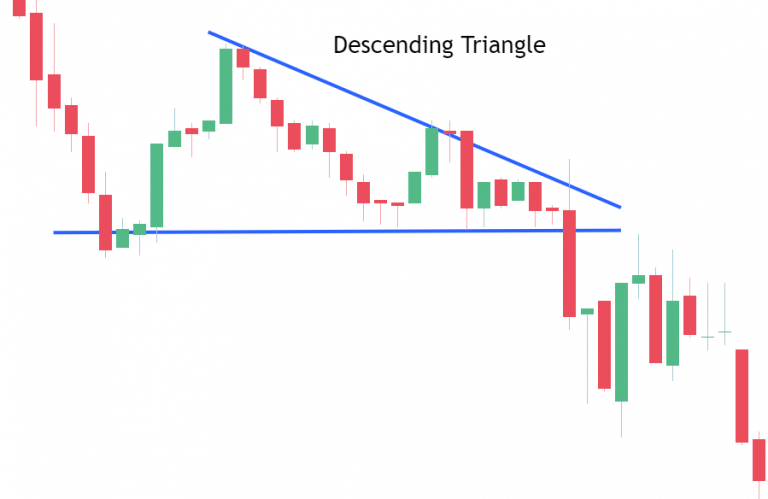
- Descending Triangle: Appears in a downtrend and suggests that the price may accelerate its decline.
The descending triangle formation is illustrated as follows:
Common Mistakes in Trading Ascending Triangles
When trading the ascending triangle, investors should avoid the following common mistakes:
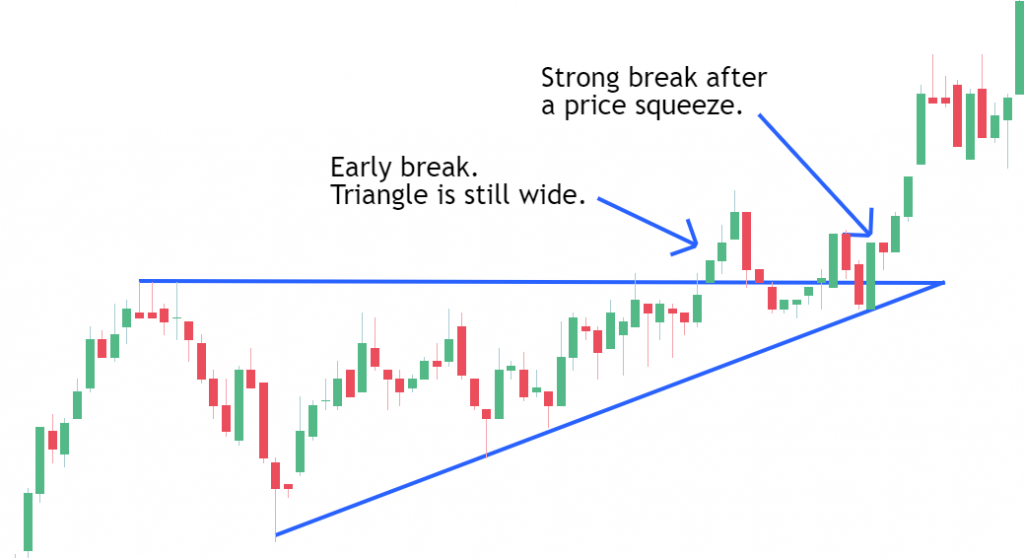
- Entering Too Early: Entering the market before the price has fully compressed to the end of the triangle can lead to losses. It is better to wait until the price approaches the top of the triangle to ensure the breakout signal is valid.
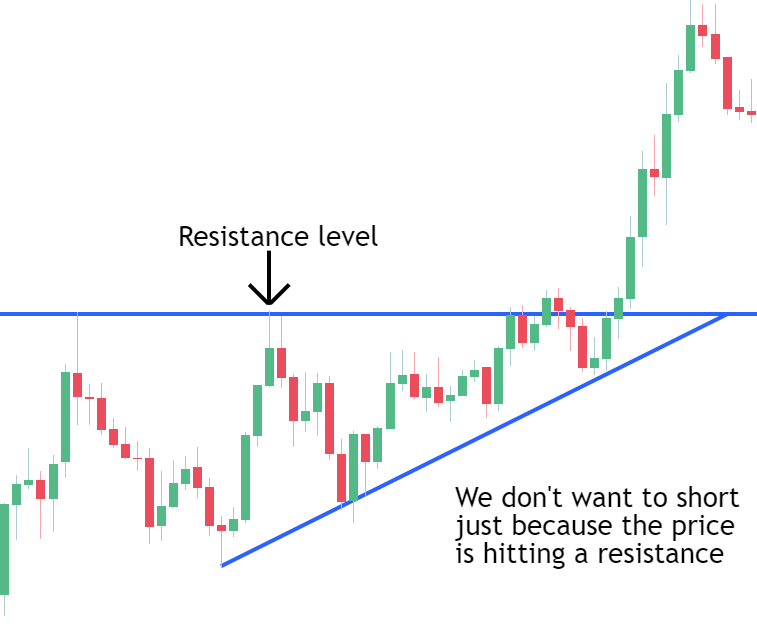
- Blindly Shorting: While technical analysis often suggests shorting at resistance levels, the resistance in an ascending triangle is less suitable for shorting due to the increasing buyer strength. Instead, expect a breakout rather than trading against the trend.
Five Trading Strategies for Ascending Triangles
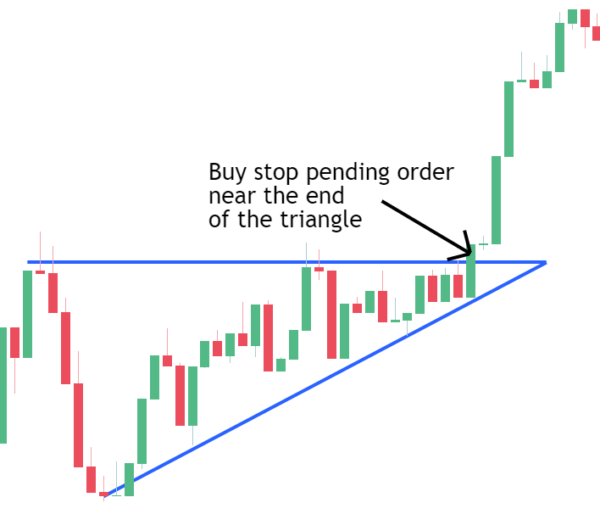
Buy Stop Orders:
- Strategy: Set buy stop orders near the top of the triangle as the price approaches. This strategy is suitable when the breakout signal is clear.
- Note: Avoid entering too early in the breakout phase to prevent losses from false breakouts.
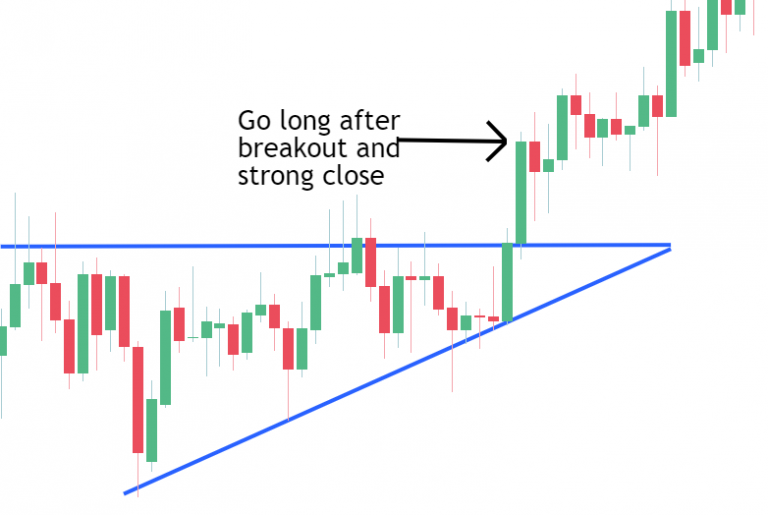
Breakout and Strong Close:
- Strategy: Wait for a strong bullish close after the price breaks the resistance and observe whether a robust bullish candlestick forms. A strong breakout signal is usually accompanied by high trading volume.
- Advantage: Helps confirm the genuine buying momentum in the market.
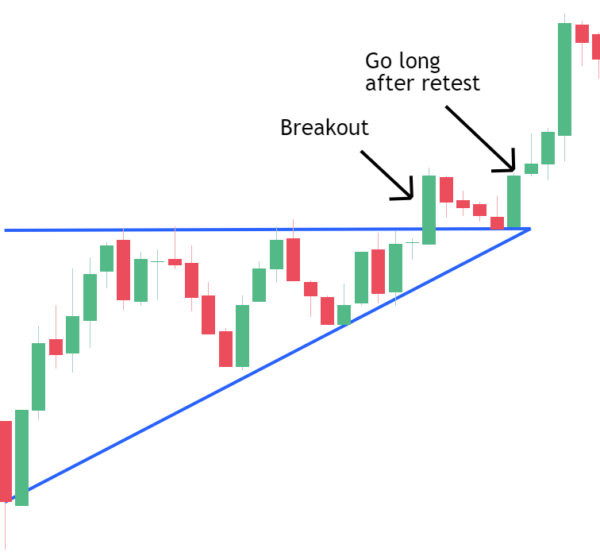
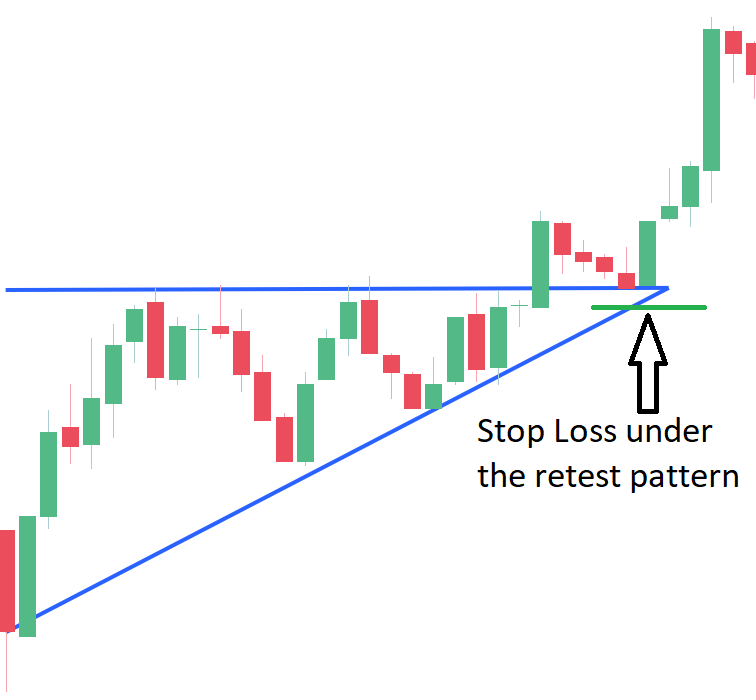
Breakout and Retest:
- Strategy: After the price breaks the resistance, wait for a pullback and confirm that the resistance has turned into support before entering the market. This strategy is more conservative but reduces the risk of false breakouts.
- Advantage: Provides a more secure entry point.
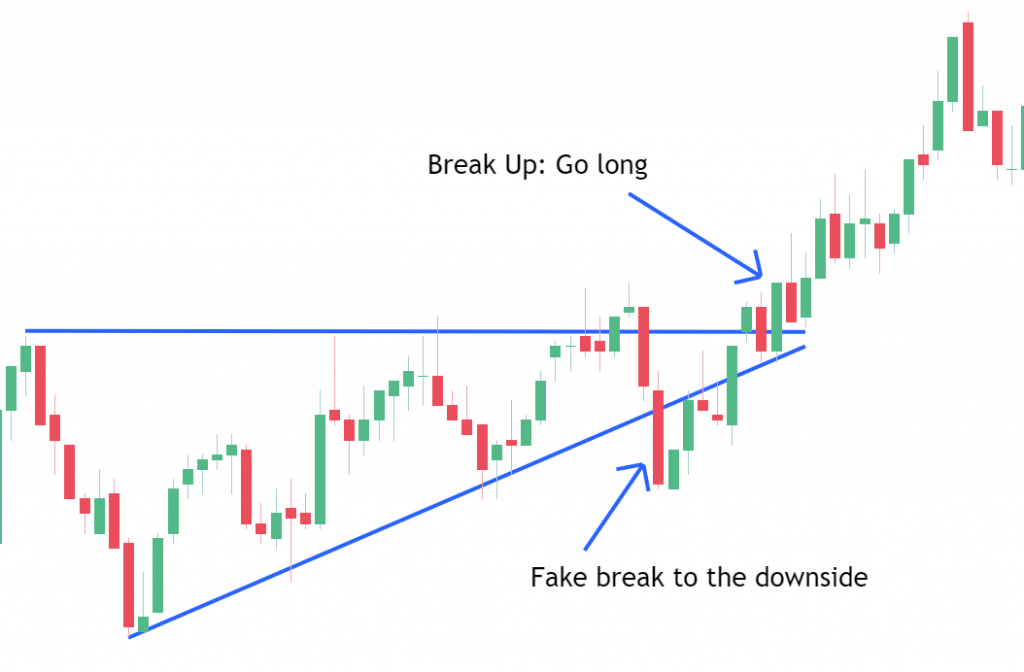
Breakout to the Downside and Reversal:
- Strategy: Enter the market again after a false breakout and a quick recovery. This situation often occurs due to large funds intentionally creating false breakouts.
- Advantage: Capitalizes on short-term market fluctuations.
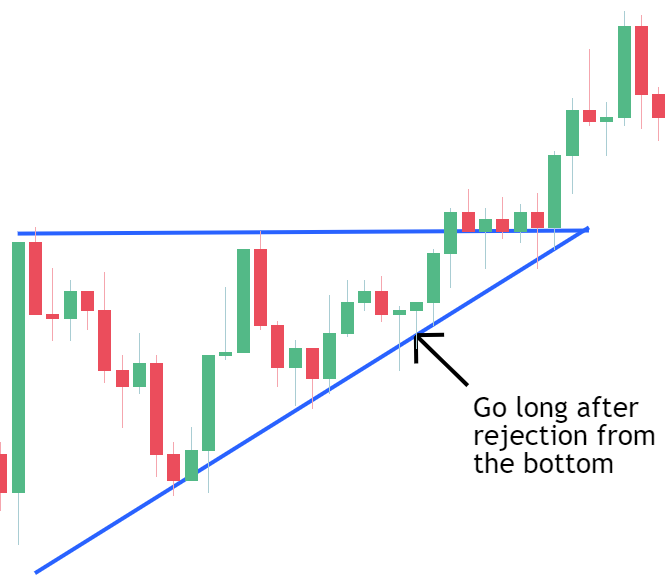
Breakout Anticipation:
- Strategy: Enter the market early as the price approaches the bottom of the triangle, taking advantage of lower entry prices and higher risk-reward ratios.
- Advantage: Provides a more favorable entry price and greater profit potential.
Application of Ascending Triangle in Different Markets
Role of Ascending Triangle in Uptrend:
- Typically acts as a continuation signal in an uptrend, indicating that the price is likely to rise further in the short term.
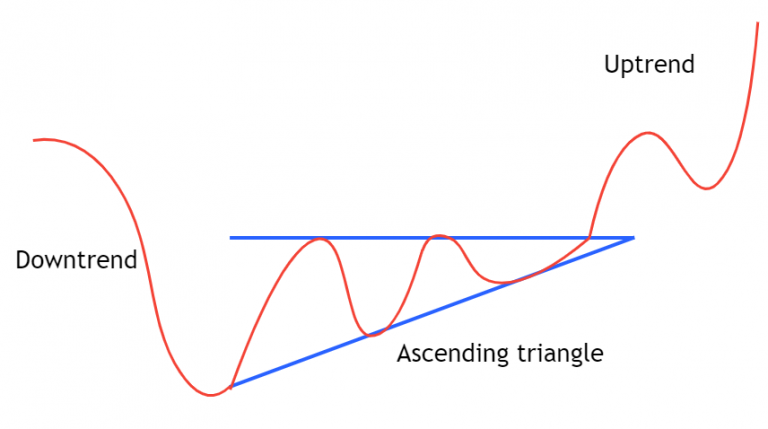
Role of Ascending Triangle in Downtrend:
- When appearing in a downtrend, it may signal a trend reversal, shifting from a downtrend to an uptrend.
Risk Management and Profit Management
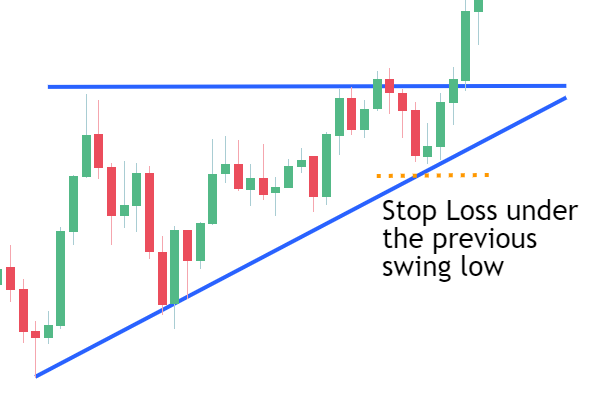
Risk Management:
- Pre-Breakout or Breakout Stop Loss: Set a stop loss below the previous low point before or during the breakout to ensure minimal loss in case of a price pullback.
- Pullback Stop Loss: For entries after a breakout, set the stop loss below the new support formed during the pullback to minimize risk.
Profit Management:
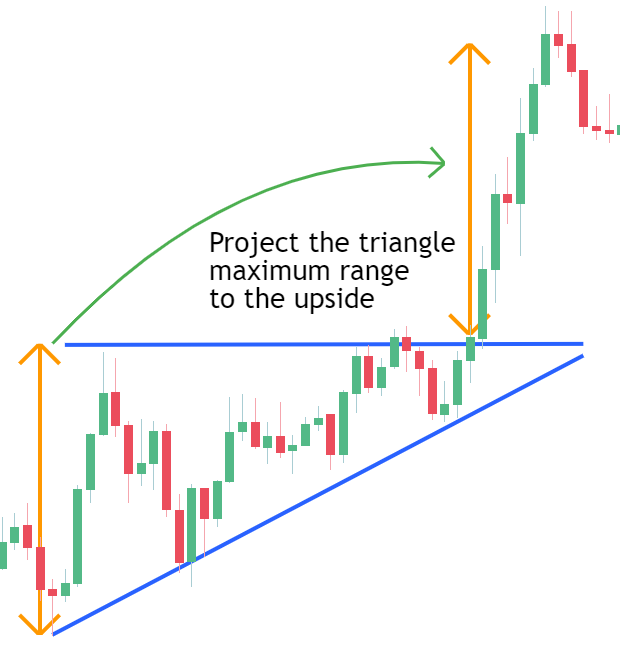
- Price Target Projection: Estimate the price target based on the width of the triangle and set realistic profit targets.
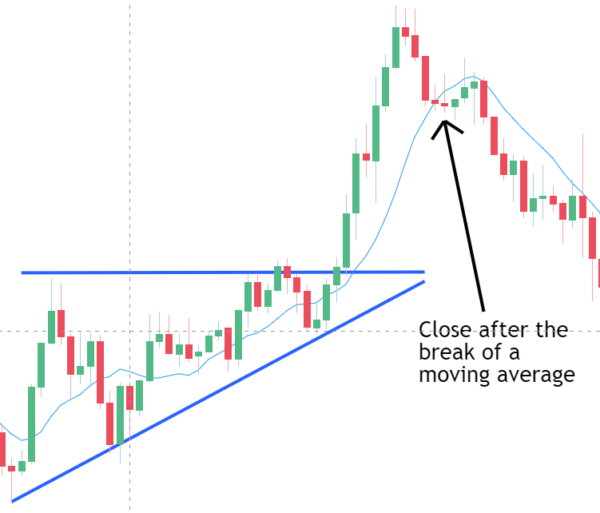
- Use of Moving Averages: Close positions when the price breaks below the moving average to protect existing profits.
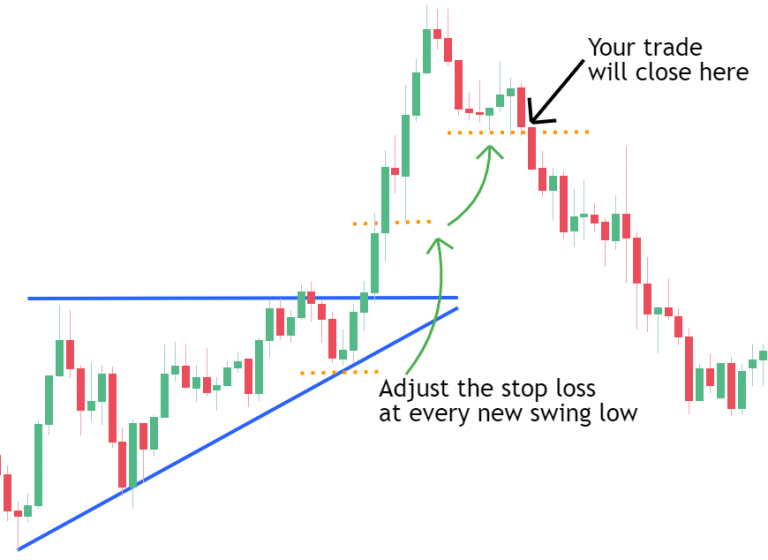
- Trailing Stop Loss: Adjust the stop loss according to each price pullback to maximize profits and safeguard gains.
Summary
The ascending triangle is a powerful technical analysis tool that helps traders identify potential bullish opportunities. By mastering the trading strategies and risk management techniques associated with this pattern, investors can better leverage market opportunities and optimize their trading performance. Proper application of ascending triangle trading strategies can significantly enhance trading success and profit potential.
Disclaimer: The views in this article are from the original Creator and do not represent the views or position of Hawk Insight. The content of the article is for reference, communication and learning only, and does not constitute investment advice. If it involves copyright issues, please contact us for deletion.


