Hammer Candlestick Pattern - What Is And How To Trade
Learn all about the Hammer candlestick pattern.What is, how to trade, and all the best trading strategies.
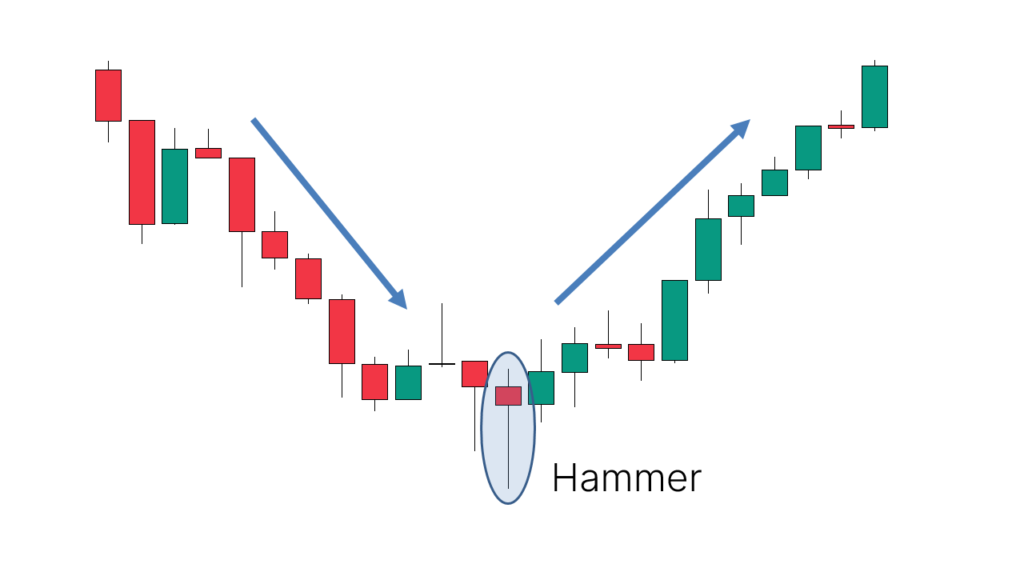
Hammer is a bullish reversal pattern in the form of a Japanese candlestick pattern. It typically appears after a price decline, signaling rejection of lower prices. This is a reversal pattern because it suggests an upward reversal after its formation. Hammer is also the mirrored version of the Inverted Hammer candlestick pattern.
Identifying Hammer Candlestick Patterns
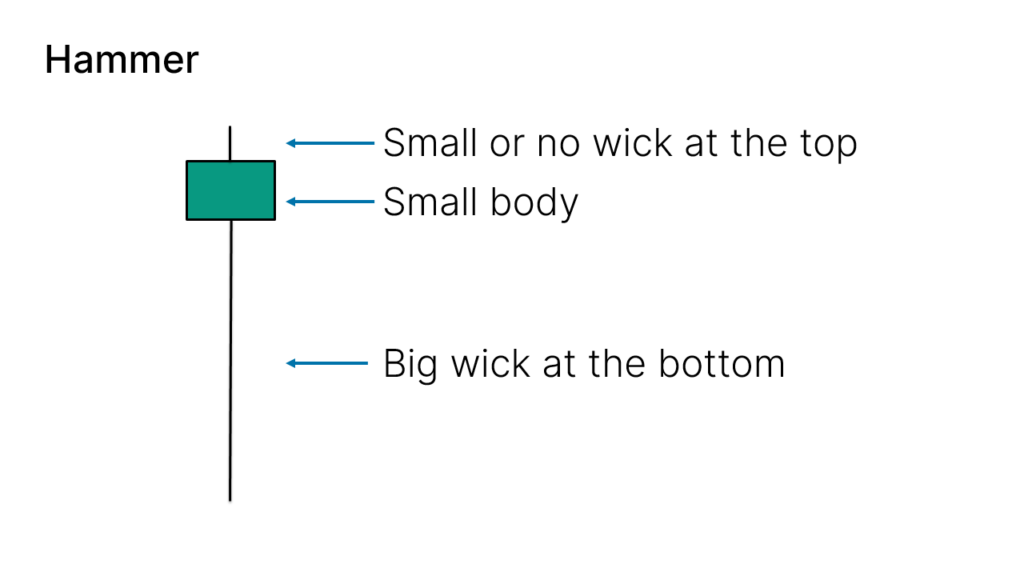
Hammer candlestick patterns consist of a single candlestick, identified by:
- A small body
- A long lower shadow relative to the body
- Little to no upper shadow; if present, it is very short
- The color of the candlestick body is not crucial; the shape is key.
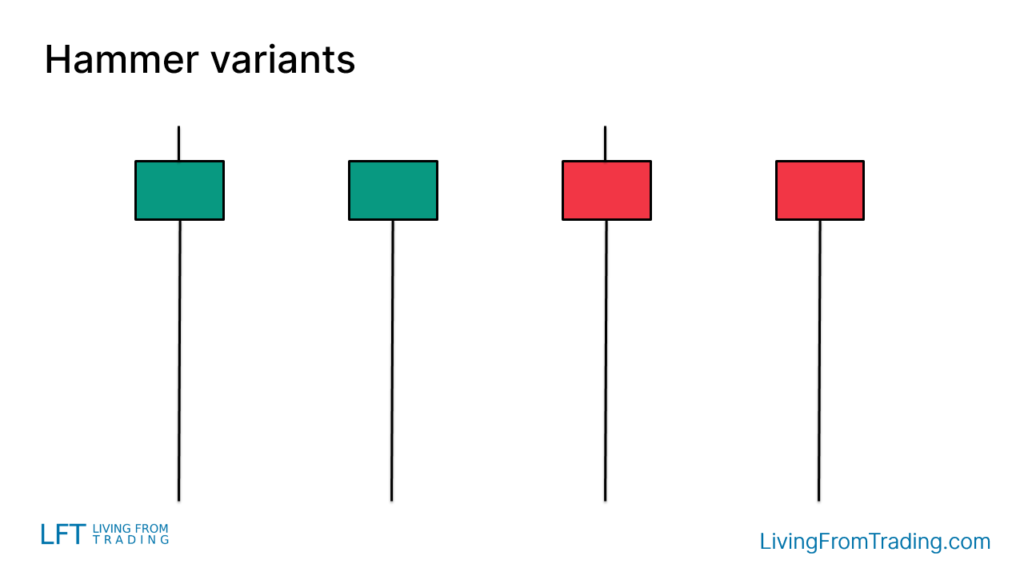
Variations of Hammer Candlestick Patterns
On charts, Hammer candlestick patterns may vary slightly in appearance. The color of the body can be red or green (indicating bearish or bullish sentiment), and the presence of an upper shadow is insignificant as long as it is minimal.
How to Trade
Trading Hammer candlestick patterns involves more than simply identifying candlesticks with the same shape on a chart. Its effectiveness depends on where it appears:
- To trade a Hammer, observe a preceding downtrend indicating a bearish trend.
- After a Hammer forms during this downtrend, it suggests a potential upward reversal.
Trading Strategies
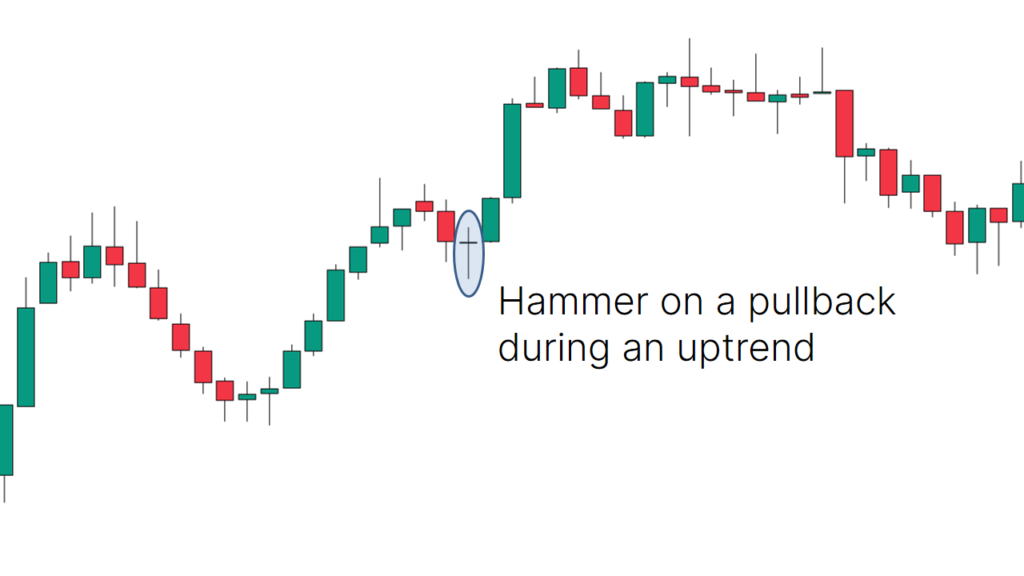
Strategy 1: Pullbacks on Naked Charts
As a bullish reversal pattern, Hammer candlestick patterns are particularly significant during pullbacks in an uptrend. Follow these steps:
- Confirm the uptrend: Ensure prices are rising.
- Wait for a pullback: Look for a short-term price decline.
- Identify Hammer: Note the appearance of a Hammer candlestick pattern.
- Entry condition: Consider entering a long position when prices break above the Hammer's high.
- Stop-loss and take-profit levels: Set these levels with the expectation of further price increases.
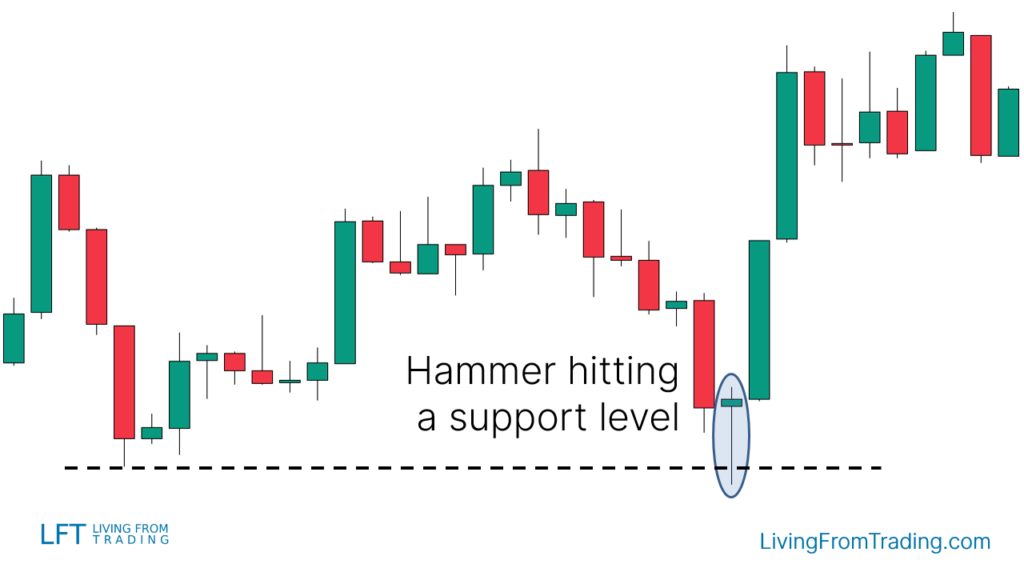
Strategy 2: Trading with Support Levels
Support and resistance levels are crucial technical tools for identifying price reversals. Use support levels to trade Hammer candlestick patterns:
- Plot support levels: Mark key support levels on the chart.
- Wait for prices to approach support levels: Prices should decline and approach support.
- Identify Hammer: Observe if a Hammer candlestick pattern appears near a support level.
- Entry condition: Confirm a long entry signal when prices break above the Hammer's high.
- Stop-loss and take-profit levels: Set effective levels expecting price rises.
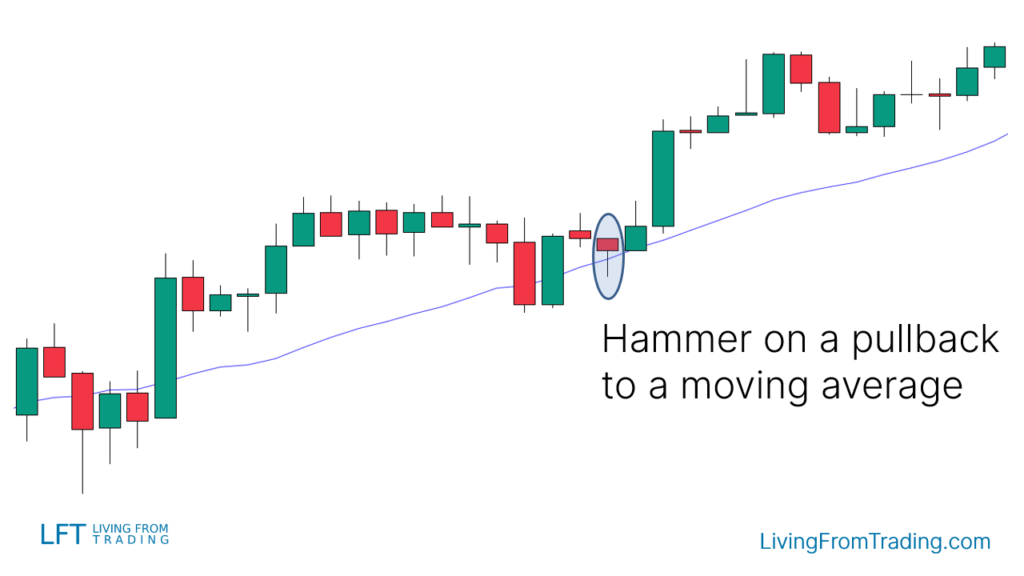
Strategy 3: Trading with Moving Averages
Moving averages are effective trend indicators that help confirm long-term price trends. Use moving averages to trade Hammer candlestick patterns:
- Confirm the uptrend: Prices are above the moving average and forming an uptrend.
- Wait for prices to pull back near the moving average: Observe short-term price declines approaching the moving average.
- Identify Hammer: Confirm the appearance of a Hammer candlestick pattern near the moving average.
- Entry condition: Enter a long position when prices break above the Hammer's high.
- Stop-loss and take-profit levels: Set effective levels expecting further price increases.
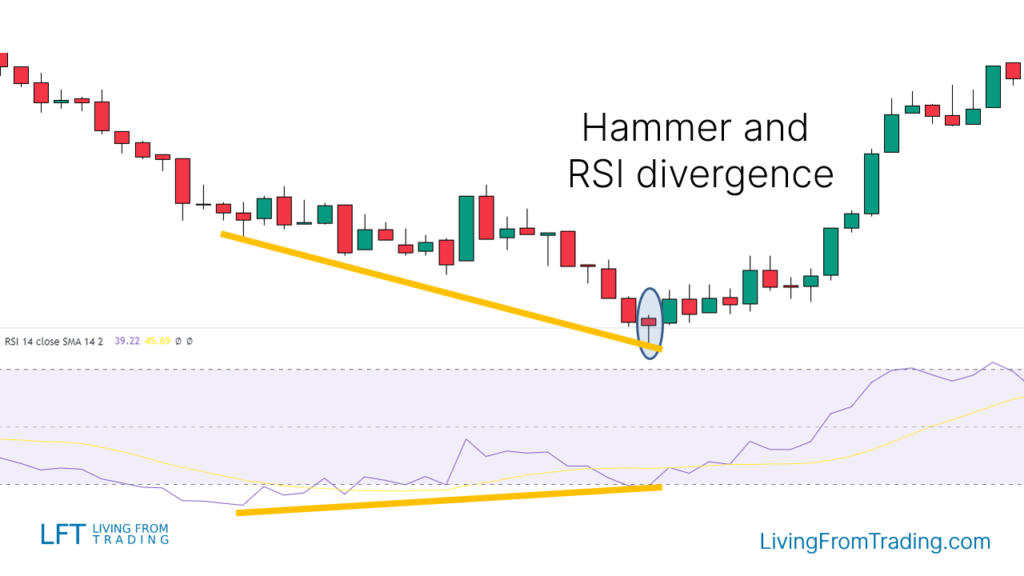
Strategy 4: Trading with RSI Divergence
This strategy differs from others by using the RSI indicator to confirm price trend divergences. Follow these steps:
- Confirm the downtrend: Prices form a downtrend with lower lows and highs.
- Observe the RSI indicator: Compare RSI lows with price lows.
- Identify Hammer: Confirm the appearance of a Hammer candlestick pattern when prices form new lows and align with RSI divergence.
- Entry condition: Consider entering a long position when prices break above the Hammer's high.
- Stop-loss and take-profit levels: Set effective levels expecting price increases.
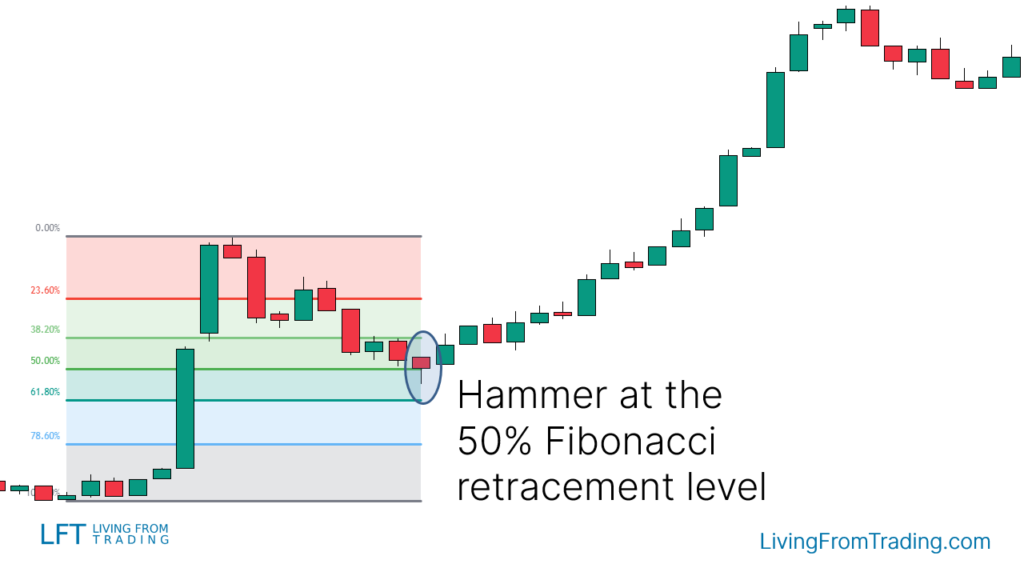
Strategy 5: Trading with Fibonacci
Using the Fibonacci retracement tool is another popular method to trade Hammer candlestick patterns:
- Confirm the uptrend: Prices typically experience pullbacks during an upward trend.
- Draw the Fibonacci tool: From the price's low point to high point, draw Fibonacci retracement levels.
- Wait for price pullback: Wait for prices to pull back and approach Fibonacci retracement levels.
- Identify Hammer: Confirm the appearance of a Hammer candlestick pattern near Fibonacci retracement levels.
- Entry condition: Enter a long position when prices break above the Hammer's high.
- Stop-loss and take-profit levels: Set effective levels expecting further price increases.
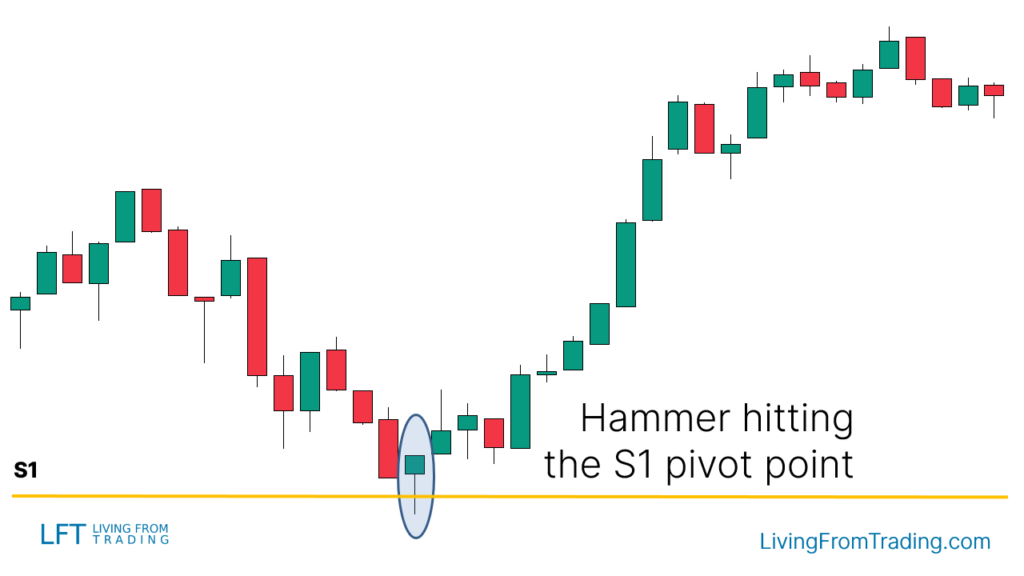
Strategy 6: Trading with Support Levels
Support and resistance levels are essential technical tools for identifying price reversals. Use support levels to trade Hammer candlestick patterns:
- Plot support levels: Mark key support levels on the chart.
- Wait for prices to approach support levels: Prices should decline and approach support.
- Identify Hammer: Observe if a Hammer candlestick pattern appears near a support level.
- Entry condition: Confirm a long entry signal when prices break above the Hammer's high.
- Stop-loss and take-profit levels: Set effective levels expecting price rises.
Conclusion
Hammer candlestick patterns are bullish reversal patterns in the form of Japanese candlestick patterns. They typically appear after a price decline, indicating rejection of lower prices. Key identification features include a small candlestick body, a long lower shadow, and little to no upper shadow.
To trade Hammers effectively, observe preceding downtrends and consider entering long positions after the formation of a Hammer candlestick pattern.
Enhance trading accuracy by combining pullbacks, support levels, moving averages, and other technical analysis methods. Statistically, Hammer candlestick patterns have a success rate of approximately 60%.
Disclaimer: The views in this article are from the original Creator and do not represent the views or position of Hawk Insight. The content of the article is for reference, communication and learning only, and does not constitute investment advice. If it involves copyright issues, please contact us for deletion.