Rising Three Methods Candlestick Pattern - What Is And How To Trade
Learn all about the Rising Three Methods candlestick pattern.What is, how to trade, and all the best trading strategies.

Rising Three Methods is a Japanese candlestick chart pattern used to identify bullish trends in the market. Here is a detailed introduction to this pattern, including how to identify it, its variations, trading strategies, and success rates.
Definition of the Rising Three Methods Candlestick Pattern
The Rising Three Methods is a bullish continuation pattern that typically appears during a pause after a price uptrend. This pattern suggests that the market may continue to rise, making it a signal for the continuation of an upward trend. It is essentially the mirror image of the Falling Three Methods pattern.
How to Identify the Rising Three Methods Pattern
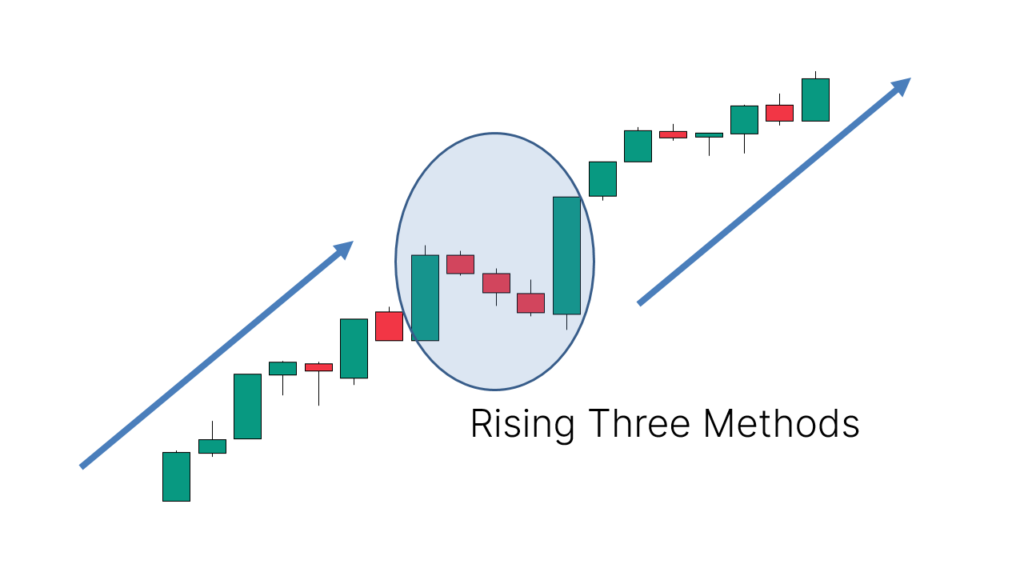
The Rising Three Methods pattern consists of five candlesticks:
- A large bullish candle (green candlestick) appears first.
- This is followed by three smaller bearish candles (red candlesticks), where the highs of these bearish candles do not exceed the high of the initial bullish candle.
- Finally, a large bullish candle appears again, with its closing price above the highs of the other four candles.
_2127726267_519.png)
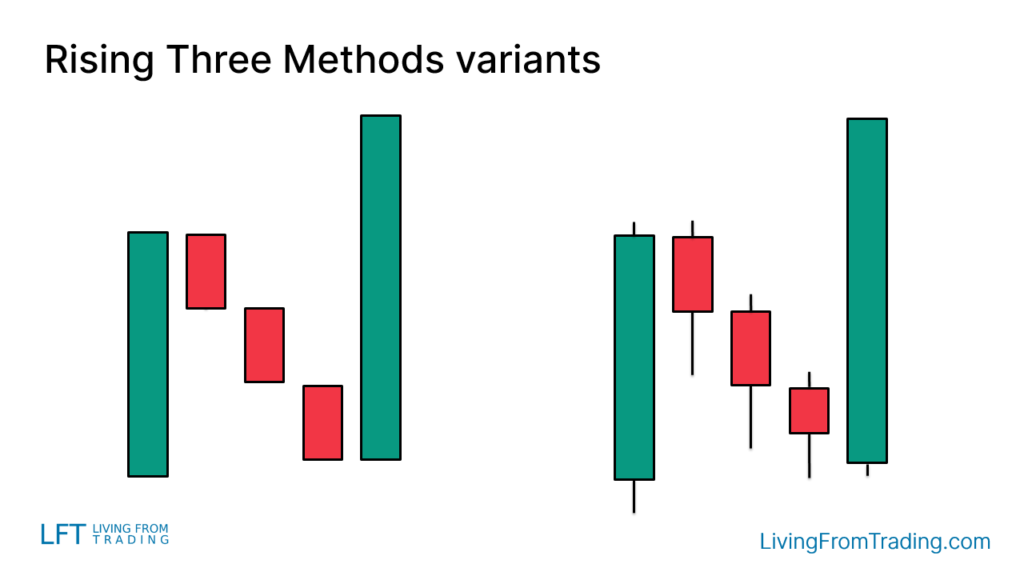
Variations of the Rising Three Methods
The Rising Three Methods pattern may vary on actual charts:
- The length of the candlestick shadows may differ.
- The shadow of the green candlestick should be relatively short, while the shadows of the red candlesticks ideally appear at the bottom of the candlesticks.
How to Trade
To effectively trade the Rising Three Methods pattern, consider the following aspects:
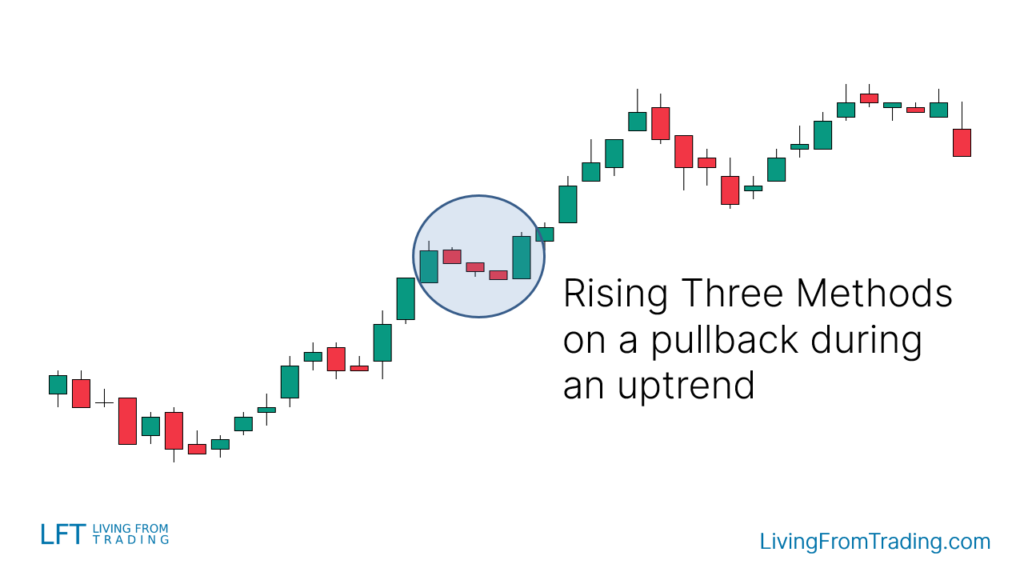
- Position: The location where the pattern appears is crucial. Ideally, it should be seen following an established uptrend.
- Trigger Point: A conservative buy signal occurs when the high of the last candlestick is breached.
- Stop Loss: It is advisable to set a stop loss on the opposite side of the pattern to protect against unexpected market movements.
Trading Strategies
Here are several trading strategies combined with the Rising Three Methods pattern:
Strategy 1: Naked Chart Pullback
Definition: During an uptrend, the price often experiences pullbacks. The Rising Three Methods pattern can help traders find new buying opportunities after the pullback ends.
Method:
- Confirm that the market is in an uptrend.
- Wait for a price pullback and observe if the Rising Three Methods pattern forms.
- Trade Signal: Buy at the breakout point after the pattern forms.
- Stop Loss Setting: Set the stop loss near the lowest point of the pullback to ensure risk is controlled.
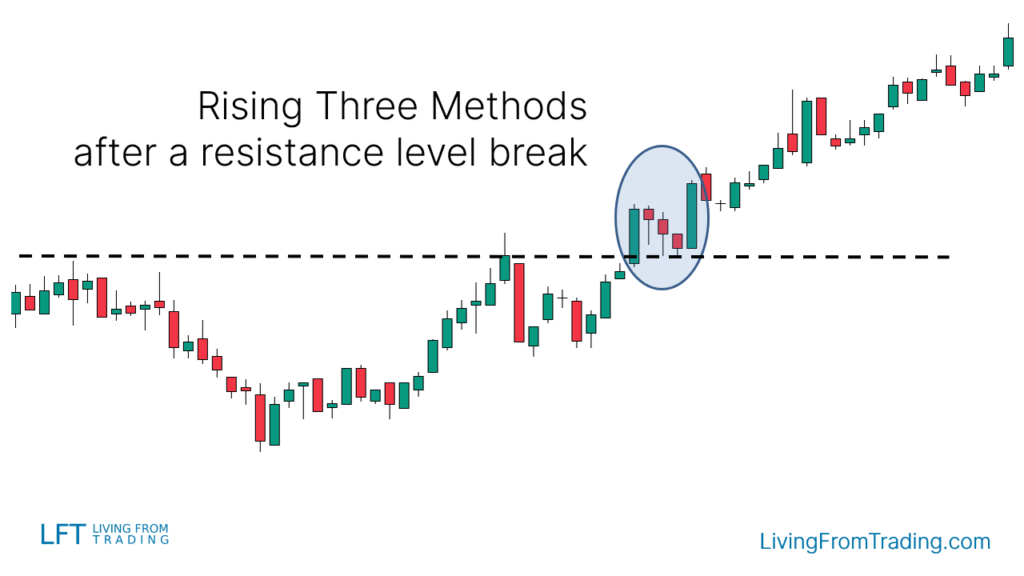
Strategy 2: Combining with Resistance Levels
Definition: Resistance levels are key technical points in an uptrend, and the Rising Three Methods pattern can confirm the continuation of the trend at these points.
Method:
- Mark resistance levels on the chart.
- Wait for the price to break through the resistance level and test it.
- If the Rising Three Methods pattern appears during this retest, consider buying.
- Trade Signal: Buy when the high of the last bullish candle in the pattern is breached.
- Stop Loss Setting: Set the stop loss below the resistance level to prevent the price from falling below it again.
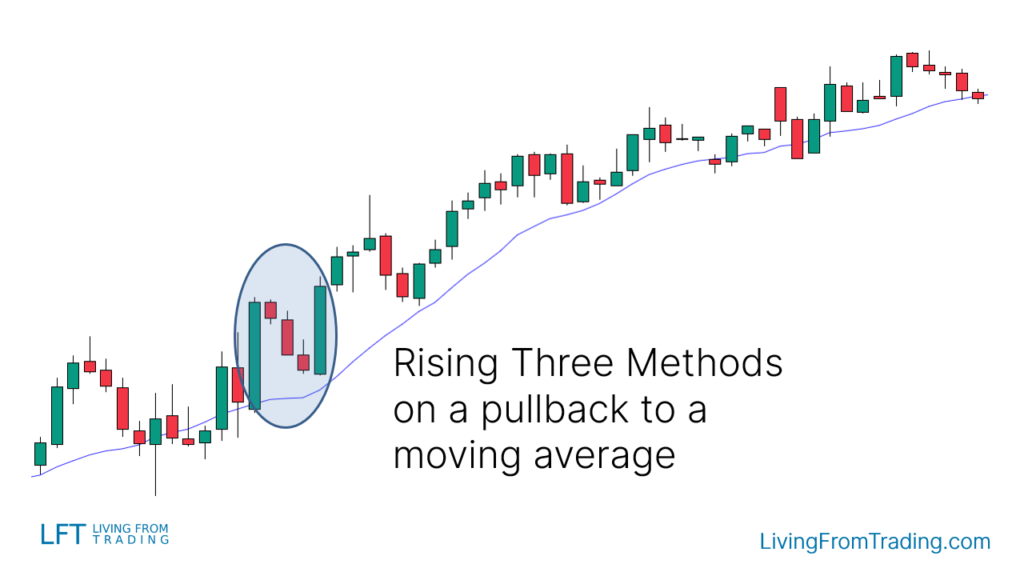
Strategy 3: Combining with Moving Averages
Definition: Moving averages are important tools for tracking trends. In an uptrend, the Rising Three Methods pattern can serve as a buying signal after a moving average pullback.
Method:
- Confirm that the market is in an uptrend and the price is above the moving average.
- Wait for the price to pull back to the moving average and check for the Rising Three Methods pattern.
- Trade Signal: Buy at the breakout point of the last bullish candle in the pattern.
- Stop Loss Setting: Set the stop loss below the moving average to ensure risk management.
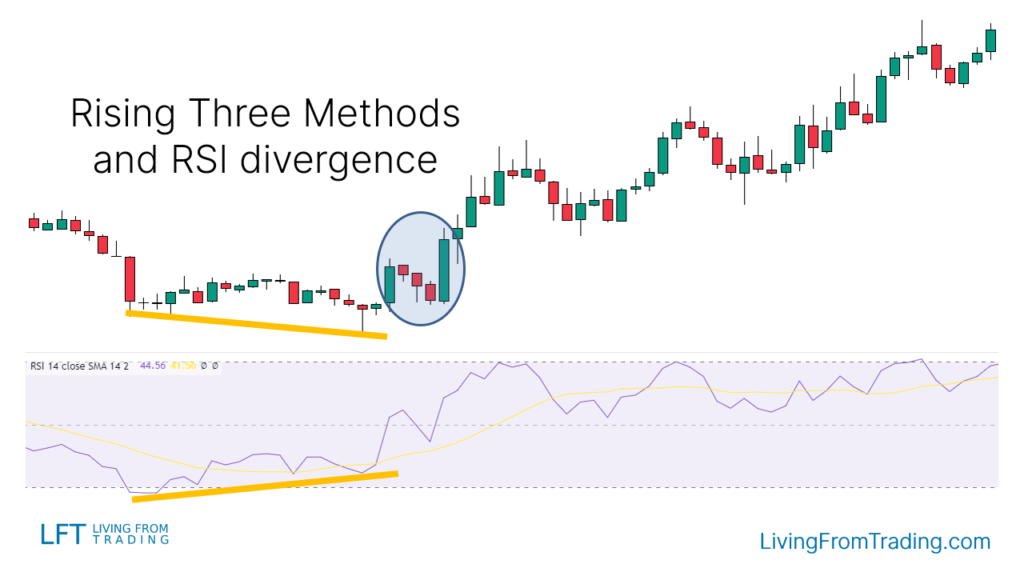
Strategy 4: Combining with RSI Divergence
Definition: RSI divergence can indicate potential reversal points. When RSI divergence occurs during a price decline and the Rising Three Methods pattern appears, it is typically a strong buy signal.
Method:
- Confirm a downtrend in the market and mark price lows.
- Compare the lows of the RSI indicator with price lows to identify divergence signals.
- When the price hits a new low while RSI makes a new high, wait for the Rising Three Methods pattern to form.
- Trade Signal: Buy at the breakout point of the last bullish candle in the pattern.
- Stop Loss Setting: Set the stop loss near the low point of the pattern or the RSI low.
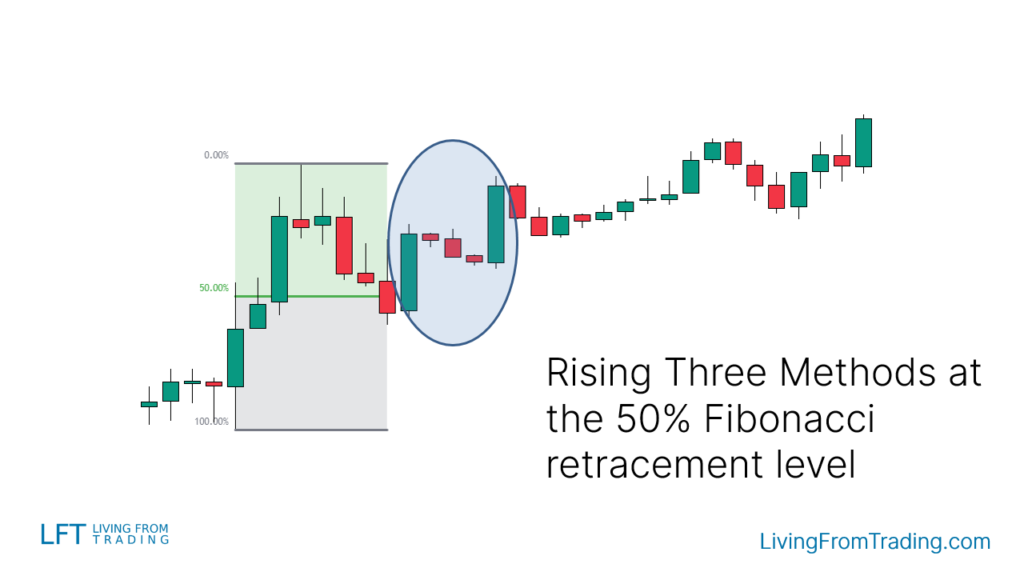
Strategy 5: Combining with Fibonacci Retracement
Definition: Fibonacci retracement levels can help identify potential reversal points. Combining the Rising Three Methods pattern with Fibonacci retracement levels can improve buying accuracy in an uptrend.
Method:
- In an uptrend, use the Fibonacci retracement tool to mark key retracement levels.
- Wait for the price to pull back to key levels and observe if the Rising Three Methods pattern forms.
- Trade Signal: Buy at the breakout point of the last bullish candle in the pattern.
- Stop Loss Setting: Set the stop loss below the Fibonacci retracement level to minimize losses.
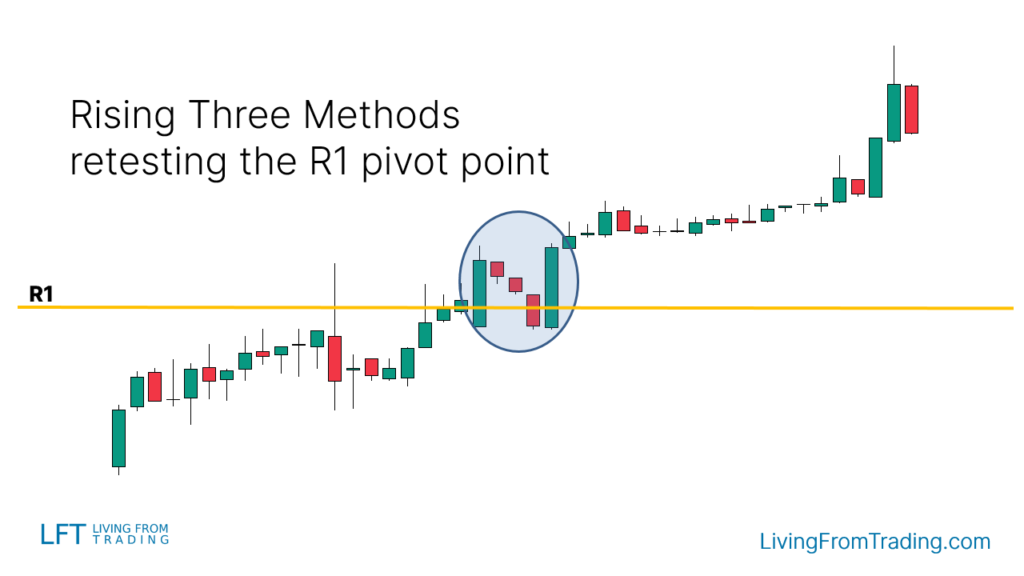
Strategy 6: Combining with Pivot Points
Definition: Pivot points are calculated support and resistance levels. Combining the Rising Three Methods pattern with pivot points can effectively confirm buying opportunities in intraday trading.
Method:
- Activate the pivot point indicator on the chart.
- Observe if the price breaks and tests the pivot point levels.
- If the Rising Three Methods pattern appears, consider buying at the pivot point level.
- Trade Signal: Buy at the breakout point of the last bullish candle in the pattern.
- Stop Loss Setting: Set the stop loss below the pivot point or the nearest support level.
Summary
According to Thomas N. Bulkowski's Encyclopedia of Candlestick Charts, the success rate of the Rising Three Methods pattern is 79%.
The Rising Three Methods is an effective bullish continuation pattern with a high success rate when appearing in an uptrend. By combining with pullbacks, moving averages, RSI divergence, Fibonacci retracement, and pivot points, the accuracy of trading can be improved. However, traders should tailor their strategies based on their experience and market conditions and conduct thorough risk assessments before trading.
Disclaimer: The views in this article are from the original Creator and do not represent the views or position of Hawk Insight. The content of the article is for reference, communication and learning only, and does not constitute investment advice. If it involves copyright issues, please contact us for deletion.