The 3 Best Strategies to Trade the Golden Cross Pattern
Learn the most powerful trading strategies to use with the Golden Cross pattern.This is how to do it and avoid all the common mistakes.

The Golden Cross is a significant chart pattern in technical analysis, commonly viewed as a bullish signal. It is formed when a short-term moving average (MA) crosses above a long-term moving average. However, many novice traders make mistakes due to a lack of effective trading strategies. Below is a detailed analysis of the Golden Cross and three optimal trading strategies.
What is a Golden Cross?
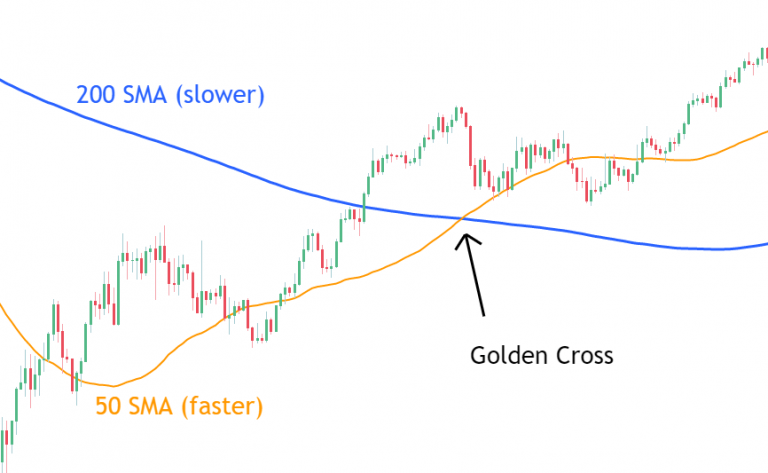
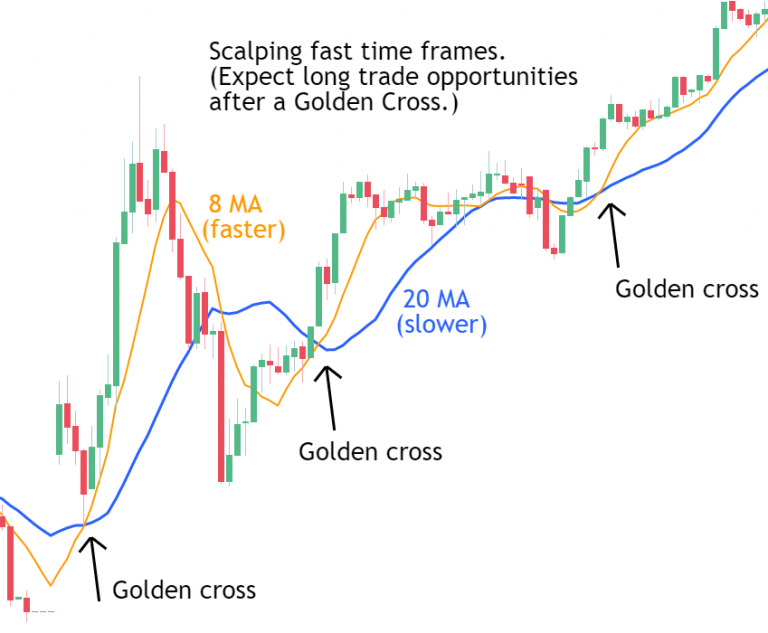
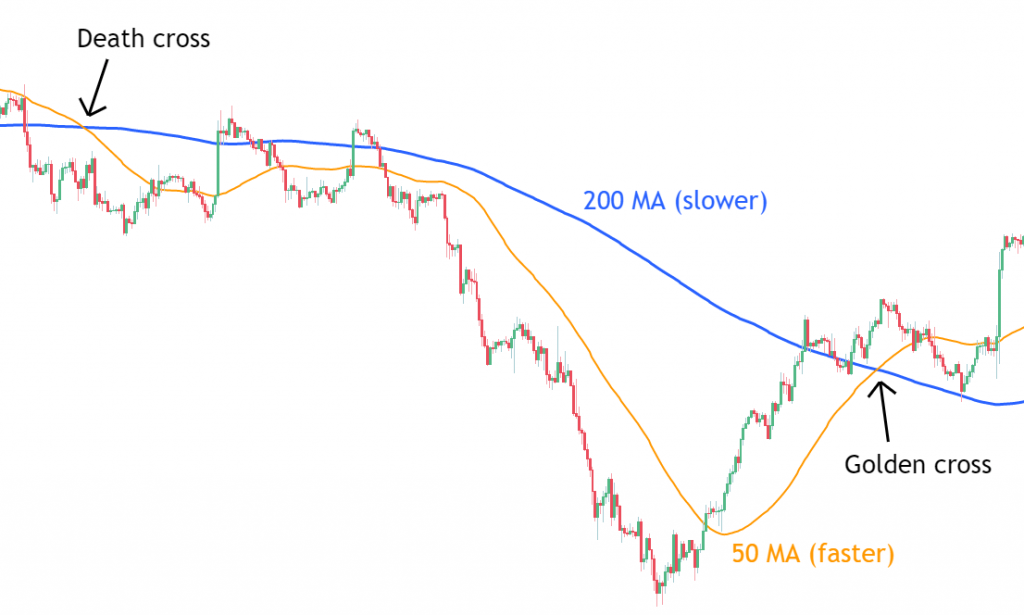
A Golden Cross occurs when a shorter-term moving average (such as the 50-day MA) crosses above a longer-term moving average (such as the 200-day MA) within a given timeframe. This pattern is generally seen as an indication that the market is shifting from a downtrend to an uptrend. Although the 50-day and 200-day MAs are commonly used, traders can choose different periods based on their needs, such as using the 8-day and 20-day MAs for short-term trading.
Market Implications of a Golden Cross
The Golden Cross typically signals the start of a new upward trend, meaning the market is transitioning from a downtrend to an uptrend. However, the Golden Cross signal has inherent lag because moving averages reflect past data, which might delay the true market response.
Limitations of the Golden Cross
-
Lagging Indicator: The Golden Cross is a lagging indicator, reflecting past market movements. By the time the signal appears, the optimal entry point may have already passed. For example, some stocks may have already experienced a rise by the time the Golden Cross signal is generated.
-
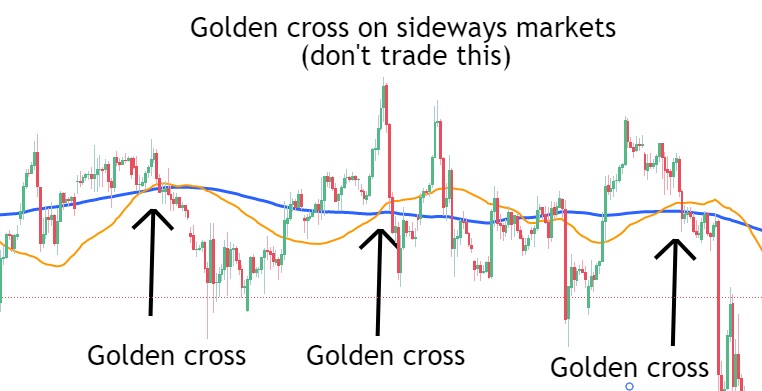
Misleading in Consolidation Markets: In consolidation or sideways markets, where prices hover around moving averages, the Golden Cross signal might be misleading since there is no clear trend direction. In such cases, the signal might fail, leading to trading losses.
-
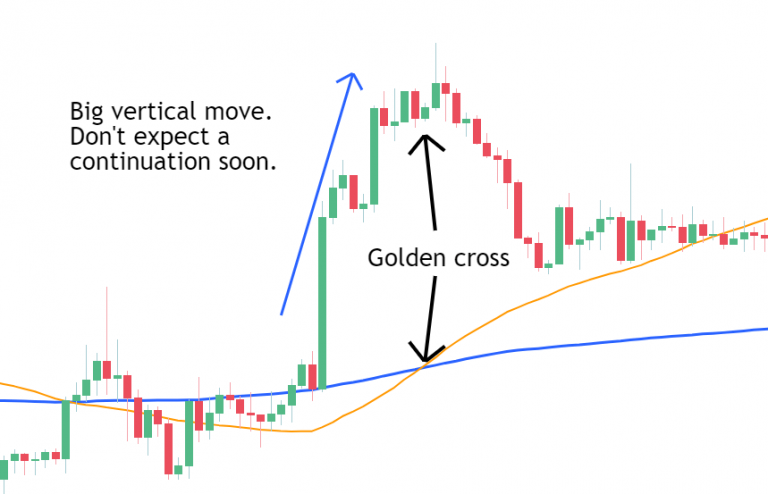
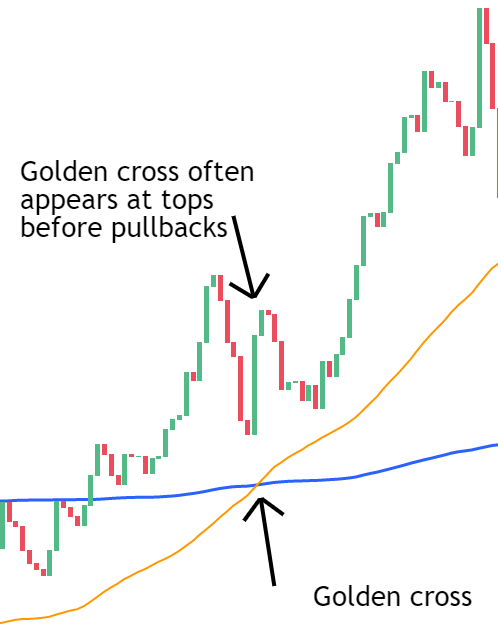
Price Fatigue: After a rapid rise or fall, the market might experience price fatigue. The Golden Cross signal formed during this period may not accurately reflect future market movements. For instance, a Golden Cross signal appearing after a rapid rise might indicate an imminent price correction.
-
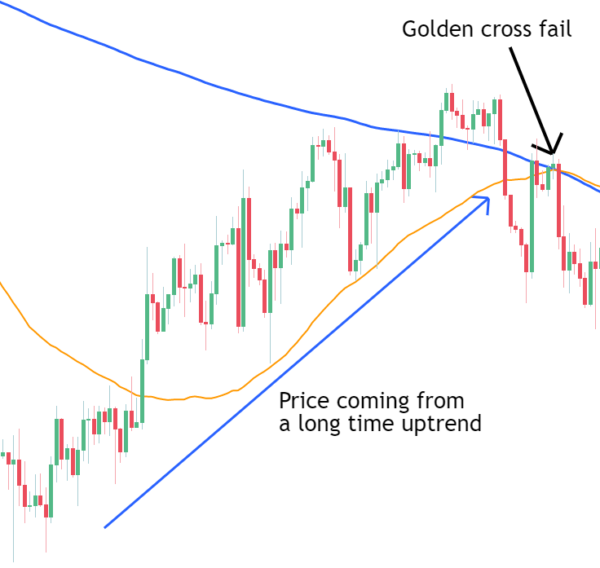
Post-Long-Term Uptrend Corrections: After a prolonged uptrend, prices might correct when approaching the long-term moving average. The Golden Cross signal in this situation might be unreliable, suggesting that traders should consider trading only after prices have stabilized above the long-term moving average.
-
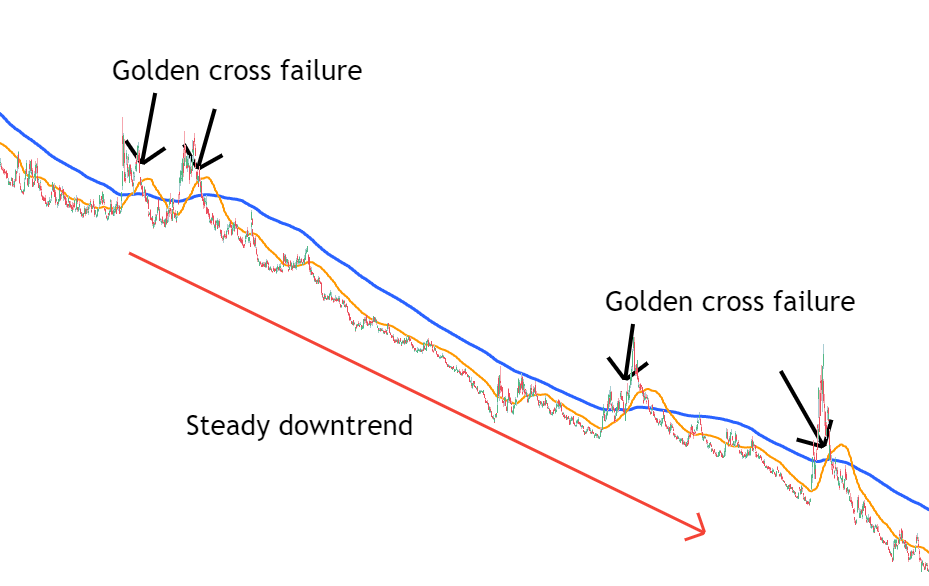
Risk in Downtrending Markets: In a persistent downtrend, a Golden Cross signal might fail since the overall market trend remains downward. Traders should be particularly cautious and avoid making trades during a downtrend based on such signals.
Comparison of Golden Cross and Death Cross
The Death Cross is the opposite of the Golden Cross, occurring when the short-term MA crosses below the long-term MA, signaling a potential downtrend. Traders can use the Golden Cross to identify long opportunities and the Death Cross for short opportunities. Comparing both can help traders better grasp market trend changes.
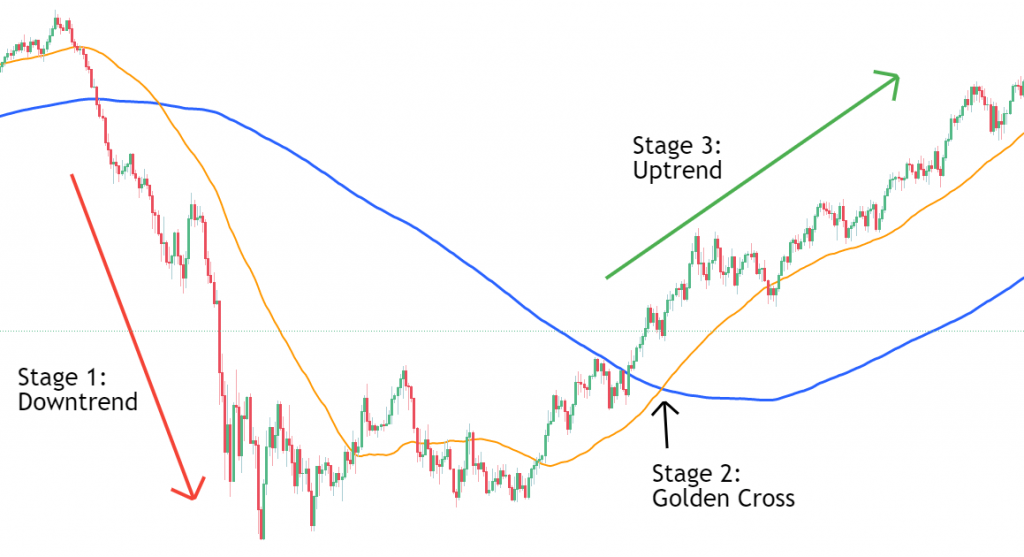
Three Stages of the Golden Cross
Stage One: Downtrend Phase
The market is in a downtrend, with prices below the long-term moving average. Traders need to wait for prices to stop falling and start approaching the long-term moving average. This stage is preparatory for identifying signals.
Stage Two: Golden Cross Confirmation
Prices break above the long-term moving average, with the short-term MA also moving upward, forming the Golden Cross signal. This stage confirms the Golden Cross and marks the beginning of an uptrend.
Stage Three: Trend Following
After confirming the Golden Cross signal, traders can start following the uptrend with long trades. At this stage, the market shows strong upward momentum, and traders should adjust their strategies to focus on long positions.
Trading Large Trends Using the Golden Cross Signal
When prices are above the moving averages, maintain long positions until a bearish signal (such as a Death Cross) appears. This strategy helps traders maximize profits and capture large trends. Note that this approach may miss some short-term trading opportunities, but it is more effective for capturing long-term trends.
Three Optimal Trading Strategies for the Golden Cross
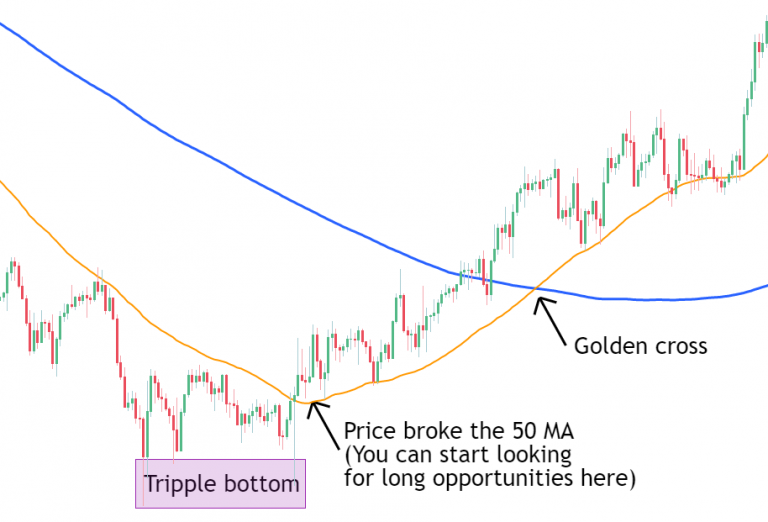
Preemptive Golden Cross Strategy
- Strategy Overview: Since the Golden Cross is a lagging indicator, anticipate the signal’s appearance. Traders can wait for prices to break above the short-term moving average during a strong downtrend and then shift to a long position.
- Execution Steps: Monitor the distance between the short-term and long-term moving averages and select an appropriate entry point. Consider entering early when the short-term MA starts to move upward, especially if reversal patterns (like head and shoulders, double bottoms, or triple bottoms) appear.
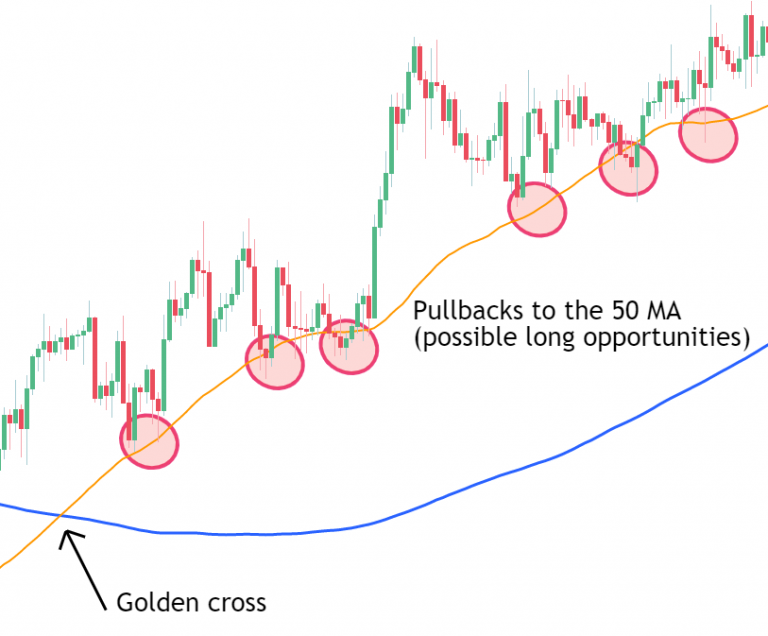
Entry Near the 50-MA Pullback
- Strategy Overview: After the Golden Cross, prices often pull back to near the short-term moving average, providing a buying opportunity.
- Execution Steps: Wait for prices to pull back to near the short-term moving average, then look for bullish reversal patterns. If a reversal signal appears, consider entering a trade. This method helps enter the market early in the trend, reducing risk and increasing potential profit.
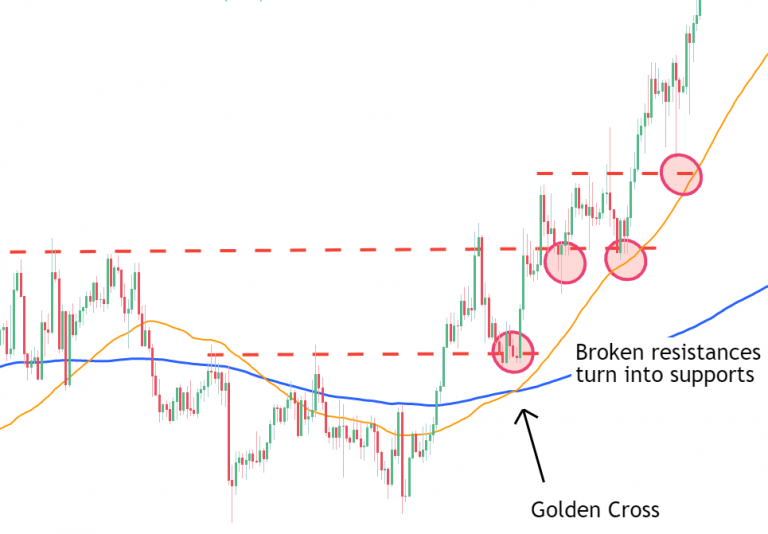
Testing Previous Resistance Turned Support
- Strategy Overview: After breaking through resistance, prices often retest it, turning it into new support. Traders can use this information by observing whether prices test and rebound off the previous resistance turned support after the Golden Cross.
- Execution Steps: Wait for the Golden Cross signal and a price breakout above the previous resistance. Then, observe whether prices pull back to test the former resistance turned support and enter a trade once support is confirmed.
Disclaimer: The views in this article are from the original Creator and do not represent the views or position of Hawk Insight. The content of the article is for reference, communication and learning only, and does not constitute investment advice. If it involves copyright issues, please contact us for deletion.