Three Outside Up Candlestick Pattern - What Is And How To Trade
Learn all about the Three Outside Up candlestick pattern.What is, how to trade, and all the best trading strategies.

In the field of technical analysis, candlestick patterns are a key tool for investors to predict market trends. Today, we will delve into the "Three Outside Up" candlestick pattern, which is a bullish reversal pattern that typically appears after a price decline, indicating a rejection of lower prices.
Definition of the Three Outside Up
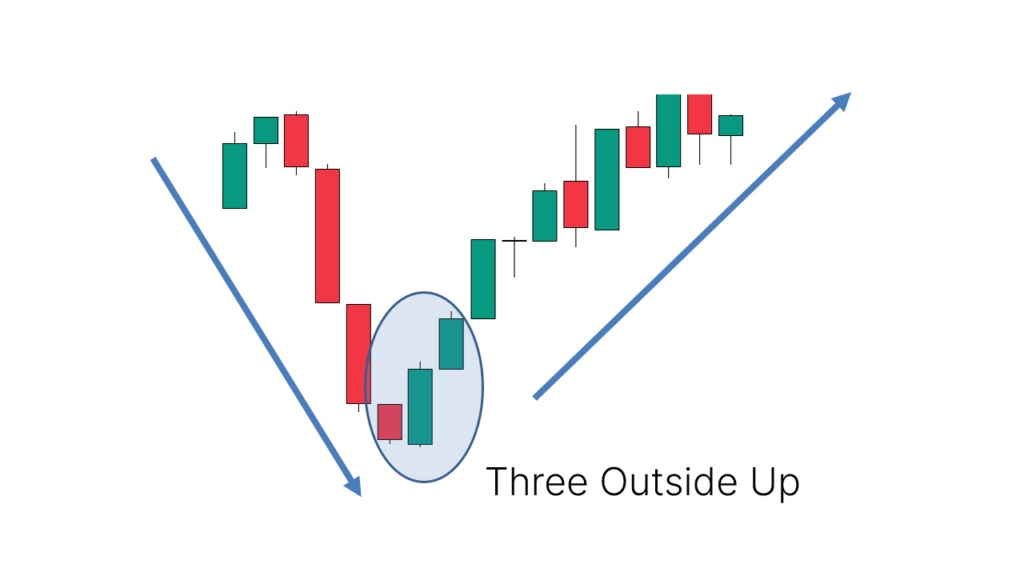
The Three Outside Up is a Japanese candlestick pattern and is a bullish reversal pattern. This pattern usually appears after a price decline, suggesting that the price may reverse to the upside. The bullish nature of this pattern stems from the expectation of a bull move after the Three Outside Up appears in the right location. As it is a reversal pattern, we want to see the price going down before the Three Outside Up appears, making it a common signal of the end of a trend.
How to Identify the Three Outside Up
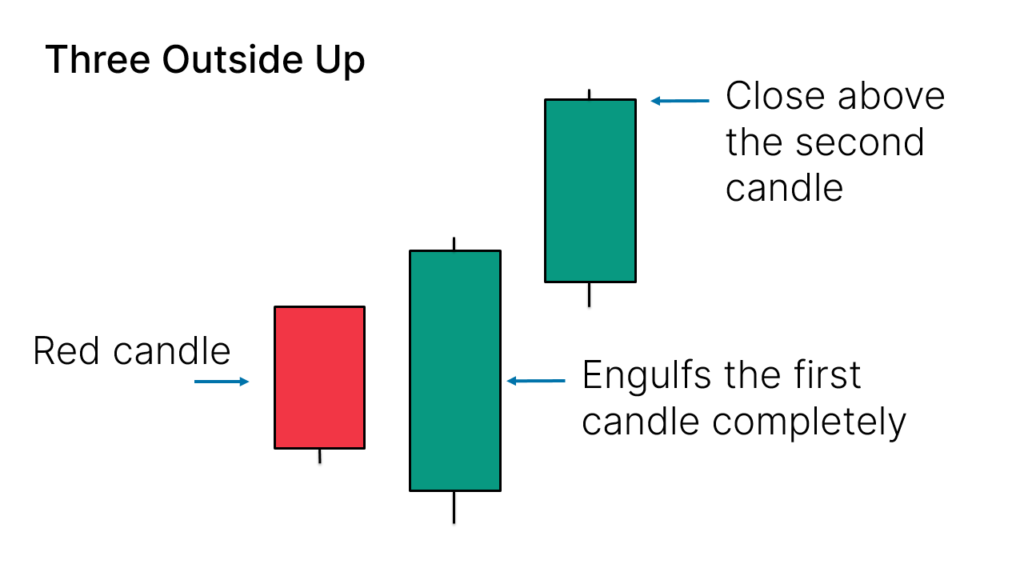
The Three Outside Up candlestick pattern is composed of three candles, and the identification method is as follows:
- The first candle is a small bearish candle.
- The second candle is a bullish candle that completely engulfs the first one.
- The third candle is a bullish candle that closes above the others.
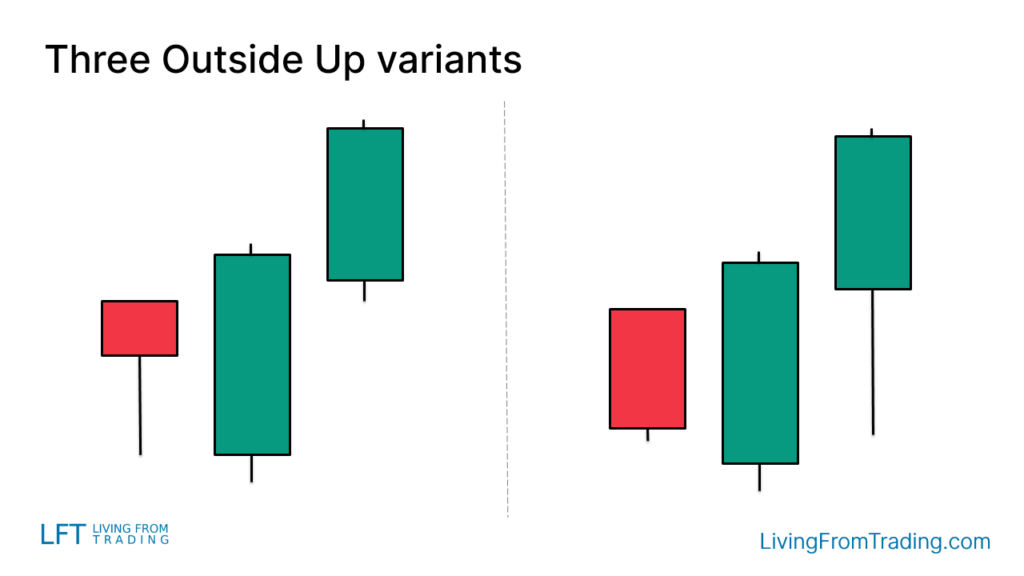
Variants of the Three Outside Up
On the chart, the Three Outside Up candlestick pattern may look slightly different, for example:
- These candles may have long wicks at the bottom, similar to hammer candles.
How to Trade
Trading ‘Three Outside Up’ patterns is not just about finding patterns of the same shape on a chart. The key is where the pattern appears. A valid pattern needs to appear after a price drop to indicate a possible reversal to the upside.
The trading strategy is as follows:
- Long positions can be triggered conservatively when price breaks above the high of the last candlestick.
- At the same time, stop loss orders can be used in order to protect the investment. A common stop loss setting is to place the stop on the other side of the pattern.
Trading Strategies
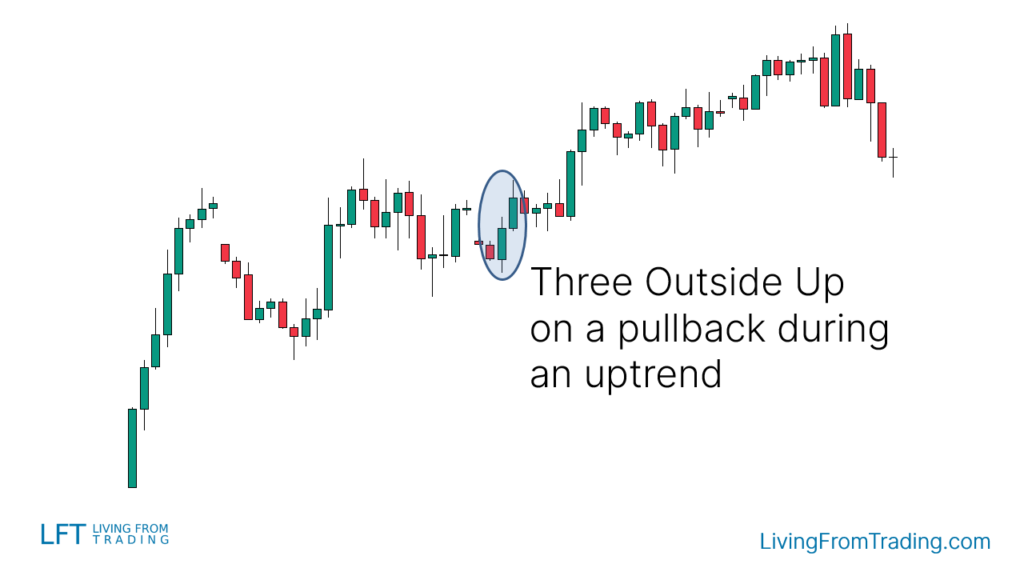
Strategy 1: Pullbacks on Naked Charts
- In an uptrend, wait for the price to retrace and then look for a ‘Three Outside Up’, which usually signals the end of the retracement and the beginning of a new uptrend.
- For example, suppose a stock in an uptrend pulls back to its 50-day moving average, the appearance of Three Outside Up could be considered a buy signal.
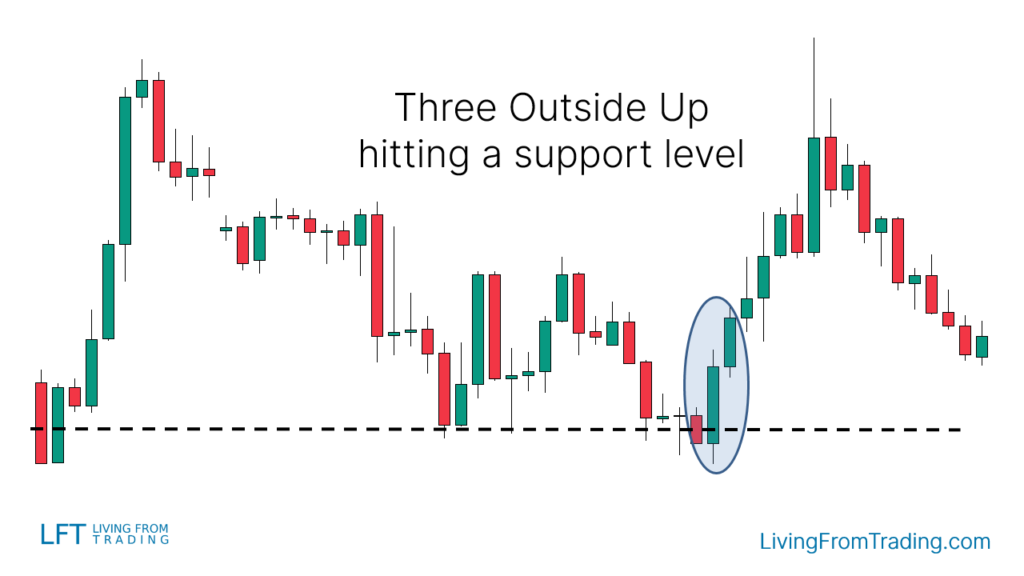
Strategy 2: Trading with Support Levels
- Plot the support level on the chart, wait for price to fall to the support level and check for a Three Outside Up.
- If price appears Three Outside Up at a support level, one can go long when price breaks above the high of the last candlestick.
- For example, assuming a stock has a Three Outside Up pattern at a key support level, you can buy when price breaks through the high of the pattern.
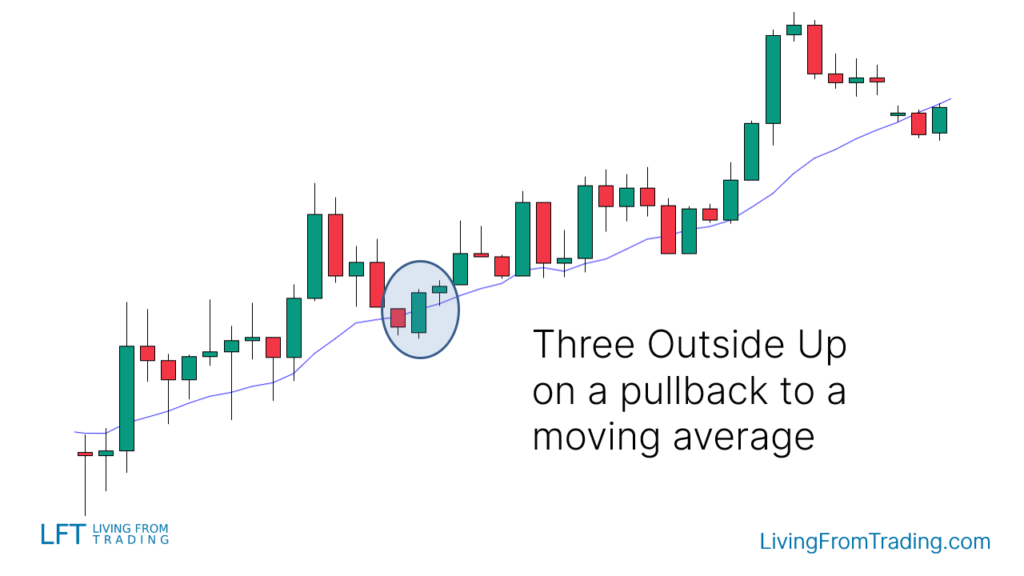
Strategy 3: Trading with Moving Averages
- In an uptrend, wait for the price to retrace to the moving average and check for a Three Outside Up.
- If the price appears Three Outside Up near the moving average, one can go long when the price breaks above the high of the last candlestick.
- For example, assuming a stock has Three Outside Up near the 20-day moving average, one can buy when the price breaks above the high of the pattern.
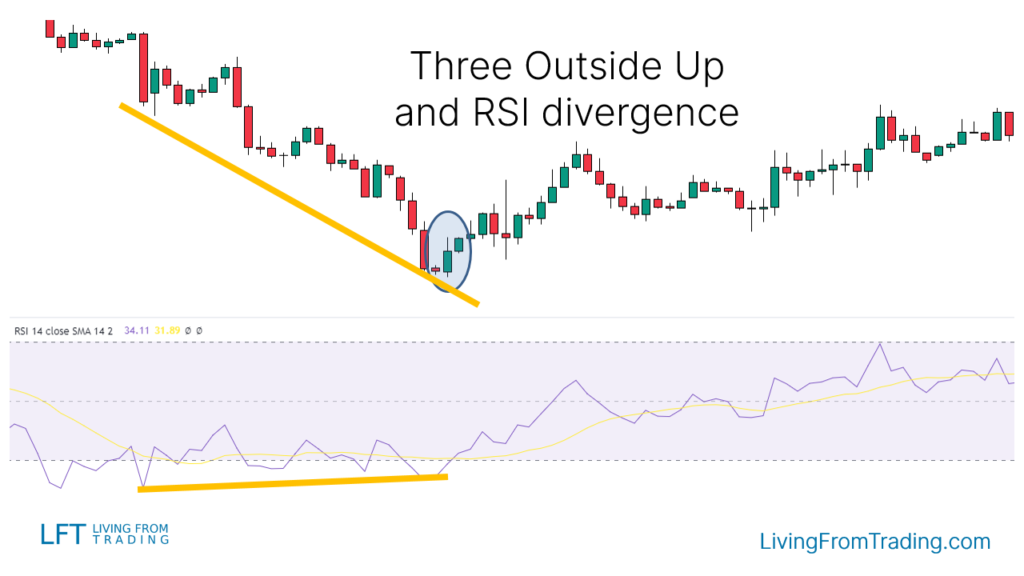
Strategy 4: Trading with RSI Divergences
This is slightly different from other trading strategies. To find a bullish RSI divergence, we first want to see price in a downtrend, making lower lows and lower highs.
- In a downtrend, look for situations where price makes a new low but the RSI indicator does not.
- When Three Outside Up occurs when price makes a new low and the RSI indicator makes a new high, you can go long.
- For example, assuming a stock has a Three Outside Up with RSI divergence, you can buy when price breaks above the high of the pattern.
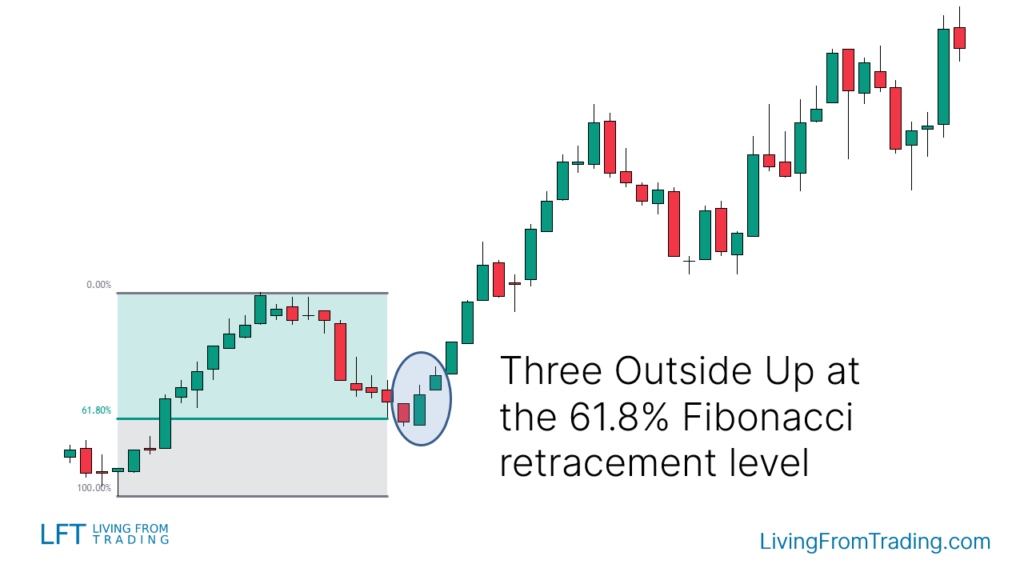
Strategy 5: Trading with Fibonacci
Another popular way of trading the Three Outside Up candlestick pattern is using the Fibonacci retracement tool. Fibonacci shows retracement levels where the price tends to revert frequently. Depending on the strength of the trend, different levels may work better with the Three Outside Up pattern.
- Use the Fibonacci Retracement tool to wait for a price pullback in an uptrend and go long on a Three Outside Up at the Fibonacci level.
- For example, assuming a stock has a Three Outside Up at the 50% Fibonacci retracement level, one can buy when the price breaks above the high of the pattern.
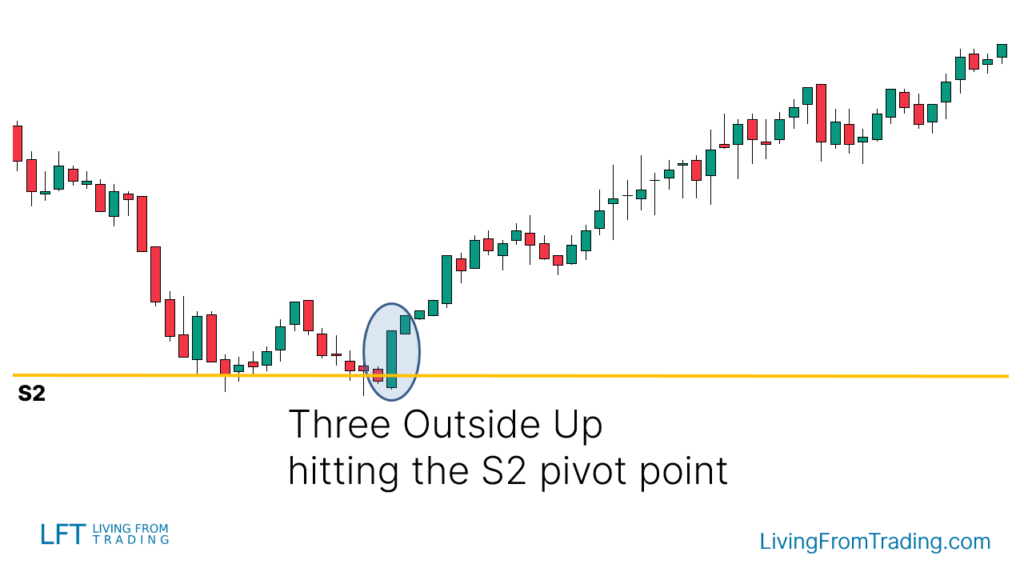
Strategy 6: Trading with Pivot Points
Pivot Points are automatic support and resistance levels calculated using mathematical formulas. If you are day trading, the Daily Pivot Points are the most popular, although the Weekly and Monthly are also frequently used.
- Activate the Pivot Point Indicator and wait for price to pull back to the Pivot Point level and go long when a ‘three out and up’ pattern occurs at that level.
- For example, assuming a stock has a ‘three out and up’ pattern at the daily pivot point level, you can buy when the price breaks above the high of the pattern.
Summary
The Three Outside Up is a three-candle pattern. To be valid, it must appear after a move to the downside. It is a bullish reversal pattern, meaning that it signals a potential reversal to the upside. To increase accuracy, you can trade the Three Outside Up using pullbacks, moving averages, and other trading indicators. The success rate of the Three Outside Up is 75%.
Disclaimer: The views in this article are from the original Creator and do not represent the views or position of Hawk Insight. The content of the article is for reference, communication and learning only, and does not constitute investment advice. If it involves copyright issues, please contact us for deletion.


