Three Inside Down Candlestick Pattern - What Is And How To Trade
Learn all about the Three Inside Down candlestick pattern.What is, how to trade, and all the best trading strategies.
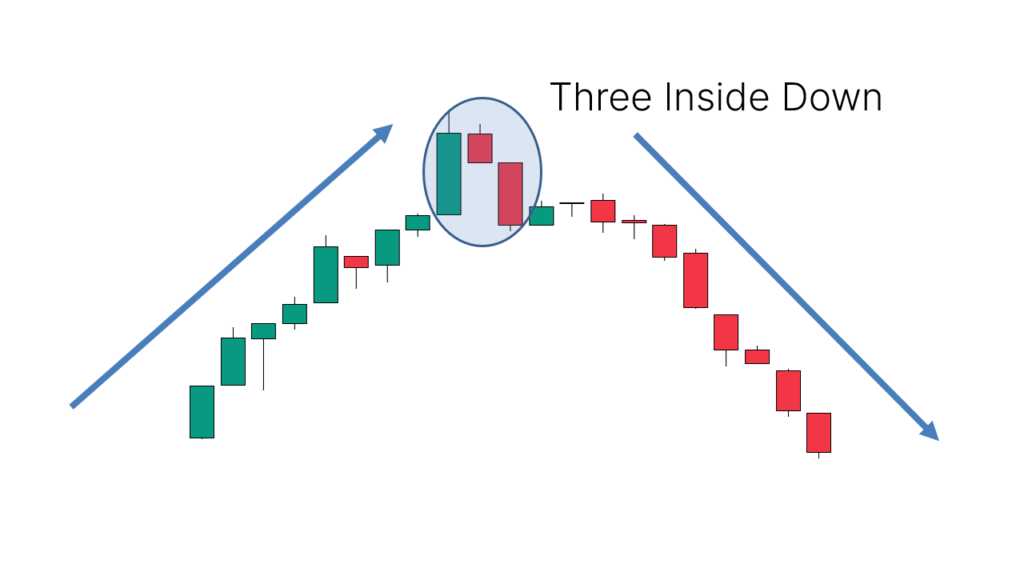
The Three Inside Down is a Japanese candlestick pattern and a bearish reversal formation. It typically appears at the high of a price uptrend, indicating rejection from higher prices. This pattern suggests that the price may turn downward after the Three Inside Down appears, often marking the end of an uptrend. It is also the mirrored version of the Three Inside Up candlestick pattern.
How to Identify the Three Inside Down Candlestick Pattern
The Three Inside Down consists of three candlesticks. Here’s how to identify it:
- The first candlestick must be bullish.
- The second candlestick must be bearish, with its closing price below half the body of the first candlestick.
- The third candlestick's closing price must be lower than the first candlestick's closing price.
_2630827782_888.png)
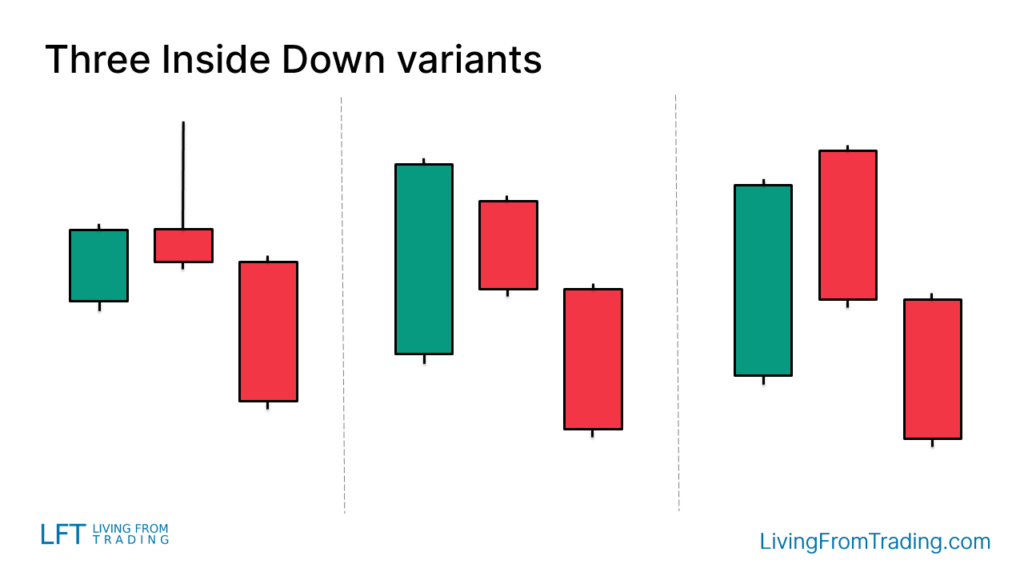
Variants of the Three Inside Down Candlestick Pattern
The Three Inside Down pattern may have variations on the chart:
- The second candlestick may have a long upper shadow.
- The second candlestick may be entirely within the body of the first candlestick.
- The second candlestick may open with a gap, above the first candlestick.
How to Trade
Finding a series of candlesticks with the same shape on the chart is insufficient; the key lies in the location of the pattern. Ideally, we want the price to rise before the Three Inside Down appears, indicating a potential reversal to the downside.
The critical point for trading the Three Inside Down is to short when the low of the last candlestick is broken. This is a conservative short trigger. Additionally, setting a stop loss is essential for protection, typically on the other side of the pattern.
Trading Strategies
To improve accuracy, the Three Inside Down can be combined with other technical analysis tools or indicators.
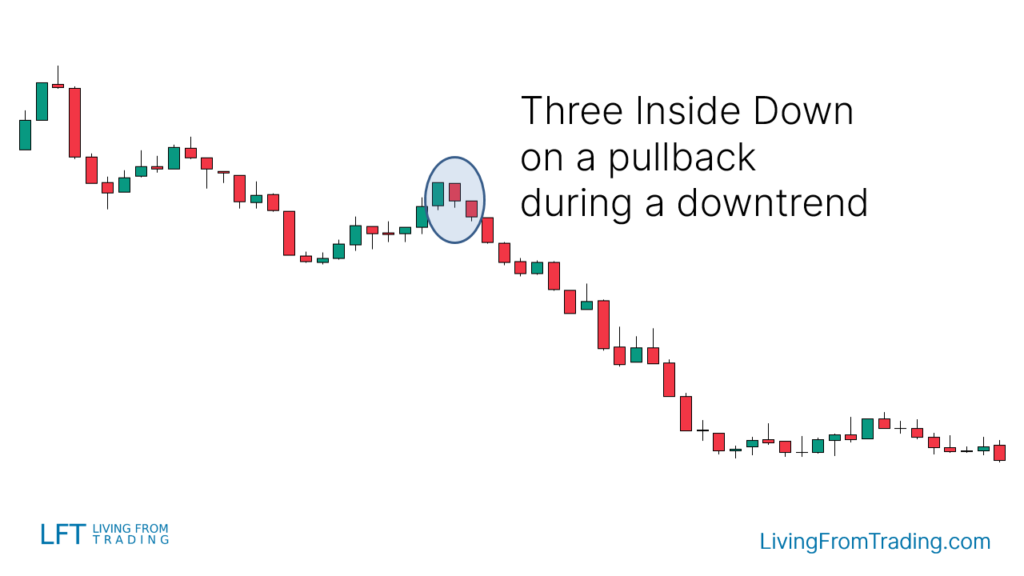
Strategy 1: Pullbacks on Naked Charts
As a bearish reversal pattern, the Three Inside Down is a great pattern to watch for when the price is in a downtrend. Wait for a pullback to start and then spot the Three Inside Down at the end of the pullback, signaling the start of a new leg downwards.
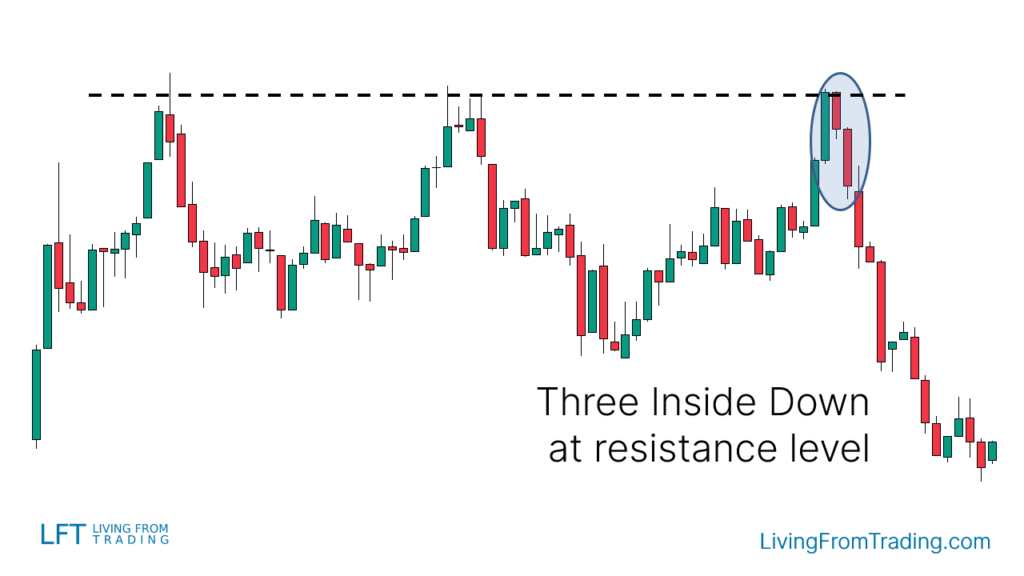
Strategy 2: Trading with Resistance Levels
Resistance levels are excellent places to find price reversals. Draw resistance levels on your charts, wait for the price to rise and hit the resistance level, check if a Three Inside Down appears at that level, and short when the price breaks the low of the last candlestick.
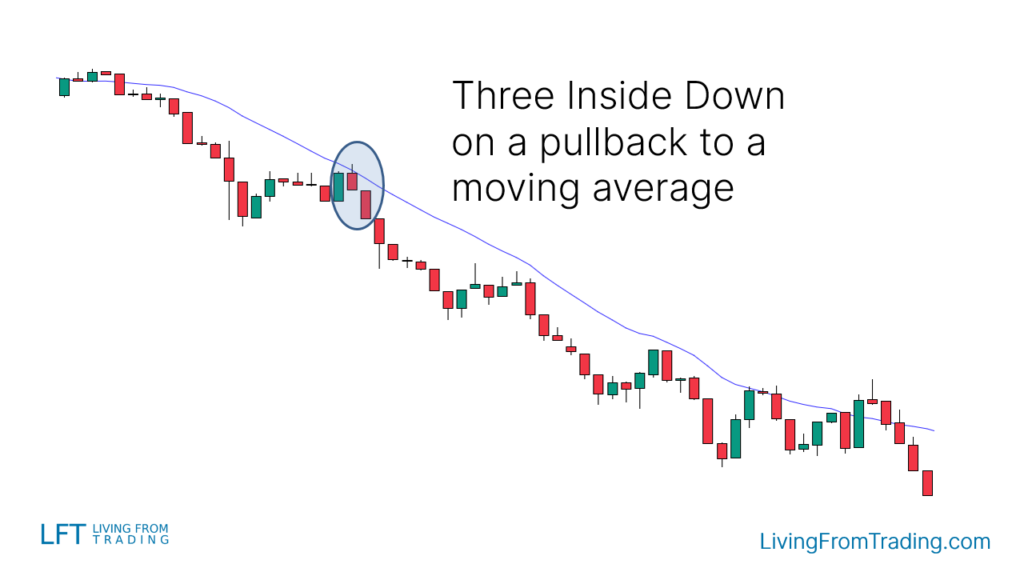
Strategy 3: Trading with Moving Averages
Moving averages are great trend trading indicators. Identify a downtrend with the price below a moving average, wait for the price to rise and hit the moving average, check if a Three Inside Down appears, and short when the price breaks the low of the last candlestick.
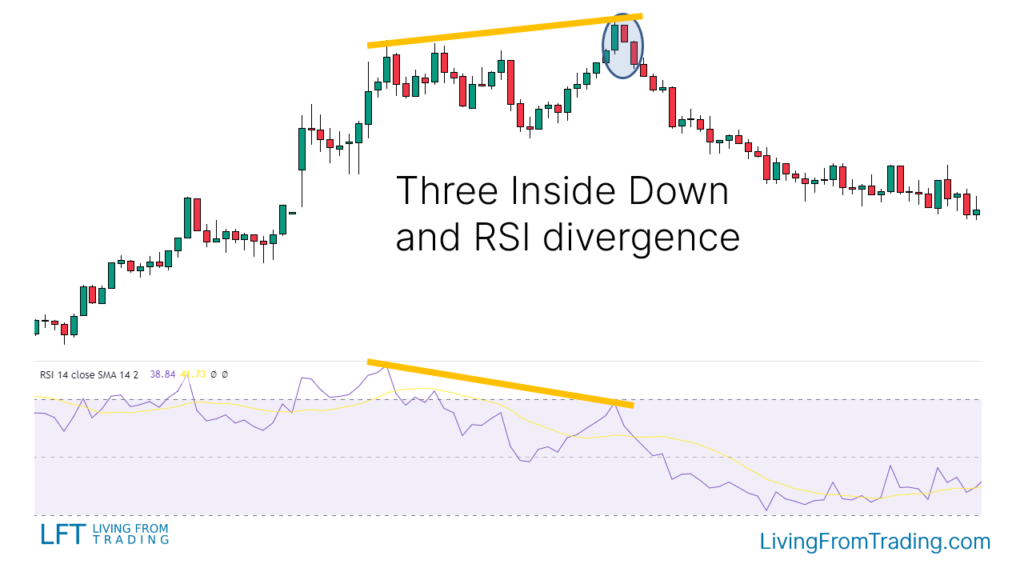
Strategy 4: Trading RSI Divergences
Look for RSI divergence in an uptrend, mark each high after a leg up, compare the price highs with the RSI indicator, and when the RSI makes lower highs while the price makes higher highs, wait for a Three Inside Down at the price high. Short when the price breaks the low of the last candlestick.
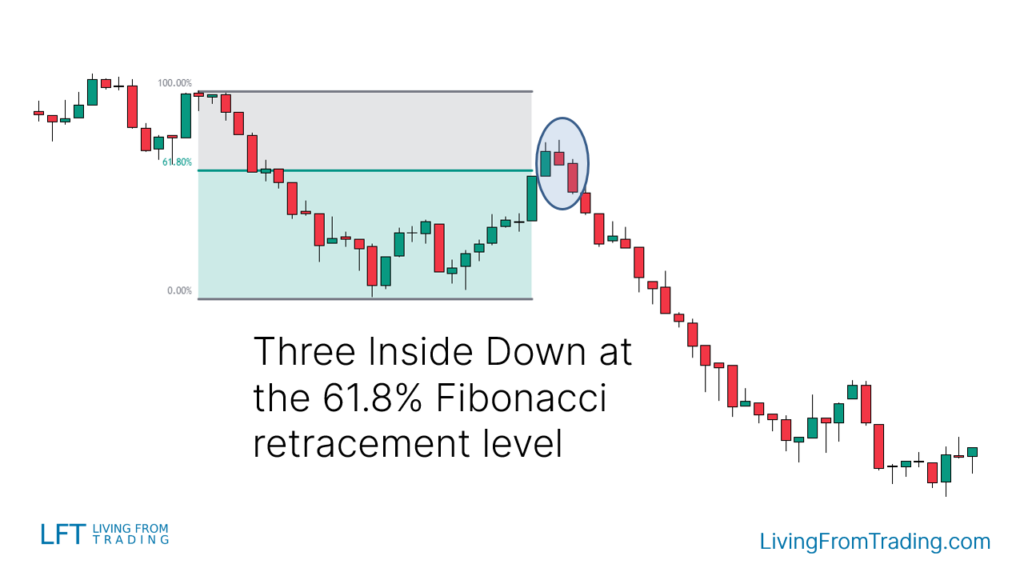
Strategy 5: Trading with Fibonacci
Use the Fibonacci retracement tool to identify potential reversal levels. Wait for an upward move in a downtrend, draw Fibonacci levels from high to low, and when the price hits a Fibonacci level and forms a Three Inside Down, short when the price breaks the low of the last candlestick.
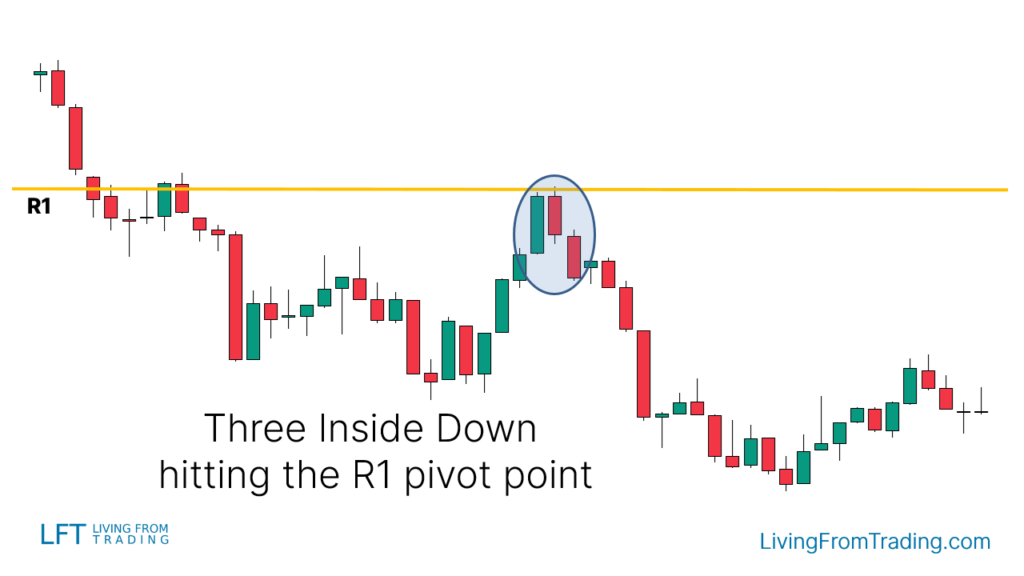
Strategy 6: Trading with Pivot Points
Pivot Points are automatic support and resistance levels. Enable the Pivot Points indicator on your charts, identify resistance levels above the price, wait for the price to rise to a Pivot Point level, and when a Three Inside Down appears, short when the price breaks the low of the last candlestick.
Conclusion
Three Inside Down is a common bearish reversal K-line pattern that usually occurs at a high level after a price rise, signalling a possible reversal lower.
Studies have shown that this pattern has a 69% success rate. By mastering the Three Inside Down identification and trading methodology, investors can capture market reversal signals more effectively.
Disclaimer: The views in this article are from the original Creator and do not represent the views or position of Hawk Insight. The content of the article is for reference, communication and learning only, and does not constitute investment advice. If it involves copyright issues, please contact us for deletion.