Morning Star Candlestick Pattern - What Is And How To Trade
Learn all about the Morning Star candlestick pattern.What is, how to trade, and all the best trading strategies.
The “Morning Star” candlestick pattern is a classic bullish reversal pattern widely used in technical analysis. This article provides a comprehensive analysis of the “Morning Star” candlestick pattern, including its definition, identification methods, variants, trading strategies, and success rate.
Definition of the “Morning Star” Candlestick Pattern
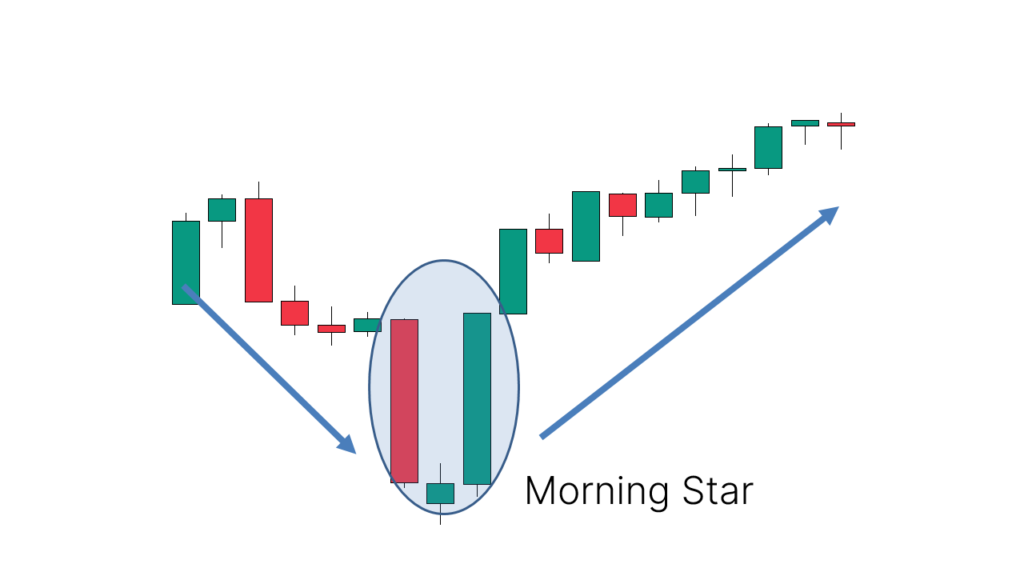
Definition:The “Morning Star” is a bullish reversal pattern typically seen after a price decline, indicating market rejection of lower prices. This pattern suggests that prices may reverse upwards and is often viewed as a signal of the end of a downtrend. It is the mirror image of the “Evening Star” pattern, representing a reversal signal after a downtrend.
Characteristics:
- Bullish Signal: Indicates potential price increase.
- Reversal Pattern: Appears after a downtrend, showing a possible trend reversal.
How to Identify the “Morning Star” Candlestick Pattern
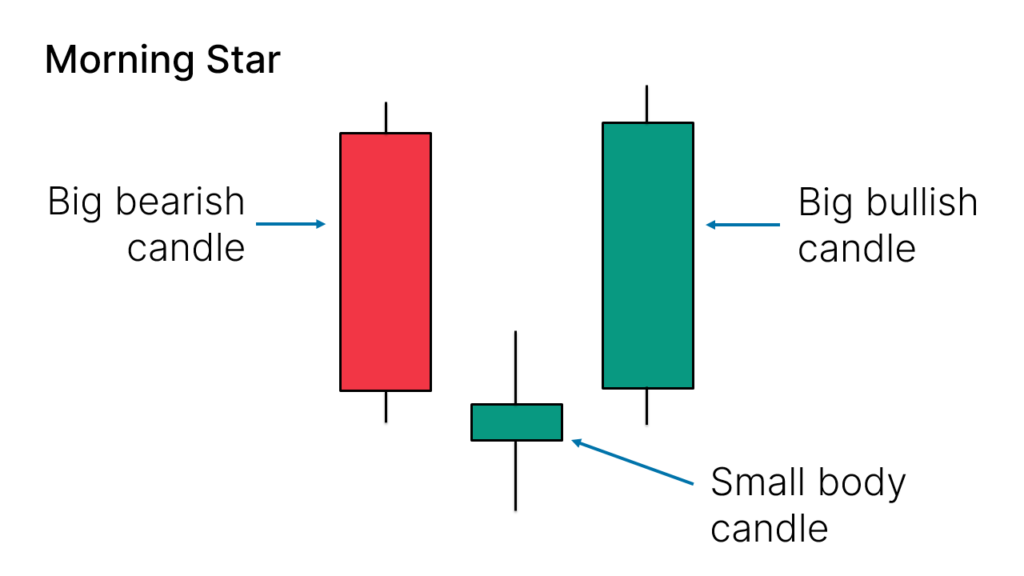
The “Morning Star” candlestick pattern consists of three candles. The identification method is as follows:
- First Candle: Must be a bearish candle.
- Third Candle: Must be a bullish candle.
- Second Candle: Should be smaller compared to the other two candles, such as a Doji or Spinning Top; its color is not important.
- Ideal Condition: The body of the second candle should not overlap with the bodies of the other two candles.
Variants of the “Morning Star” Candlestick Pattern
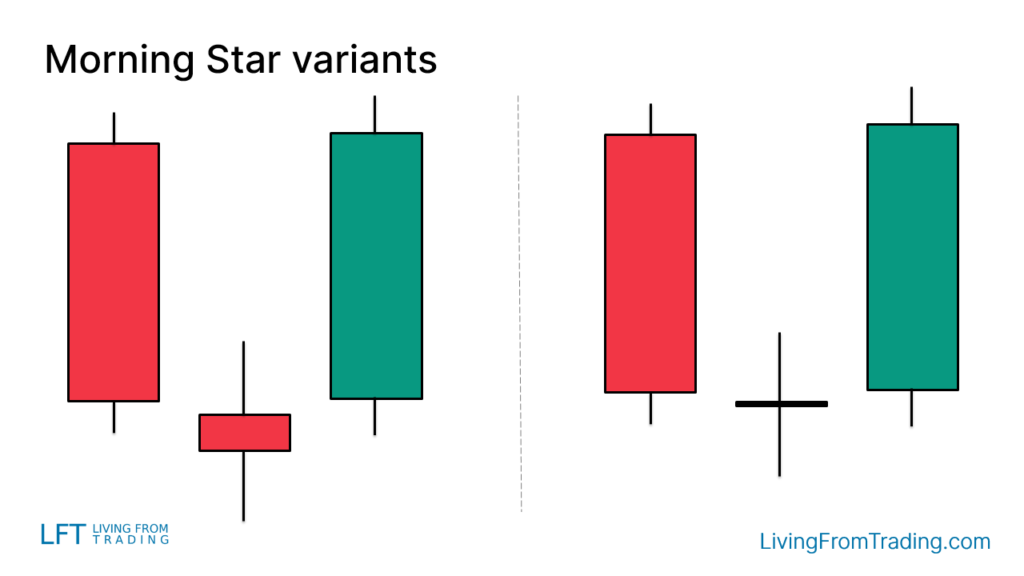
In practice, the “Morning Star” pattern may appear differently:
- Color of the Second Candle: It can be red or green (bearish or bullish), or it may have no body, only small wicks above and below.
How to Trade
Trading the “Morning Star” pattern requires more than just identifying a similar shape; it also involves considering where the pattern appears. Below are specific trading strategies:
1. Confirming the Reversal Signal:
- Market Conditions: Ensure the “Morning Star” pattern appears after a downtrend to confirm its validity as a bullish reversal signal.
- Trade Trigger: Enter a trade when the high of the third candle is broken.
2. Stop-Loss Setting:
- Stop-Loss Position: Typically set on the opposite side of the pattern, such as above the second candle, to protect against unexpected market movements.
Trading Strategies
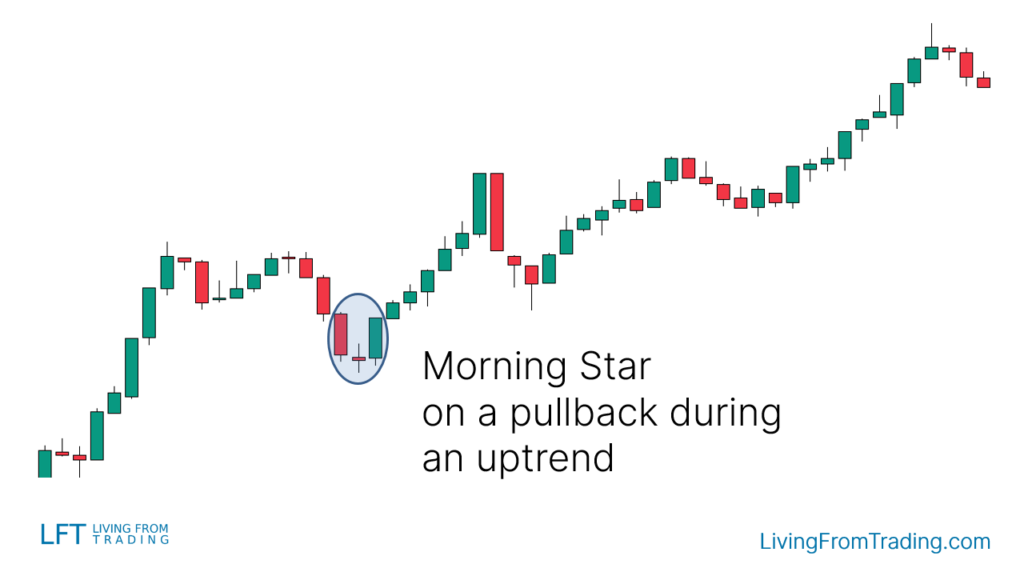
Strategy 1: Pullbacks on Naked Charts
As a bullish reversal pattern, the “Morning Star” is effective when the price is in an uptrend. Wait for a pullback to begin and then look for the “Morning Star” to appear, which often signals the end of the pullback and the start of a new upward leg.
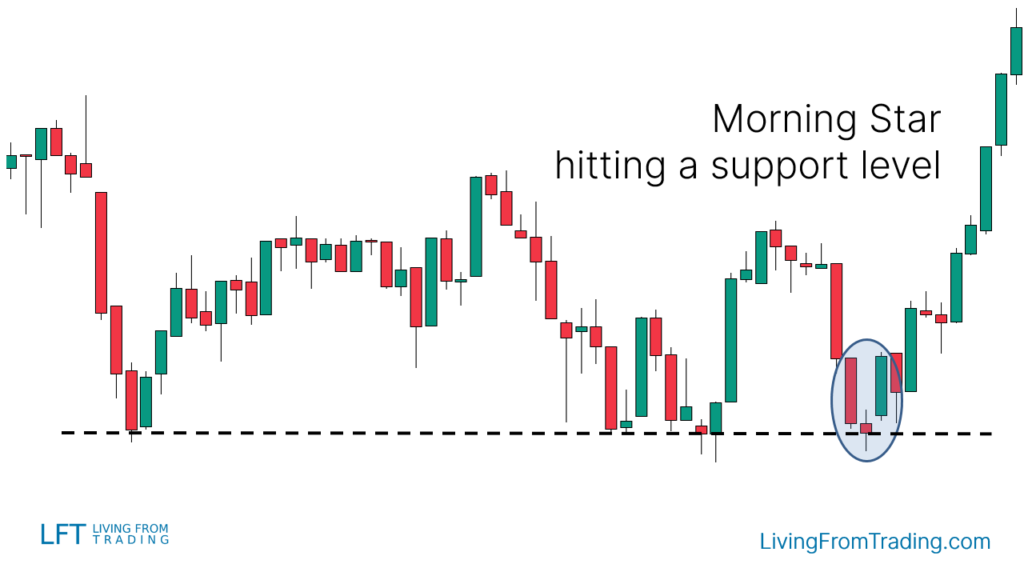
Strategy 2: Trading with Support Levels
Support levels are key areas for price reversals. Follow these steps:
- Draw support levels on your charts.
- Wait for the price to decline to the support level.
- If a “Morning Star” pattern appears at that level, consider going long.
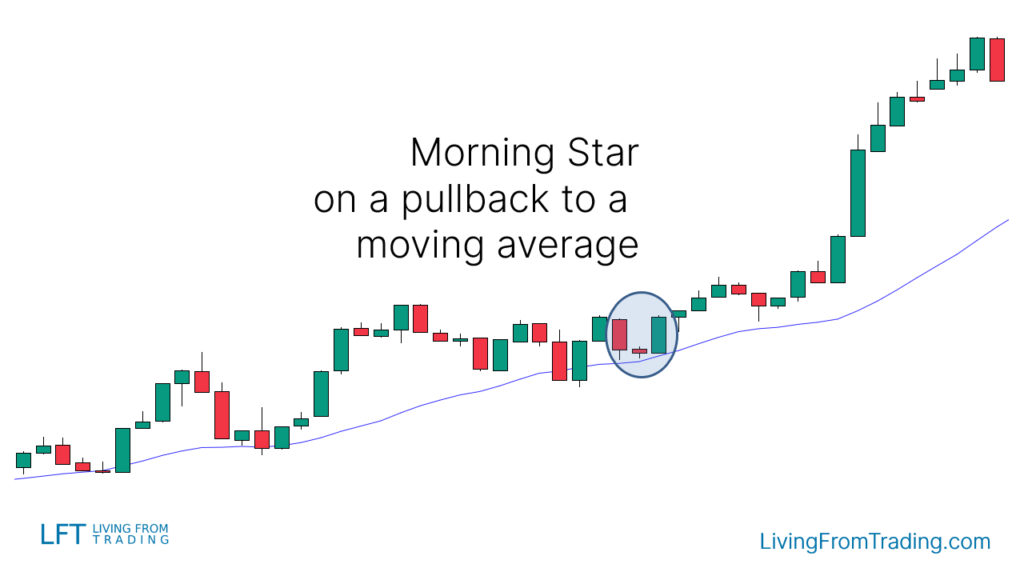
Strategy 3: Trading with Moving Averages
Moving averages are effective indicators for trading trends. Follow these steps:
- Identify an uptrend where the price is above a moving average.
- Wait for a decline to the moving average.
- If a “Morning Star” forms at the moving average, consider going long.
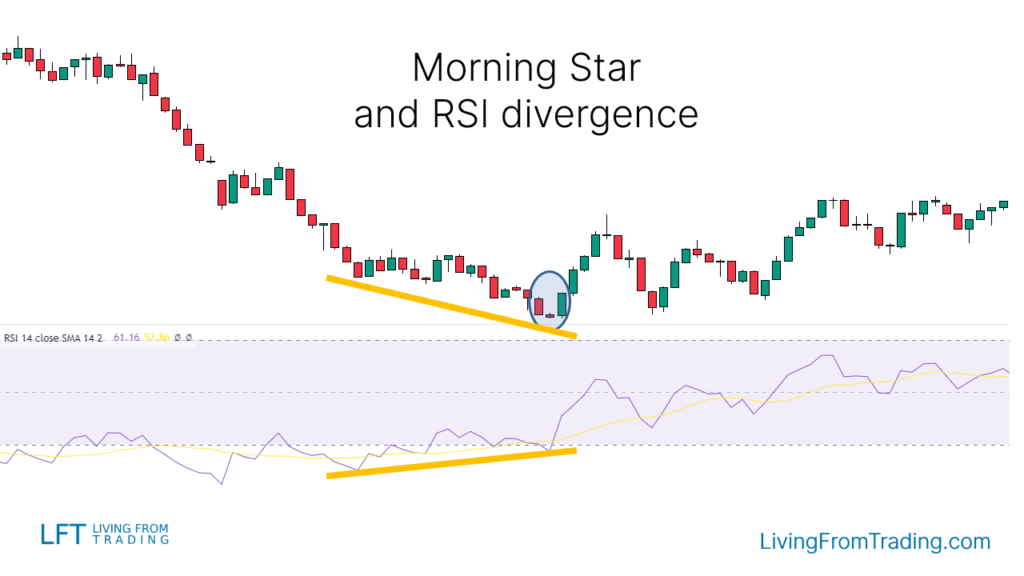
Strategy 4: Trading with RSI Divergences
RSI divergences offer a unique trading approach:
- Identify a downtrend and mark the lows after each decline.
- Compare price lows with the RSI indicator; a divergence occurs when RSI shows higher lows while price shows lower lows.
- Wait for a “Morning Star” at a lower price low aligned with an RSI higher low, then go long when the high of the third candle is broken.
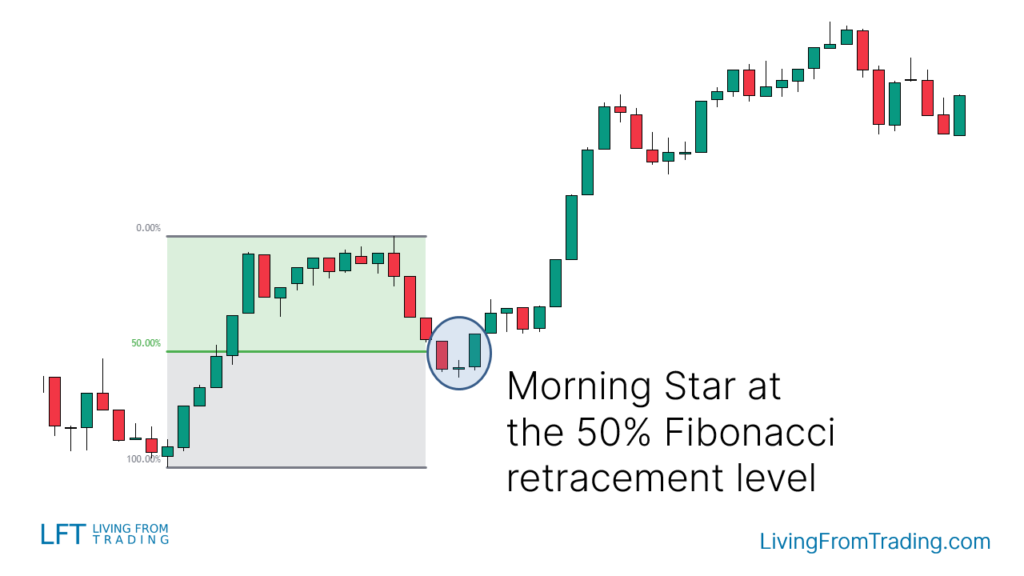
Strategy 5: Trading with Fibonacci Retracements
Use the Fibonacci retracement tool to identify key levels where the price may reverse:
- In an uptrend, wait for a price decline.
- Draw Fibonacci retracement levels from the low to high of the move.
- When the price hits a Fibonacci level and forms a “Morning Star,” consider going long.
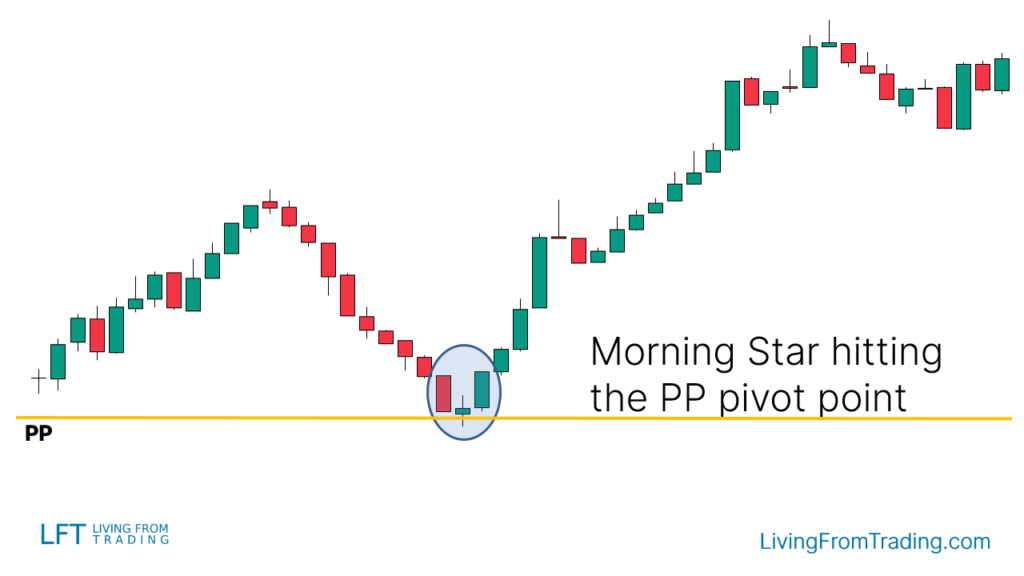
Strategy 6: Trading with Pivot Points
Pivot Points are calculated support and resistance levels:
- Activate the Pivot Points indicator on your charts.
- Identify Pivot Points below the price, which will act as support.
- Wait for the price to decline to a Pivot Point and form a “Morning Star.”
Disclaimer: The views in this article are from the original Creator and do not represent the views or position of Hawk Insight. The content of the article is for reference, communication and learning only, and does not constitute investment advice. If it involves copyright issues, please contact us for deletion.