Piercing Candlestick Pattern - What Is And How To Trade
Learn all about the Piercing candlestick pattern.What is, how to trade, and all the best trading strategies.

The "Piercing" candlestick pattern is a classic Japanese candlestick formation used primarily to identify short-term market reversals.This pattern signifies a bullish reversal, typically appearing after a price decline. It indicates rejection of lower prices and suggests a potential bullish reversal in the short term.
Observing the "Piercing" pattern can provide traders with potential buy signals.The "Piercing" pattern resembles the "Dark Cloud Cover" pattern but is the opposite in direction. While the former signals a bullish reversal, the latter indicates a bearish reversal.
How to Identify the "Piercing" Candlestick Pattern
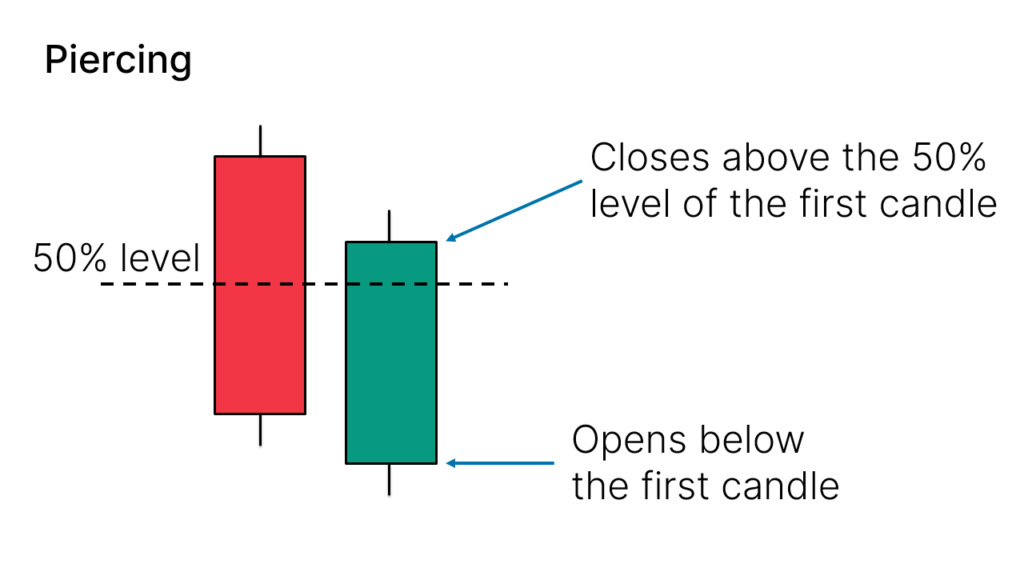
To identify the "Piercing" pattern, the following key conditions must be met:
- First Candle: It must be a bearish candle, where the open price is higher than the close price, showing market down pressure.
- Second Candle: It must be a bullish candle, with the open price below the close price of the first candle (creating a gap), and the close price above the halfway point of the body of the first candle.
- Pattern Characteristics: The first candle usually has a long lower wick, indicating strong selling pressure, while the second candle reflects a shift in market sentiment with buying pressure.
On actual charts, the "Piercing" candlestick pattern appears as follows:
Variants of the "Piercing" Candlestick Pattern
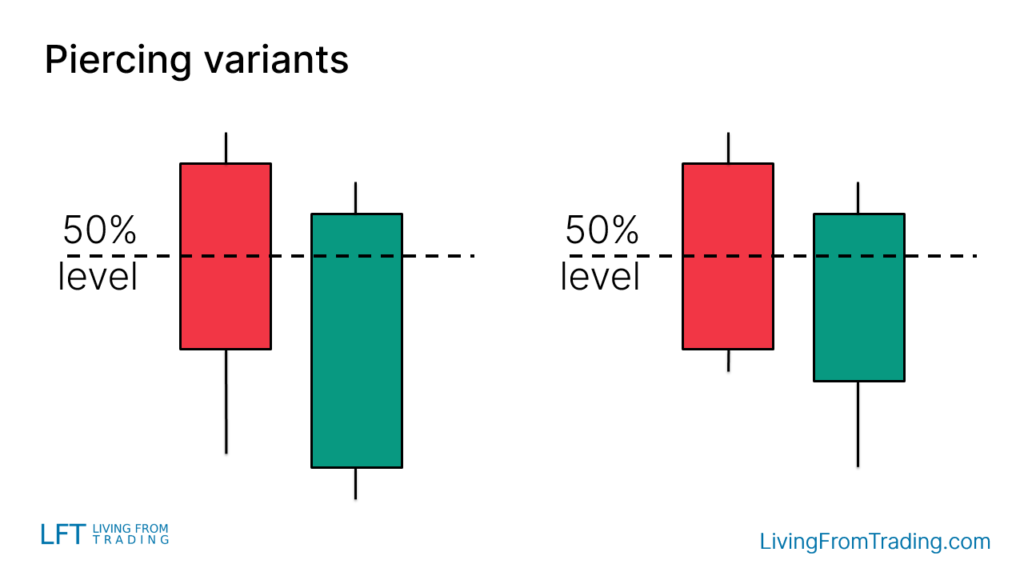
The "Piercing" pattern may present differently depending on market conditions:
- Wicks: One or both candles might have long lower wicks, further confirming rejection of lower prices.
- Color Variations: Different proportions of red (bearish) and green (bullish) candles can affect the interpretation of the pattern.
Trading Strategies
Successfully trading the "Piercing" pattern requires consideration of its shape, location, and market context. Here are several strategies:
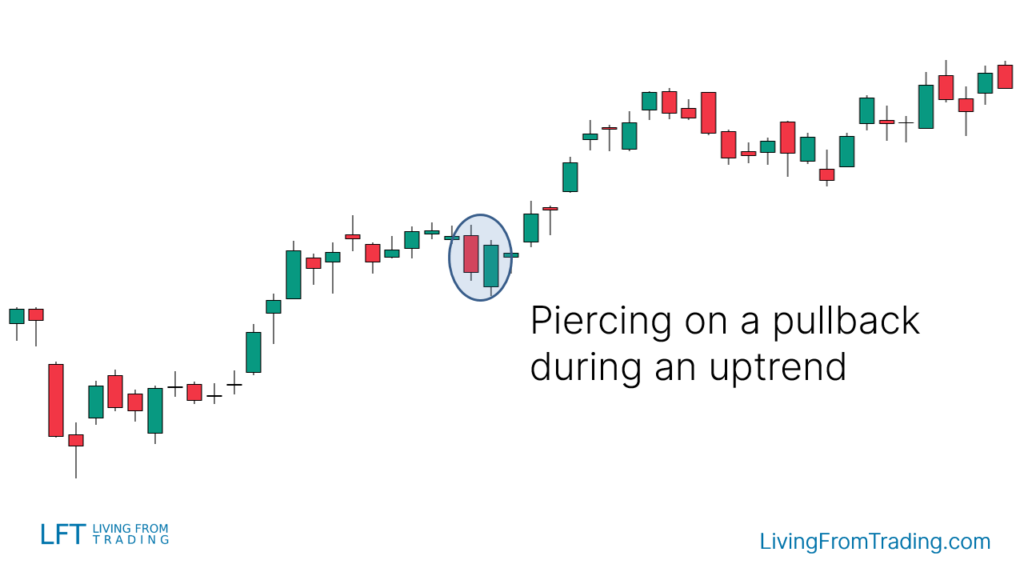
Strategy 1: Pullbacks on Naked Charts
- Description: In an uptrend, wait for a pullback and then spot the "Piercing" pattern. This often signals the end of the pullback and the beginning of a new uptrend.
- Steps: Identify the uptrend, wait for a pullback, detect the "Piercing" pattern, and enter a long position upon confirmation of a breakout.
Strategy 2: Trading with Support Levels
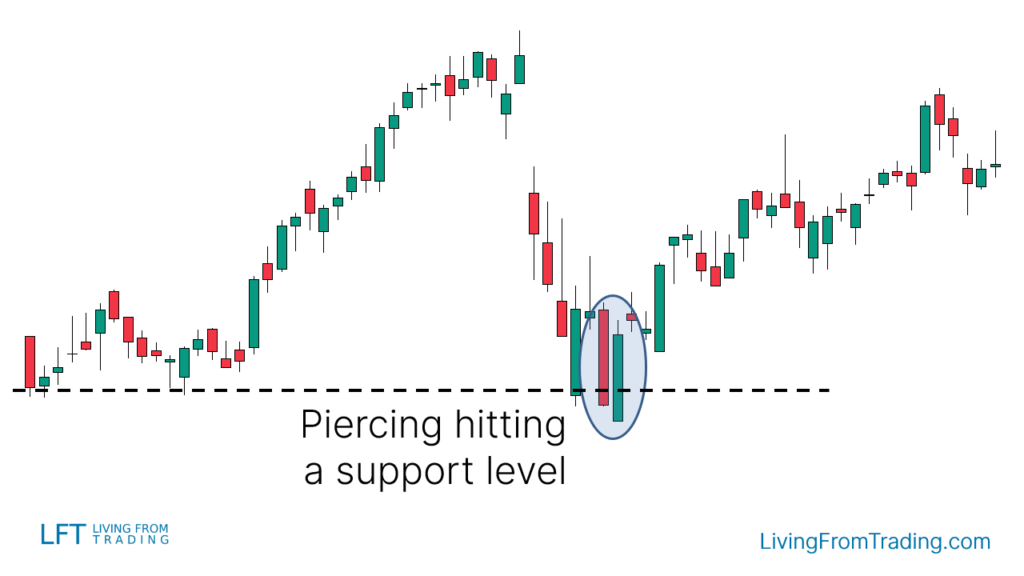
- Description: Support levels are crucial for price reversals. A "Piercing" pattern near a support level may indicate the start of a price rebound.
- Steps: Draw support levels, wait for a price decline to hit support, spot the "Piercing" pattern, and go long when the price breaks above the pattern's high.
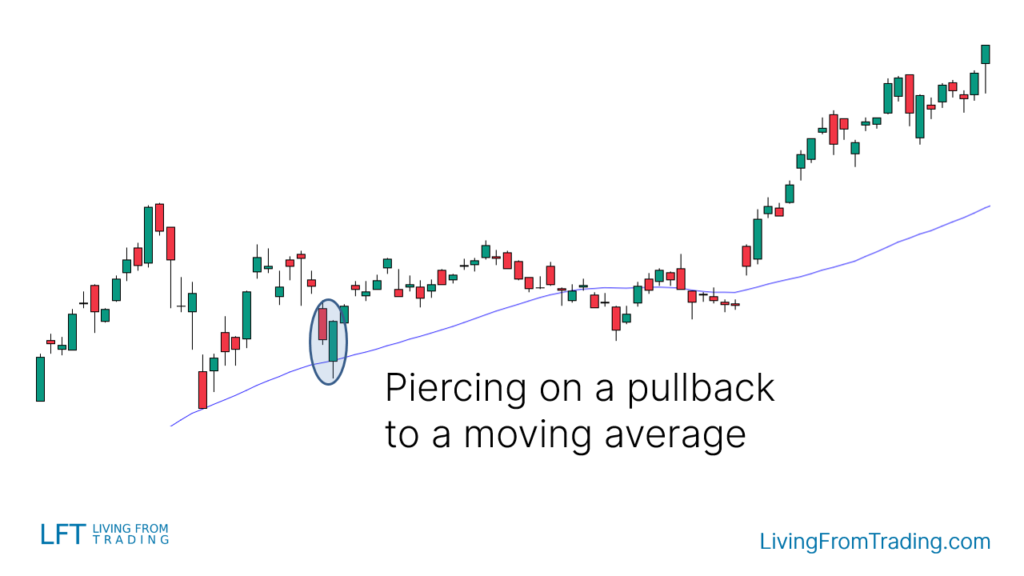
Strategy 3: Trading with Moving Averages
- Description: When price pulls back to a moving average during an uptrend and forms a "Piercing" pattern, it may signal continuation of the trend.
- Steps: Identify the moving average, wait for a price pullback, observe the "Piercing" pattern, and enter a long position upon a breakout above the moving average.
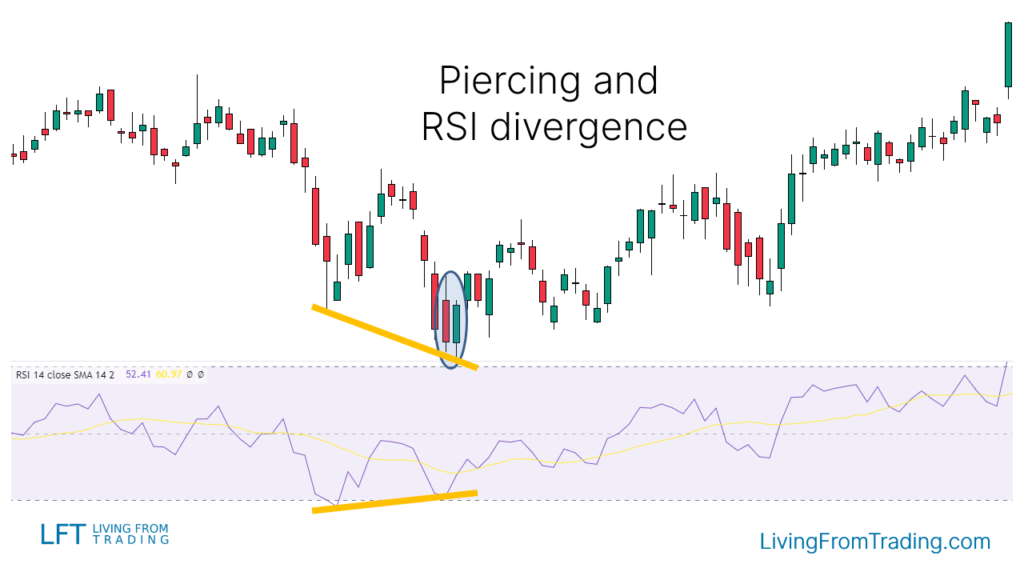
Strategy 4: Trading with RSI Divergences
- Description: RSI divergences are significant reversal signals. Combine a "Piercing" pattern with RSI divergence for added confirmation.
- Steps: Identify a downtrend with lower lows and lower highs, check for RSI making higher lows, wait for the "Piercing" pattern at a lower low, and go long when the price breaks the high of the last candle.
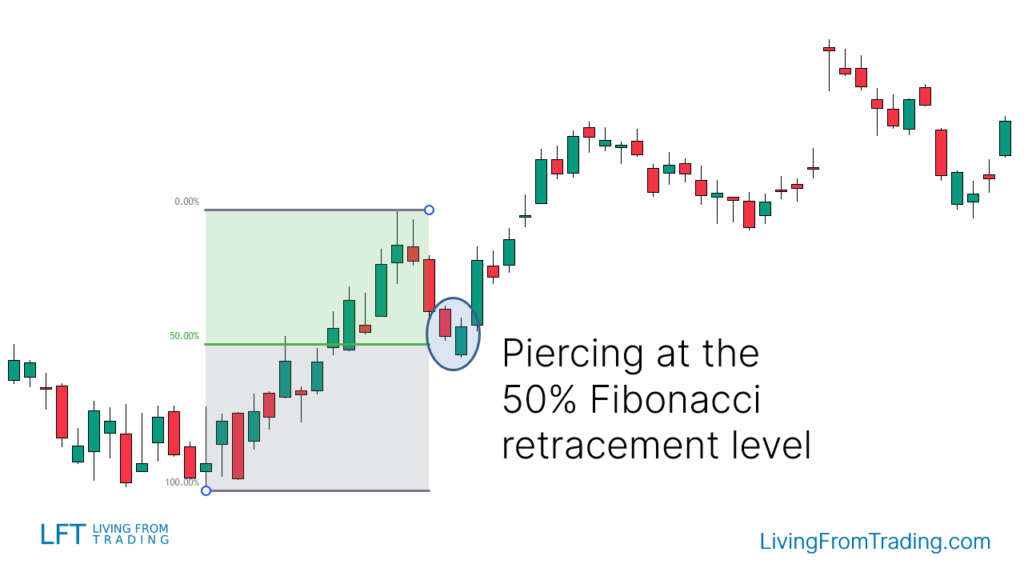
Strategy 5: Trading with Fibonacci Retracements
- Description: Use Fibonacci retracement levels to identify potential reversal points. A "Piercing" pattern at these levels can enhance trading success.
- Steps: Draw Fibonacci levels from the low to high of the move, wait for the price to reach these levels and form a "Piercing" pattern, and enter a long position upon a breakout.
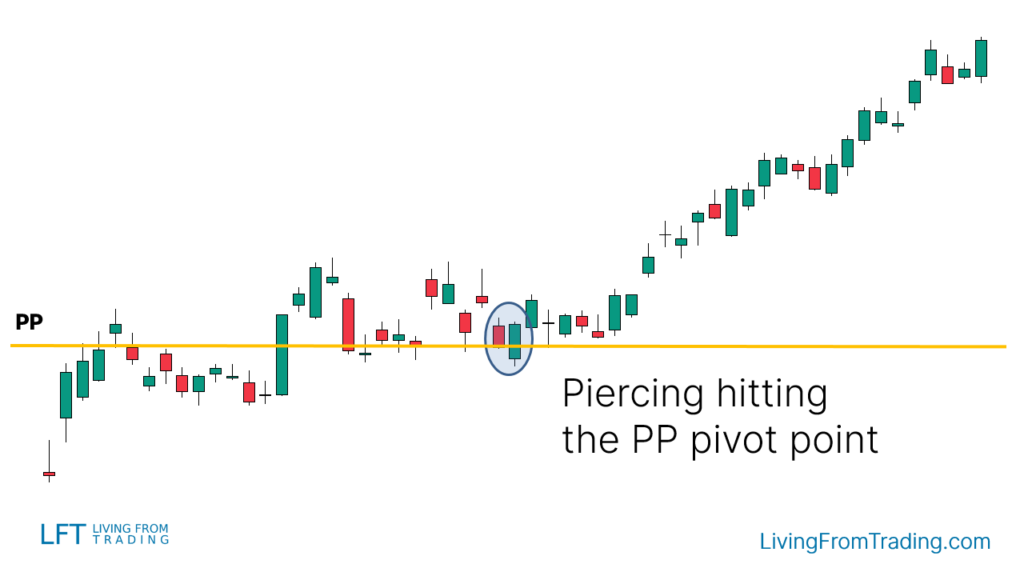
Strategy 6: Trading with Pivot Points
- Description: Pivot points provide automatic support and resistance levels. A "Piercing" pattern near a pivot point can signal a rebound opportunity.
- Steps: Enable the Pivot Points indicator, observe price movement near these levels, look for a "Piercing" pattern, and go long when the price breaks above the pattern's high.
Summary
The "Piercing" candlestick pattern is a bullish reversal formation often seen after a price decline, signaling a potential market rebound. It consists of two candles: a bearish first candle and a bullish second candle, with the second candle's close price exceeding half of the first candle's body.
Trading this pattern effectively involves considering its location, market environment, and using additional technical indicators such as support levels, moving averages, RSI divergences, Fibonacci retracements, and Pivot Points.
Disclaimer: The views in this article are from the original Creator and do not represent the views or position of Hawk Insight. The content of the article is for reference, communication and learning only, and does not constitute investment advice. If it involves copyright issues, please contact us for deletion.