6 Key Steps in Building a Trading System for XM
From setting the time frame to determining the best entry and exit levels, here are the 6 steps to build a winning trading system based on XM。
From setting the time frame to determining the best entry and exit levels, here are the 6 steps to build a winning trading system based on XM。
As you gain more experience and improve your trading skills, you may want to build your own trading system that suits your trading style, goals and risk tolerance。This is very important in online trading because it can limit your losses, minimize emotions such as greed and fear, and help you make better trading decisions。
According to XM Broker, there are six important steps to building a winning trading system.
- Define Time Range
Identify market trends
Determine support and resistance levels
Determine the admission price
Determine exit price
Analyze using multiple time ranges
Now let's break them down to see what they really mean。

Step 1: Define the Time Range
If you don't have much time to observe the market all day, you are a long-term trader。In this case, you can choose to use a daily or even weekly time frame。The advantage of being a long-term trader is that you will make fewer trades and pay less spreads。However, you may only receive some signals in about a month, so it takes a lot of patience to complete the work。In addition to this, you also need a larger account to avoid margin calls, because long-term strategies require larger stops。
If you lack patience and have enough time to observe market movements, then you should make day trading。Use a shorter time frame (such as a 15-minute or even 5-minute chart) to develop your strategy, so that you will get more trading opportunities every day, which can avoid overnight risk and reduce transaction costs。However, you need more stamina to watch the market and stay focused most of the time。
If you are in the middle position, it is easy to become a swing trader。Use hourly charts for short-term trading that can last up to several hours to several days。
Step 2: Identify market trends
Since the XM broker uses a trend following framework, you need to trade in the same direction as the market trend。In general, trends fall into three types, namely, uptrends, downtrends, and range fluctuations。Look at the following example。
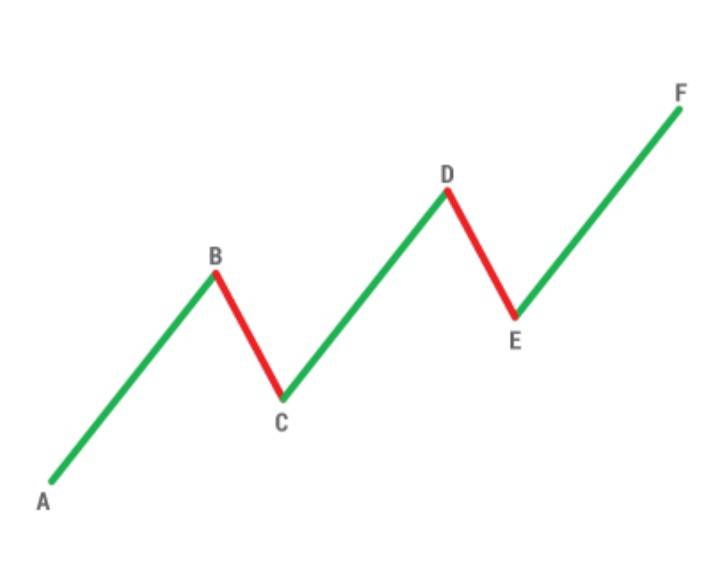
The chart above shows an example of an uptrend, focus on highs and lows。There are 5 waves of the above upward trend:
- First wave: A to B
Wave 2: B to C
Wave 3: C to D
Wave 4: D to E
Wave 5: E to F
You may notice that wave 1, wave 3, and wave 5 are moving upward; while wave 2 and wave 4 are moving in the opposite direction to the overall trend, so they are called corrections。The same concept applies to other types of trends。
To identify trends, the XM broker mentions the help of technical indicators such as MACD, 20-EMA (exponential moving average) and 25-RoC (rate of change).。Note that in the scope market, only the RoC can be used。At the same time, in order to identify the direction of the wave, you can use indicators such as RSI (14), MACD, 20-EMA, and Stochastic。
Step 3: Determine the support and resistance levels
Create a buy position when the trend is up; open a sell position when the market is in a downtrend。The question is when to open the order?Before answering this question, you should be able to identify the support and resistance levels on the chart。
You can use a variety of options to discover support and resistance levels。To simplify your selection, XM introduces the following methods:
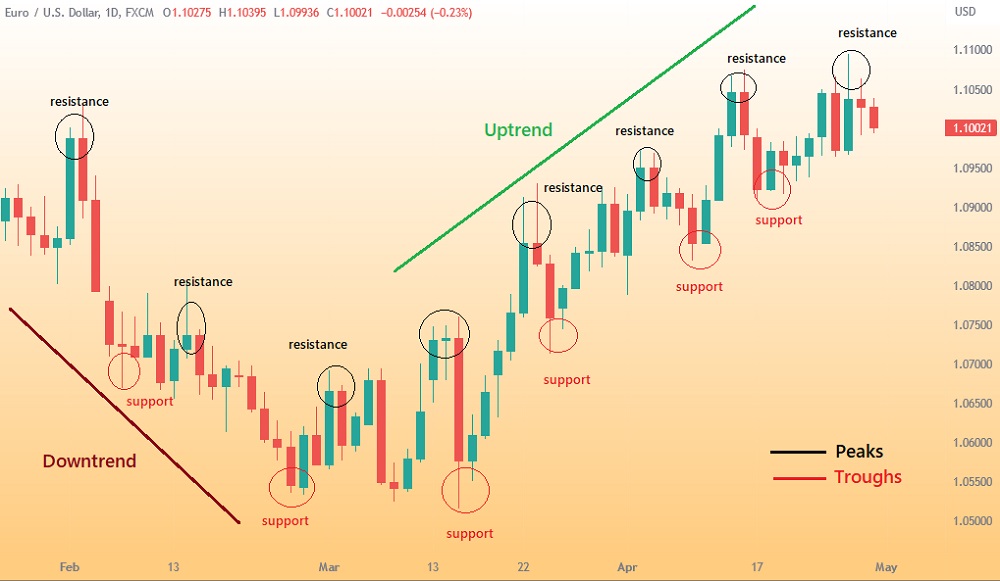
Crest and trough
Basically, all you need to do is mark each peak and trough with a horizontal line。In a downtrend, each lower peak is a resistance level and each higher trough is a support level。At the same time, in an uptrend, each higher peak is a resistance level and each higher trough is a support level。
Use previous time range
Open a time range higher than the one you are using, and from there find past trading levels。So, if you use the 15-minute chart, you can look at the 1-hour chart and combine the support and resistance levels into the 15-minute chart。Then, look at the 4-hour time frame and put it in the 15-minute chart。
If the level in the higher time frame matches the support and resistance levels in the lower time frame, it means that the level is stronger and more reliable for your trading。
Moving Average
Moving averages are a popular technical indicator that can be used for a variety of purposes, including identifying support and resistance levels。In a downtrend, MA acts as a support level, while in an uptrend, MA acts as a resistance level。You can use moving averages for different periods, such as 20 moving averages or 55 moving averages。Both simple moving averages and exponential moving averages are acceptable.。
Fibonacci Line
Fibonacci callback is another popular indicator that you can use to get things done, the most commonly used level is 23.6%, 38.2% and 61.8%。Usually, after a sharp rise / fall, the price will retrace the longer distance of the original trend. When this happens, support and resistance levels usually appear at or near the Fibonacci retracement level。
Trend Line
Finally, you can use the trend line。In an uptrend, the price remains above the line as a support level; in a downtrend, the price remains below the line as a resistance level。Note that the line must have at least two points, either two peaks or two valleys。An effective trend will have three or more points。Therefore, the more points a trend line has, the more accurate and important the line will be.。
Step 4: Determine the entry price
In order to make a profit, you need to enter the market at the right time。After determining the support and resistance levels, you can determine your entry price。XM mentions three methods in its hints, namely:
Trading rebounds
The idea is basically to buy on dips (pullbacks) during uptrends and sell on dips during downtrends (prices continue to fall after a temporary rally)。In an uptrend, the first step is to wait for the price to fall and reach the support level, wait for the rebound to occur before entering the market。Ensure that both RoC (7) and MACD are in oversold areas, further confirming that the support level will hold。Don't make the mistake of placing an order too early, it's better to wait for the price to rebound than to buy when the price is at support。Also, don't forget to set the stop loss a few points below the support level to prevent the price movement from going against you。Trading Breakthrough
In this strategy, you must wait for the price to break through the support or resistance level。In an uptrend, a buy order is opened when the price breaks through the resistance level; in a downtrend, a sell order is opened when the price breaks through the support level.。To ensure that the breakout is strong enough, open the 1-minute chart and wait for two bullish candlesticks to appear above the resistance level or two bearish candlesticks to appear below the support level。Trading trend reversal (failure volatility)
Failed volatility indicates that the trend is about to reverse and provides a good opportunity to enter the market。This usually happens when the trend weakens and the price cannot make higher highs in an uptrend or lower lows in a downtrend。For example, if the price fails to fall below a lower low in a downtrend and then moves upward to break through resistance, then this is a good entry signal。
Step 5: Determine the exit price
Determining the exit price is as important as determining the entry price.。You can use two exit levels, stop loss and take profit。
- Stop loss: Stop loss is used to limit your losses。The placement should depend on your entry level, do not place it too close or too far away from the admission price。The ideal situation is to set it close enough to prevent you from suffering too much loss, while at the same time far enough to allow price adjustments。
Take Profit: Take Profit is not used to limit losses, but to lock in your profits。For example, in 161.8% Fibonacci extension closes 50% of the position and shifts the stop loss on the remaining position to the opening price; at the next resistance level, closes 50% of the remaining position (25% of the original position) and shifts the stop loss higher; at the next resistance level, closes the remaining 25%。
Step 6: Analyze with Multiple Time Ranges
In order to increase your chances of winning, XM strongly recommends that traders use multiple time frame analysis, which means that you are not only trading with one time frame, but with multiple time frames。You need to use a higher / lower time frame to confirm the signals you find in the preferred time frame in order to obtain a broader market perspective。
The reason is that the trend direction may be different in each time frame。So what you see on the chart doesn't necessarily reflect the full reality of the market。For example, GBP / USD may show an upward trend in the 1-hour chart and a downward trend in the daily chart.。So using multiple time frames to analyze the market is a great way to minimize trading losses because you will be able to see positions related to the big picture。
Conclusion
Following the six steps above, you will be able to execute trades based on technical analysis and thorough research。However, before putting in real money, don't forget to test the strategy on a demo account。Once a real transaction is executed, be sure to keep records and evaluate the performance of the transaction。In this case, you can use the XM demo account and then transfer to the real account to implement the trading system。
XM was founded in 2009 as a company called Trading Point of Financial Instruments Ltd..A member of an online brokerage firm。To serve customers worldwide, the company has split into XM Australia and XM Global, as well as XM Cyprus。Each member has a different head office and license, XM Australia is registered under the Australian Securities and Investments Commission (reference number: 443670), XM Worldwide is registered under the International Financial Services Commission (60 / 354 / TS / 19), and XM Cyprus is registered under the Cyprus Securities and Exchange Commission (reference number: 120 / 10).。
XM is one of the more experienced brokers in today's online forex trading world。Since its inception, the broker has undergone many changes, including the addition of an ultra-low account and webinar function, which supports 19 different languages with 35 local instructors in each language。
In terms of trading instruments,XM is known for its diversity of asset providers, ranging from Forex, commodities, CFDs for equity indices, precious metals, energy, to equities。XM prides itself on being the ideal broker to execute trades, providing a statistic that 99.35% of orders executed in less than a second。Trading at XM also offers a strict no-re-quote policy, no virtual trader plug-ins, no rejection of orders, real-time market execution, and the option for traders to place orders online or over the phone.。
在在Spreads across all major currency pairs can be as low as 0 in an Ultra-Low account.6 points, while the spread of other accounts usually starts at 1 point。XM chose to limit their leverage to a scale of 1: 888, rather than offering a maximum leverage of 1: 500 or 1: 1000 (whole numbers), a unique number now widely recognized as a trademark of XM.。
In order to protect the client's funds in the case of extreme volatility,XM provides negative balance protection for each type of account。Deposits for micro and standard accounts start at $5, while Ultra-Low accounts require a minimum deposit of $50。Traders who open an account at XM can get conditions similar to a penny account environment in a micro-account, where each lot has a contract size of only 1,000 units.。If you use the smallest number of lots on the MetaTrader platform, which is 0.01 lots, then the trader can trade only 10 units per trade。
For deposits,XM applies zero-fee deposits in most of its available payment methods。Traders can choose to deposit and withdraw money by wire transfer, credit card, and the most popular electronic payment options such as Skrill, Neteller, and FasaPay.。
XM also provides Islamic accounts for Muslim traders who comply with Sharia law that prohibits the use of interest-bearing overnight swaps for each currency pair.。In order to provide their customers with the best trading experience, XM has opened access to MT4 and MT5 platforms, each with more than 6 display formats (PC, Mac, Multiterminal, WebTrader, iPad, iPhone, Android and Android tablets).。
In general, there is no doubt,XM has gone global, with its deep commitment to providing trading services worldwide available in more than 15 languages.。In addition to simplifying the trader's experience through mainstream trading platforms and high-quality trade execution, XM is open to all types of traders, from small capital traders to preparing large deposits.
for their global approach,XM has ensured that traders from various countries can easily access their services.。This has resulted in different domain names for traders in specific jurisdictions。
XMIs a mature international company, has become a real leader in the trading industry, founded in 2009, with "fair, honest, reliable" as the main principle。XM supports no re-quotes and real-time execution, traders can choose from more than 10 trading platforms suitable for any device。
Disclaimer: The views in this article are from the original Creator and do not represent the views or position of Hawk Insight. The content of the article is for reference, communication and learning only, and does not constitute investment advice. If it involves copyright issues, please contact us for deletion.