Three charts to take you through the stock market volatility
Here are three charts to focus on: 1) how the current stock market decline compares to historical declines; 2) how much investors are willing to pay for government bonds; and 3) how Fed interest rate policy compares to recent history。These data help to understand the current volatility, investor anxiety, and the state of the U.。
The uncertainty caused by COVID-19 makes it difficult for investors to grasp what is happening in the market。There are fears that the world economy could shrink, especially amid continued disruptions in global supply chains.。Meanwhile, U.S. unemployment soars。From mid-March to May 2020, more than 40 million people - about a quarter of U.S. workers - applied for unemployment benefits.。Although the US Congress approved 2.$2 trillion emergency bailout package, but experts say the U.S. economy may already be in recession。

Here are three charts to focus on: 1) how the current stock market decline compares to historical declines; 2) how much investors are willing to pay for government bonds; and 3) how Fed interest rate policy compares to recent history。These data help to understand the current volatility, investor anxiety, and the state of the U.。
The fastest decline in the history of the S & P 500 - unprecedented volatility

As of June 5, 2020, the S & P 500 is down only about 2% so far this year, rebounding from its March 2020 low (when it was down more than 30%).。
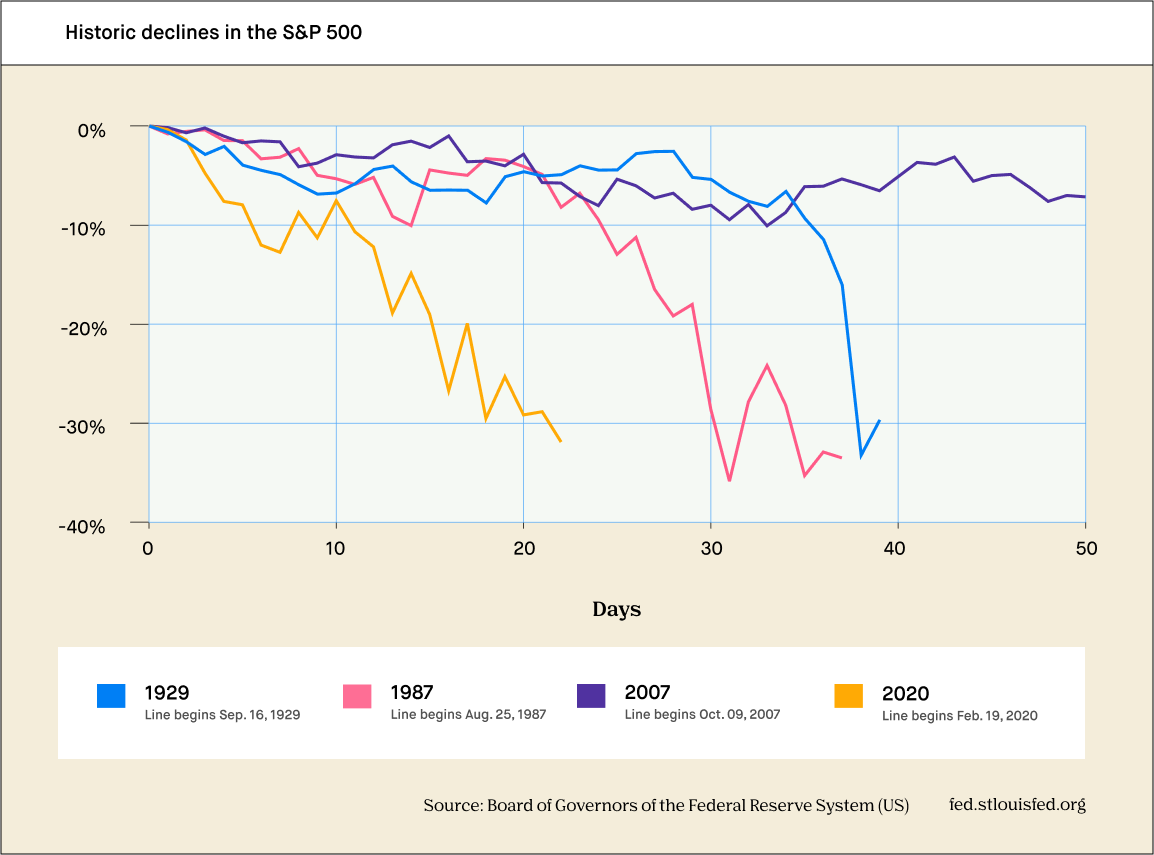
The market's response to COVID-19 has been very poor, even compared to some of the worst periods in investment history。The data suggest that market volatility in 2020 is unprecedented。The chart compares the decline in the S & P 500 during the Great Depression, Black Monday (1987) and the 2008 financial crisis with the declines that occurred in February and March 2020.。In just 22 trading days, starting on February 19, 2020, the S & P 500, an equity index that generally reflects the U.S. stock market, is down 30%。On March 20, 2020, the index price was nearly 32% lower than its peak of 3,386 points on February 19.。
Of course, at the beginning of the year, the stock market kept rising。As of February 7, about 71% of companies had exceeded earnings expectations, and strong results repeatedly pushed the S & P 500 to new highs。
Despite the S & P 500's plunge, its decline has not been in a straight line。Instead, it wobbles, pushing up during intermittent rallies and then falling again on reports of deterioration (such as school and business closures).。During the sharp decline, the index was temporarily boosted by the Fed announcement and the congressional vote.。As a result, when we look at its performance for the period (February 19 to March 31, 2020), the S & P 500 shows some kind of zigzag pattern。
Here's the takeaway: While the market's decline was so rapid and shocking, it was at least partially offset by a record rise。For example, on March 12, the Dow Jones Industrial Average (which tracks some blue-chip U.S. companies) suffered its worst day since 1987.。But later that month, it also had its best day since 1987.。As of June 4, the Dow was down only 4% from early 2020..5%。While we saw truly historic volatility in 2020, the U.S. stock market has recovered from its previous bear market.。
Importantly, a 20% decline and a 20% rise won't bring investors back to where they started.。For example, if a stock trading at $100 falls 20%, the price will be $80。If the share price subsequently rebounds by 20%, i.e. by $16, its latest price will be $96, as the percentage change calculation uses the latest price as a reference point。
Government Bonds Hit Record Low: Signals of Investor Anxiety

In this uncertain environment, some investors show a preference for cash, reflected in a boom in short-term government bonds。The bonds, also known as Treasury bills or "Treasury bills," are considered one of the safest investments because they are backed by the U.S. Treasury.。Treasury bills are usually sold in $1,000 increments.。
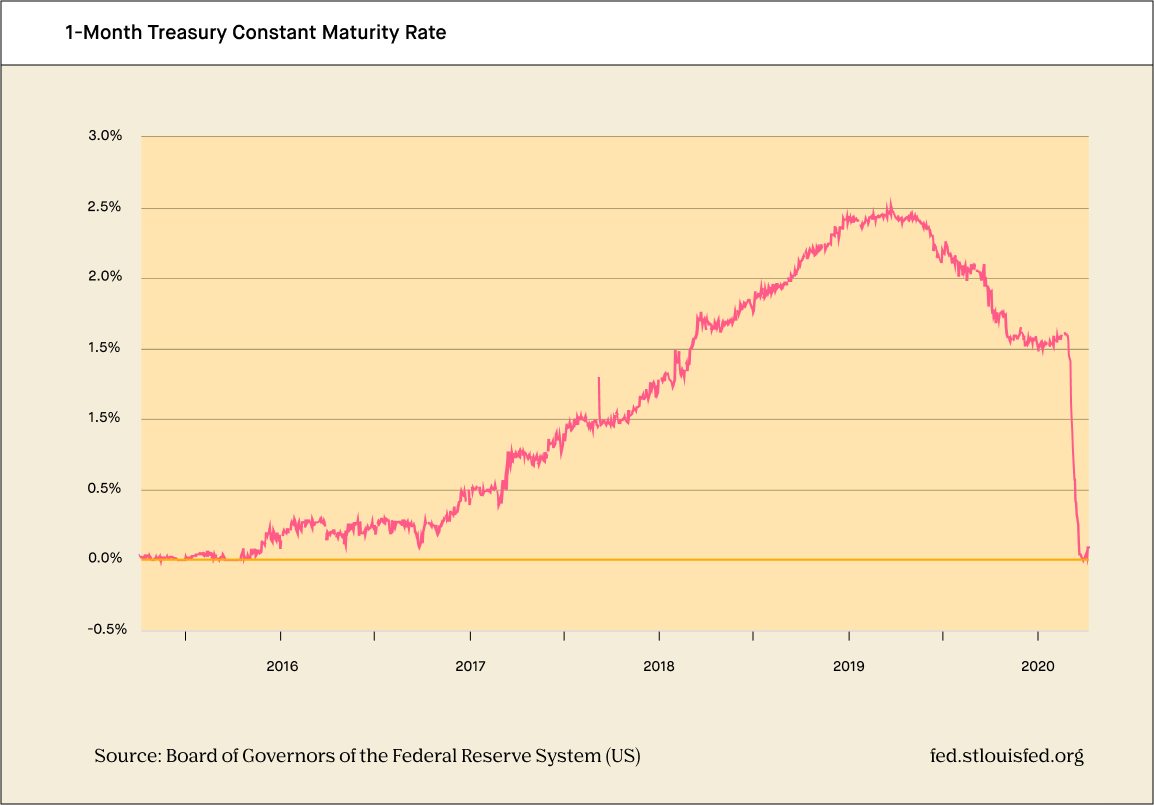
Government bond yields hit a record low in March, a strong indication of extreme investor anxiety。When the stock market performs well, investor demand for government bonds is usually lower because many investors believe they can get higher returns through stocks。But in recent months, as the stock market has been volatile, many investors have been buying government bonds in the hope of seeing less volatility。As people are willing to pay more and get less in return, the influx of demand depresses yields。
In fact, demand is so high that once one-month and three-month Treasury yields actually turned negative。Paradoxically, this means that investors who hold bonds for the entire term, or "maturity," will receive less money than they originally put in.。
Negative yields are an anomaly that reflects the special times we live in。Some investors are so concerned about retaining cash or cash equivalents that they are willing to accept small losses in the pursuit of financial stability。
U.S. interest rates lower: ensuring banks can continue to transfer funds

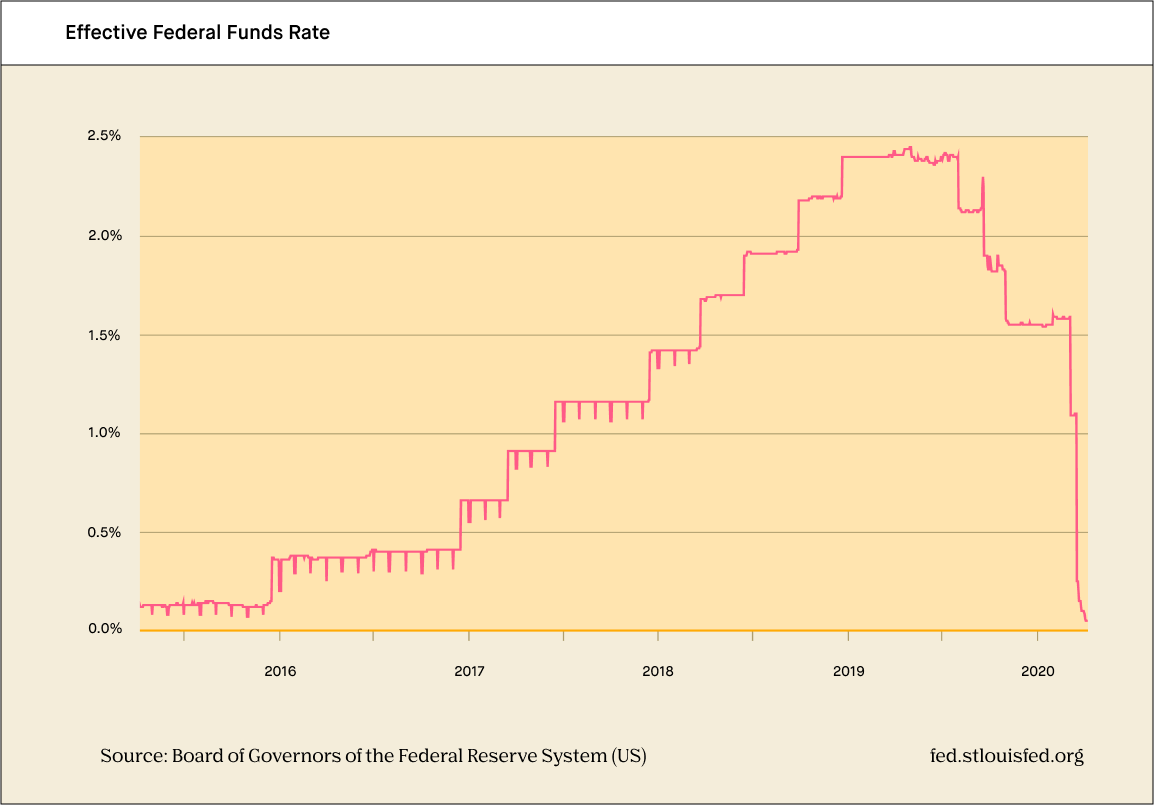
"U.S. interest rate" generally refers to the federal funds rate, the rate at which banks borrow from each other overnight.。The federal funds rate also affects consumers, indirectly affecting interest rates such as credit cards and auto loans.。
To help avoid disruptions in banking services and ensure that depository institutions can continue to move funds smoothly, the Federal Reserve lowered its target range for the federal funds rate to 0-0 in mid-March 2020..25%。Interest rates have never been lower since the 2008 financial crisis, a strong sign of a slowing economy.。
·Original
Disclaimer: The views in this article are from the original Creator and do not represent the views or position of Hawk Insight. The content of the article is for reference, communication and learning only, and does not constitute investment advice. If it involves copyright issues, please contact us for deletion.