Three Outside Down Candlestick Pattern - What Is And How To Trade
Learn all about the Three Outside Down candlestick pattern.What is, how to trade, and all the best trading strategies.

What is the Three Outside Down Candlestick Pattern?
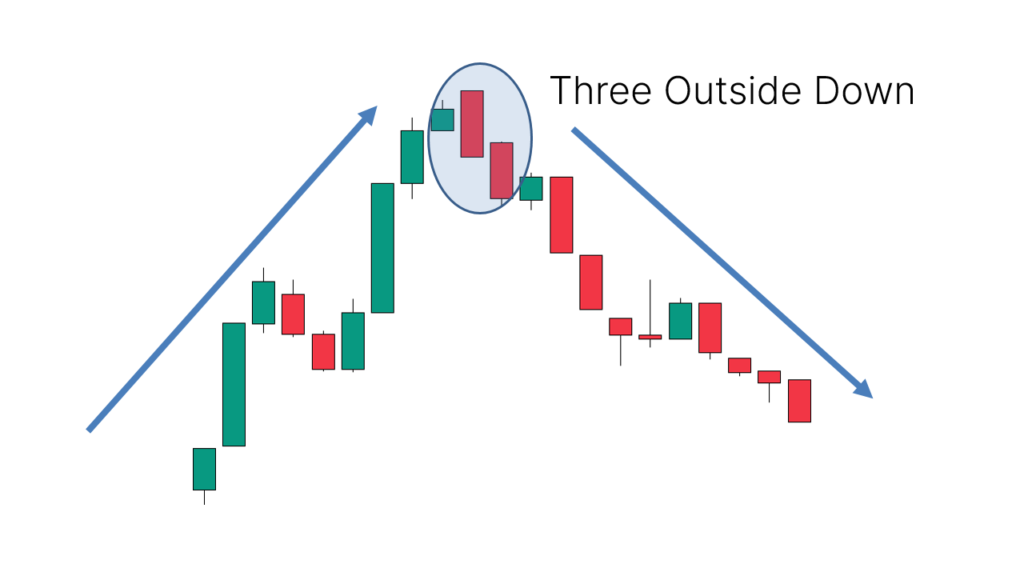
The Three Outside Down is a Japanese candlestick pattern that is considered a bearish reversal pattern. It usually appears after a price uptrend, indicating rejection of high prices and signaling a potential market shift from bullish to bearish. This pattern is a trend reversal signal, implying that we expect the price to rise before it appears. Notably, the Three Outside Down pattern is the mirror image of the Three Outside Up pattern.
How to Identify the Three Outside Down Candlestick Pattern
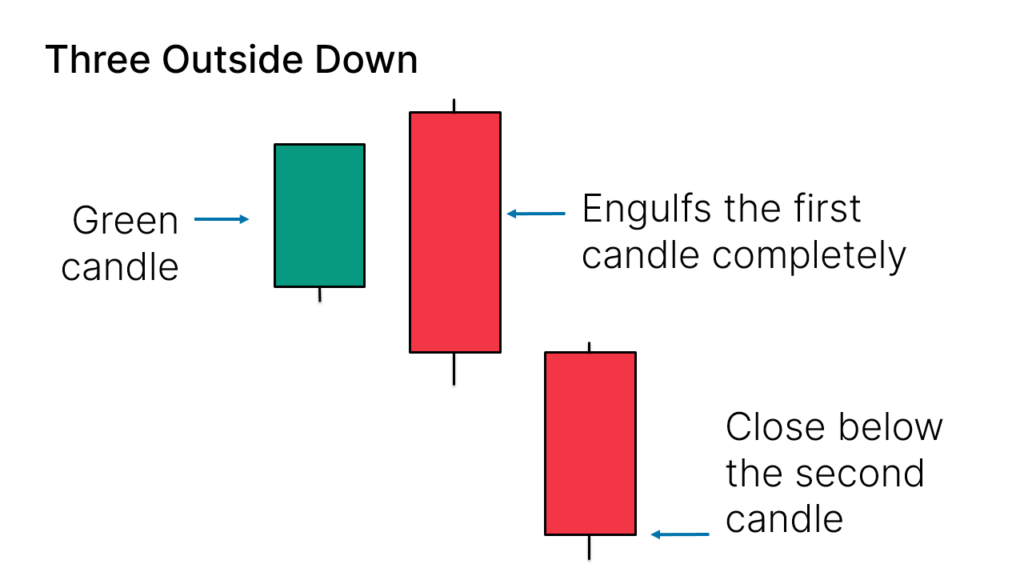
The Three Outside Down pattern consists of three candlesticks:
- The first candlestick is a small bullish (green or white) candle.
- The second candlestick is a large bearish (red or black) candle that completely engulfs the first candlestick.
- The third candlestick is a bearish candle that closes below the close of the first two candlesticks.
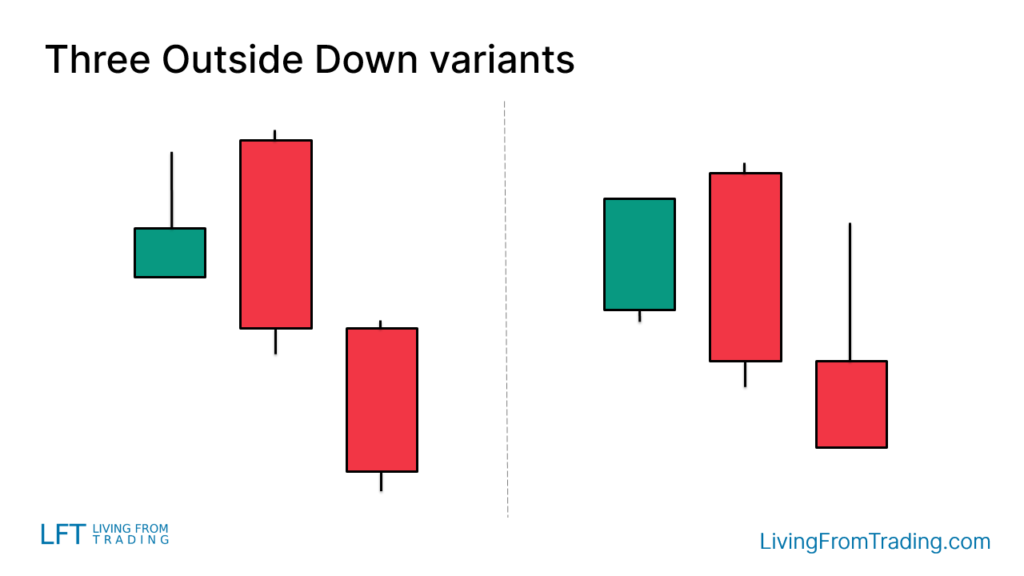
Variations of the Three Outside Down Pattern
The Three Outside Down pattern can vary in appearance on the chart. For example, the candlesticks may have longer upper shadows, resembling inverted hammer candles.
How to Trade
The pattern alone is not sufficient for trading. The key lies in its position. The Three Outside Down pattern usually appears after a price uptrend. As a bearish reversal signal, we aim to enter a short position when the lowest point of the last candlestick in the pattern is broken. To protect ourselves, it is advisable to set a stop-loss point, typically at the other end of the pattern.
For increased accuracy, it is recommended to combine the Three Outside Down pattern with other technical analysis methods or indicators.
Trading Strategies for the Three Outside Down Pattern
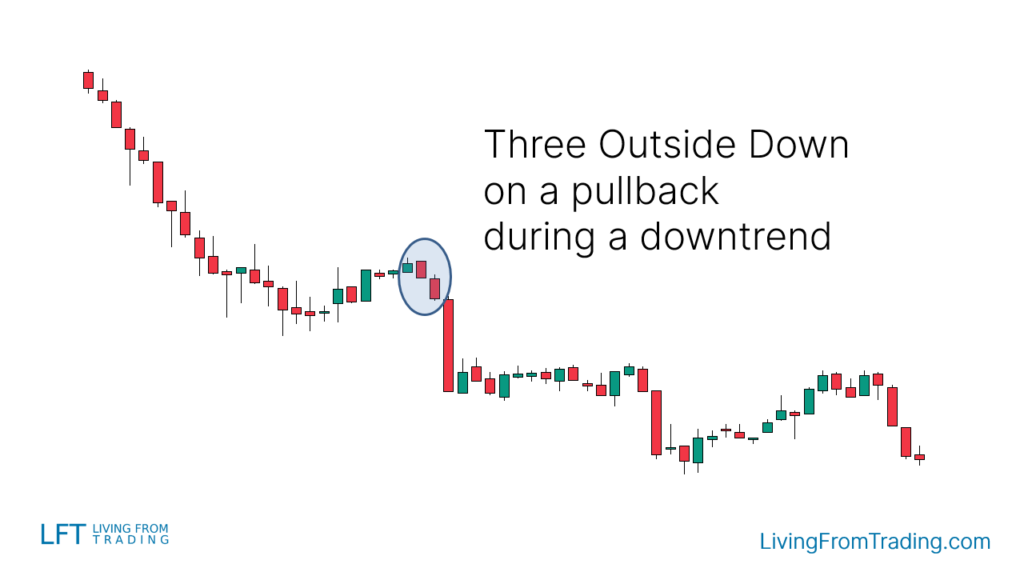
Strategy 1: Naked Chart Retracement
As a bearish reversal pattern, the Three Outside Down is ideal for use in a downtrend. When prices retrace in a downtrend, we can wait for the Three Outside Down pattern to appear, usually indicating the end of the retracement and the beginning of a new downtrend.
For example, in a typical downtrend, when the price retraces to a certain level and forms a Three Outside Down pattern, you can choose to short when the low of the last candlestick in the pattern is broken, and set a stop-loss at the highest point of the pattern.
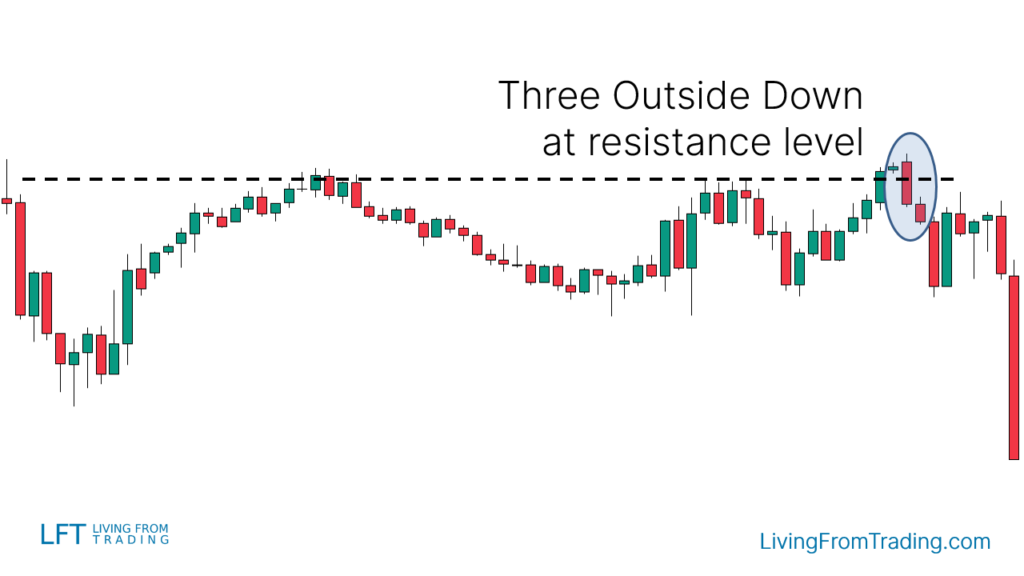
Strategy 2: Trading Using Resistance Levels
Resistance levels are good points for price reversals. When using resistance levels for trading, we aim to trade when the price touches a resistance level and forms the Three Outside Down pattern. The steps are as follows:
- Mark important resistance levels on the chart.
- Wait for the price to rise and touch the resistance level.
- Observe the appearance of the Three Outside Down pattern.
- Short when the low of the last candlestick in the pattern is broken.
- Set a stop-loss at the other end of the pattern.
- Set a profit target, usually the previous low or a Fibonacci extension level.
For example, when a stock touches a resistance level and forms a Three Outside Down pattern, you can choose to short when the low of the last candlestick in the pattern is broken, and set a stop-loss at the highest point of the pattern.
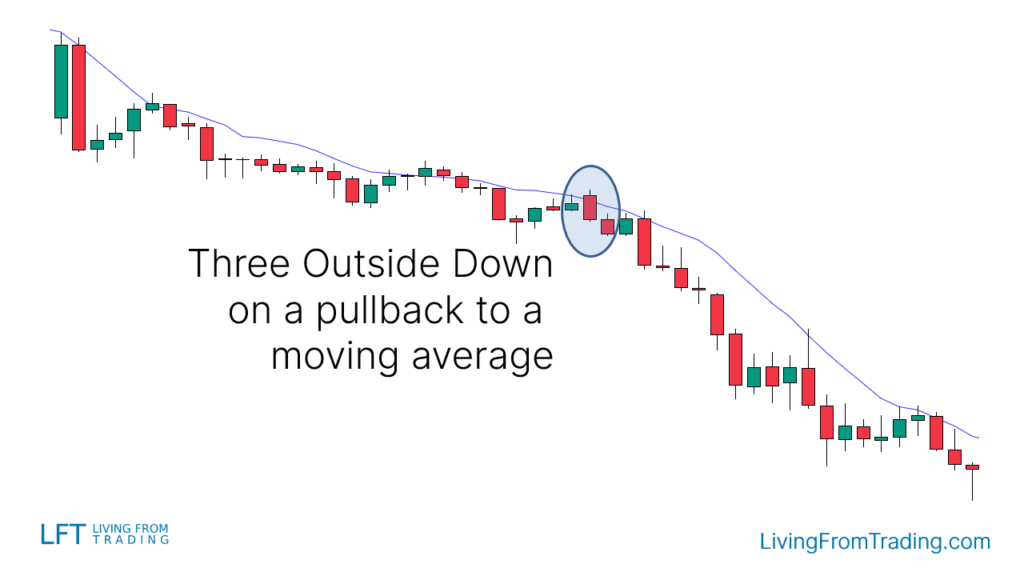
Strategy 3: Combining with Moving Averages
Moving averages are excellent indicators for trend trading. We can use moving averages to identify price retracements and combine them with the Three Outside Down pattern for trading. The steps are as follows:
- Identify a downtrend where the price is below the moving average.
- Wait for the price to retrace and touch the moving average.
- Observe the appearance of the Three Outside Down pattern.
- Short when the low of the last candlestick in the pattern is broken.
- Set a stop-loss at the other end of the pattern.
- Set a profit target, usually the previous low or a Fibonacci extension level.
For example, when a stock touches the 50-day moving average and forms a Three Outside Down pattern, you can choose to short when the low of the last candlestick in the pattern is broken, and set a stop-loss at the highest point of the pattern.
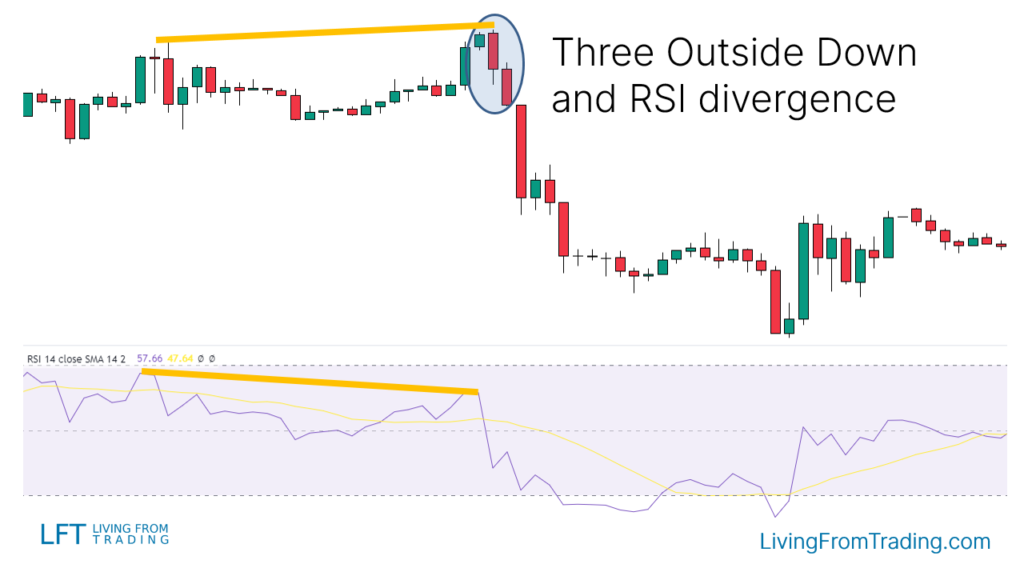
Strategy 4: Combining with RSI Divergence
Relative Strength Index (RSI) divergence is a signal that indicates a price reversal. We can use RSI divergence to identify potential reversal points and combine it with the Three Outside Down pattern for trading. The steps are as follows:
- In an uptrend, observe the changes in the RSI indicator.
- Mark the high points of the price.
- Observe if RSI forms a divergence at the price highs (i.e., the price makes a new high while the RSI does not).
- Wait for the Three Outside Down pattern to appear at the RSI divergence high point.
- Short when the low of the last candlestick in the pattern is broken.
- Set a stop-loss at the other end of the pattern.
- Set a profit target, usually the previous low or a Fibonacci extension level.
For example, when a stock makes a new high, but the RSI does not, and forms a Three Outside Down pattern, you can choose to short when the low of the last candlestick in the pattern is broken, and set a stop-loss at the highest point of the pattern.
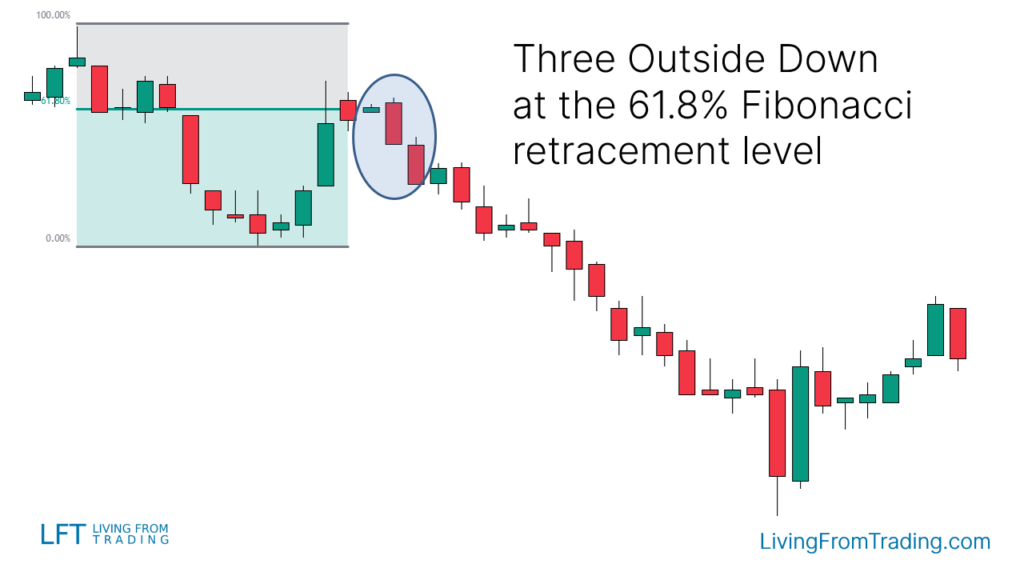
Strategy 5: Using Fibonacci Retracement
The Fibonacci retracement tool is a powerful tool for identifying price retracement levels. We can use the Fibonacci retracement tool to find the appearance of the Three Outside Down pattern. The steps are as follows:
- In a downtrend, observe the price retracement.
- Use the Fibonacci retracement tool to mark the key retracement levels (such as 38.2%, 50%, 61.8%).
- Observe if the price forms the Three Outside Down pattern at the Fibonacci retracement levels.
- Short when the low of the last candlestick in the pattern is broken.
- Set a stop-loss at the other end of the pattern.
- Set a profit target, usually the previous low or a Fibonacci extension level.
For example, when a stock forms a Three Outside Down pattern at the 61.8% Fibonacci retracement level, you can choose to short when the low of the last candlestick in the pattern is broken, and set a stop-loss at the highest point of the pattern.
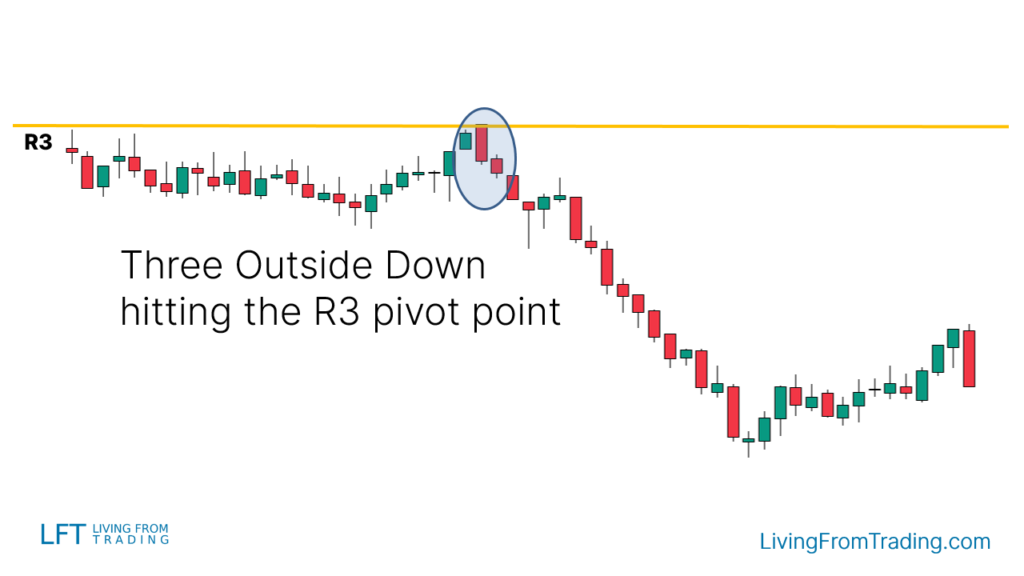
Strategy 6: Combining with Pivot Points
Pivot points are automatic support and resistance levels calculated using a mathematical formula. In day trading, daily pivot points are the most commonly used. We can use pivot points to identify the appearance of the Three Outside Down pattern. The steps are as follows:
- Enable the pivot points indicator.
- Observe which pivot points are above the price, these points will act as resistance levels.
- Wait for the price to rise and touch the pivot point resistance level.
- Observe if the Three Outside Down pattern appears at the pivot point resistance level.
- Short when the low of the last candlestick in the pattern is broken.
- Set a stop-loss at the other end of the pattern.
- Set a profit target, usually the previous low or a Fibonacci extension level.
For example, when a stock forms a Three Outside Down pattern at the daily pivot point resistance level, you can choose to short when the low of the last candlestick in the pattern is broken, and set a stop-loss at the highest point of the pattern.
Summary
The Three Outside Down pattern is a bearish reversal pattern consisting of three candlesticks, typically appearing after a price uptrend. Combining it with retracements, moving averages, and other technical indicators can enhance trading accuracy. Statistically, the pattern has a success rate of 70%.
Disclaimer: The views in this article are from the original Creator and do not represent the views or position of Hawk Insight. The content of the article is for reference, communication and learning only, and does not constitute investment advice. If it involves copyright issues, please contact us for deletion.
![[2023 Forecast] Helium One Stock](https://hawk-oss.hawkinsight.com/hawk/image/20231129/Helium One_2457601304_307.png?w=3840&q=100)


![[2023 Forecast] Juniper Networks Stock](https://hawk-oss.hawkinsight.com/hawk/image/20231128/图片1_2373572917_105.png?w=3840&q=100)


