Inverted Hammer Candlestick Pattern - What Is And How To Trade
Learn all about the Inverted Hammer candlestick pattern.What is, how to trade, and all the best trading strategies.
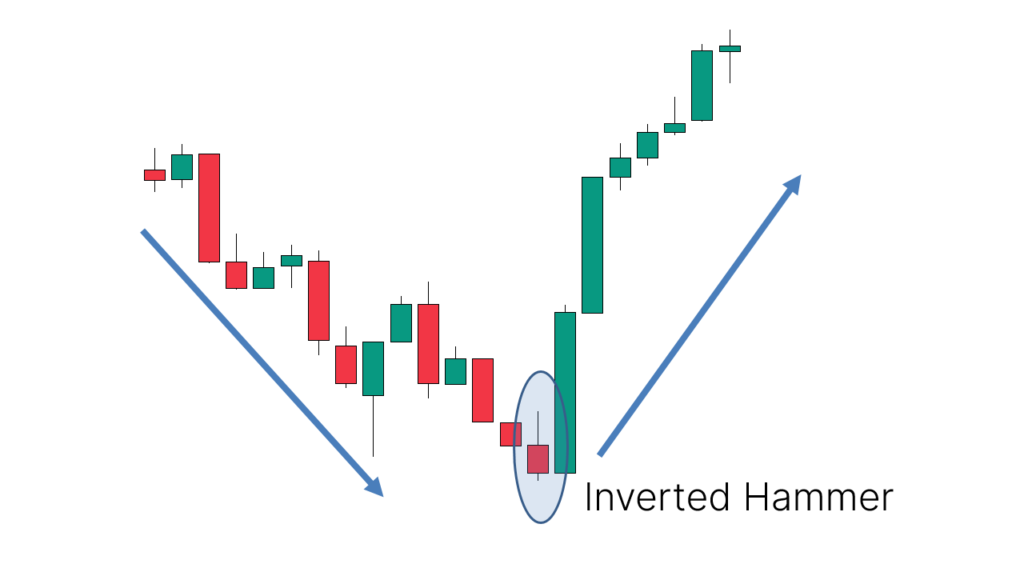
The "Inverted Hammer" is a Japanese candlestick pattern that belongs to the bullish reversal category. It typically appears after a price decline and indicates rejection of lower prices.
As the "Inverted Hammer" appears in the right location, we anticipate a potential upward reversal, making it a bullish pattern and a common signal of trend reversal. The "Inverted Hammer" pattern is also a mirrored version of the "Hammer" candlestick pattern.
How to Identify the "Inverted Hammer" Candlestick Pattern
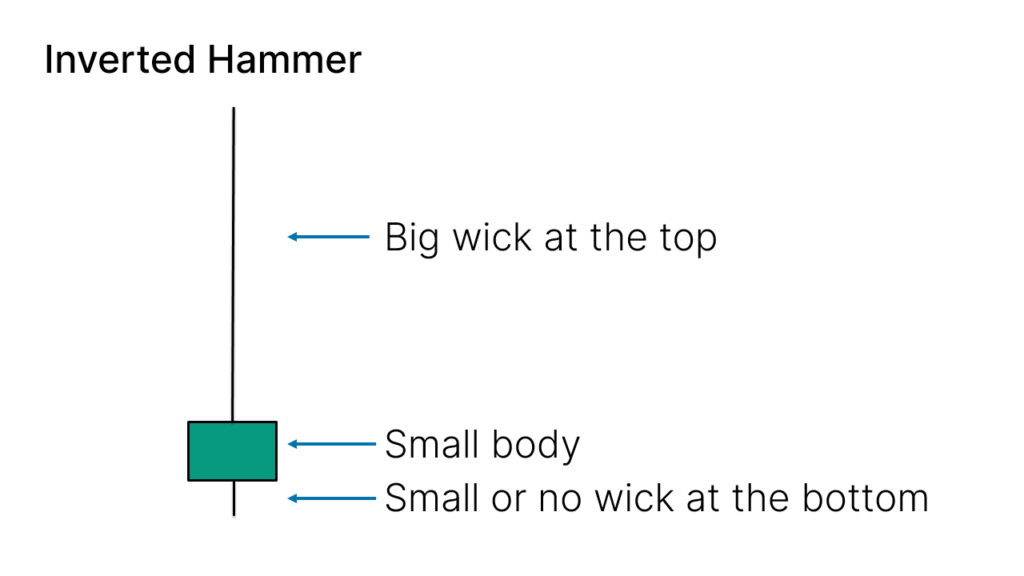
The "Inverted Hammer" is formed by a single candlestick. Here’s how to identify the "Inverted Hammer" candlestick pattern:
- The candle has a small body, indicating short-term suppression of price movement.
- The upper shadow is relatively long, suggesting selling pressure at the highest point of the price.
- There is no lower shadow, or it is very small, indicating strong buying pressure rebounding from the bottom support.
- The color of the candle body doesn't matter; it can be red or green—the key lies in the candlestick's shape.
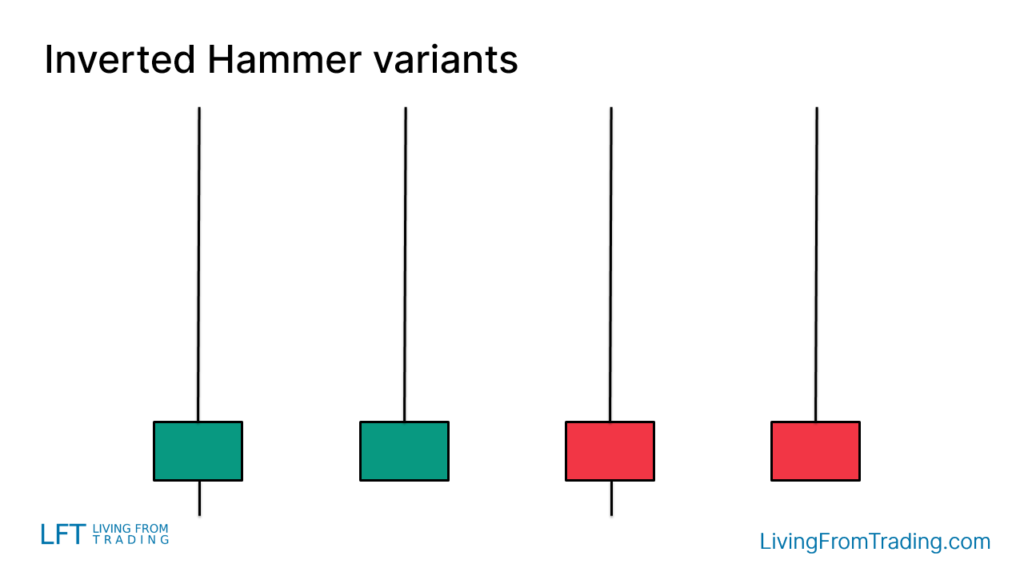
Variants of the "Inverted Hammer" Candlestick Pattern
The appearance of the "Inverted Hammer" candlestick pattern may vary slightly on different charts. The color of the candle body can be red or green (bearish or bullish), and the presence or absence of a lower shadow is not crucial as long as it is very small.
How to Trade
To trade the "Inverted Hammer" candlestick pattern, it's not enough to simply identify a candle with the same shape on the chart. Ensuring effectiveness involves considering where the candlestick pattern appears.
When the "Inverted Hammer" appears after a price decline, it indicates a potential reversal to the upside. In such cases, traders typically wait for the high of the candle to be broken as a conservative entry signal.
Trading Strategies
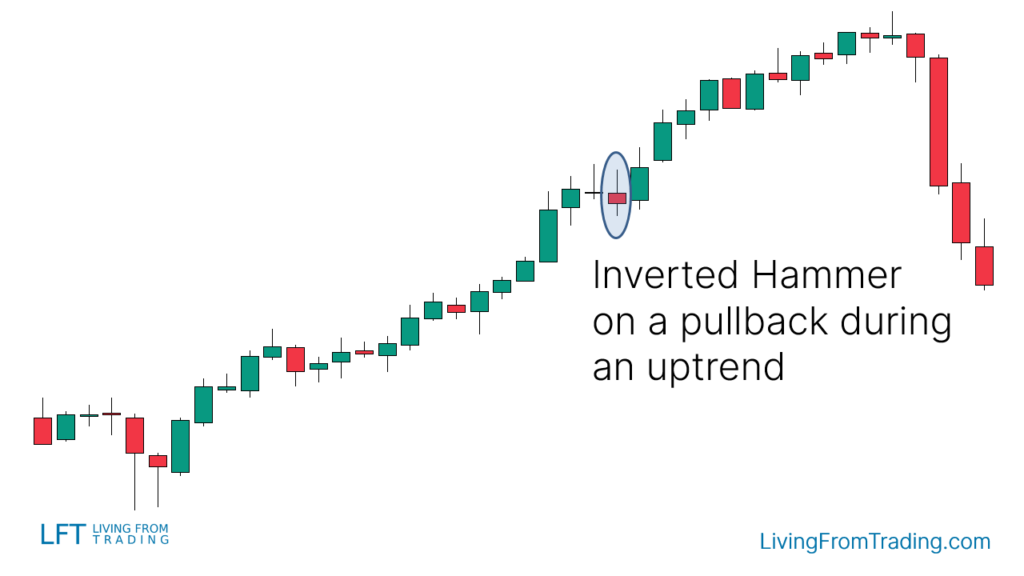
Strategy 1: Naked Chart Pullbacks
As a bullish reversal pattern, the "Inverted Hammer" is an excellent pattern to watch for during uptrends.
Wait for a pullback to occur and observe the timing of the "Inverted Hammer," often signaling the end of the pullback and the start of a new uptrend leg.
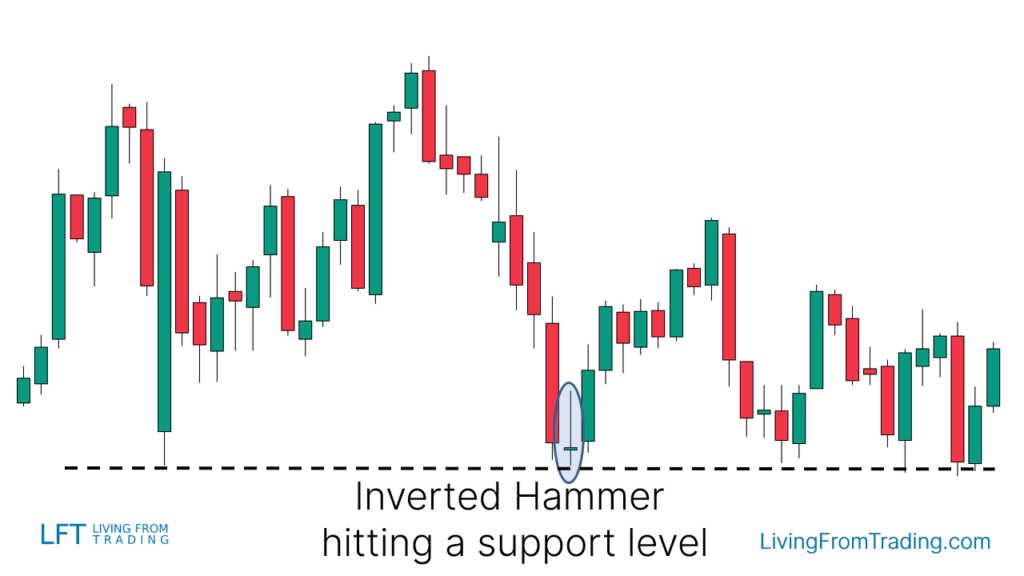
Strategy 2: Trading with Support Levels
Support and resistance levels are ideal places to find price reversals. Since we anticipate price increases, we use support levels to trade the "Inverted Hammer." Here's how:
- Draw support levels on your charts.
- Wait for the price to decline and touch the support level.
- Check if an "Inverted Hammer" appears at that level.
- Go long when the price breaks the high of the "Inverted Hammer."
- Set your stop-loss and take-profit levels, anticipating an upward movement.
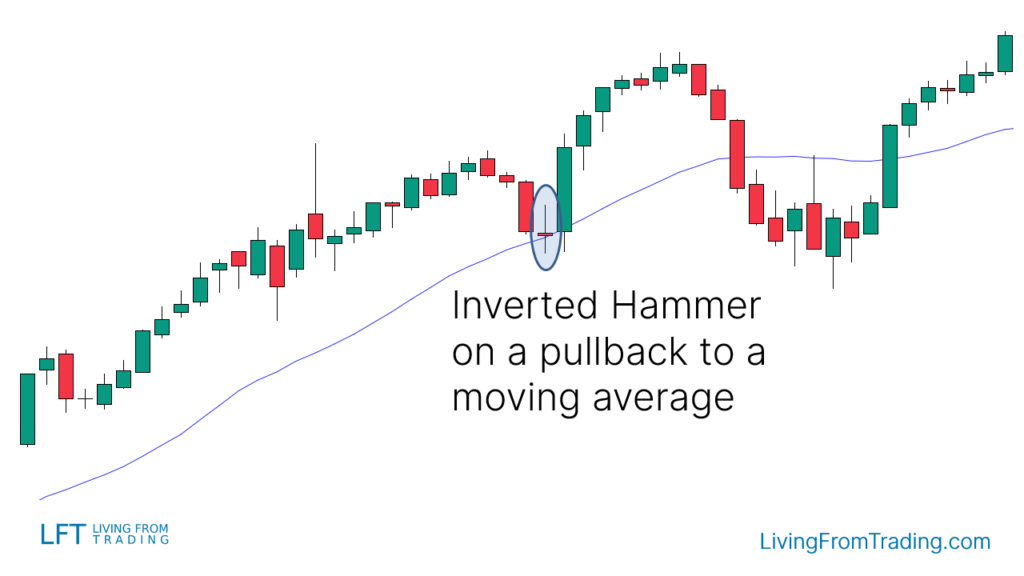
Strategy 3: Trading with Moving Averages
Moving averages are excellent indicators for trading trends. In an uptrend, follow these steps:
- Identify an uptrend with prices rising above a moving average.
- Wait for a price decline to the moving average.
- Check if an "Inverted Hammer" appears at the moving average.
- Go long when the price breaks the high of the "Inverted Hammer."
- Set your stop-loss and take-profit levels, expecting another upward movement.
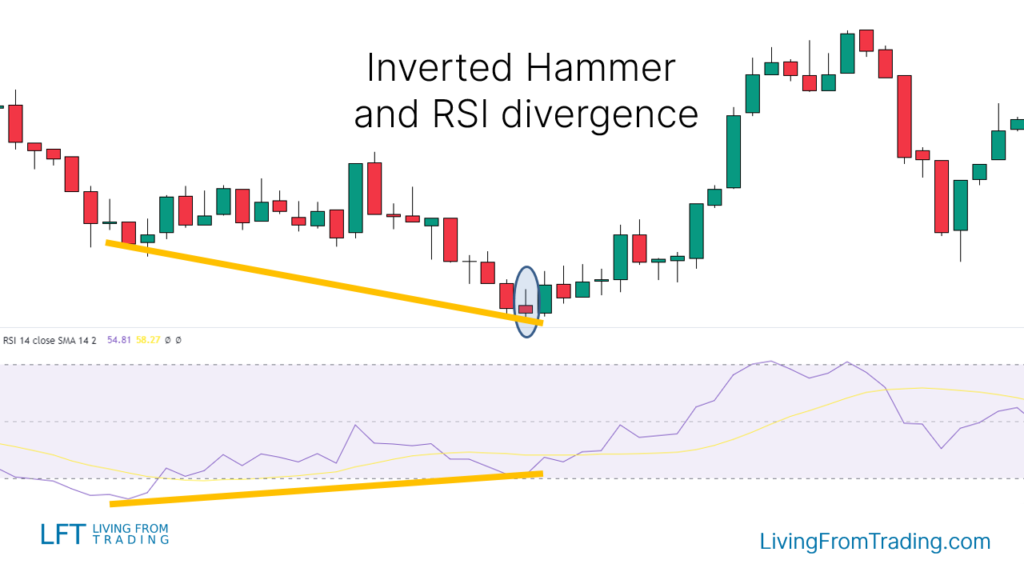
Strategy 4: Trading with RSI Divergence
This strategy differs from others. To find bullish RSI divergence, observe the following steps:
- Identify a downtrend.
- Mark the lows made by the price after each downturn.
- Simultaneously compare the price lows with the RSI indicator.
- When the RSI forms higher lows while the price forms lower lows, divergence is identified.
- Wait for an "Inverted Hammer" to appear at a lower price low, aligned with higher RSI lows.
- Go long when the price breaks the high of the "Inverted Hammer."
- Set your stop-loss and take-profit levels, expecting an upward movement.
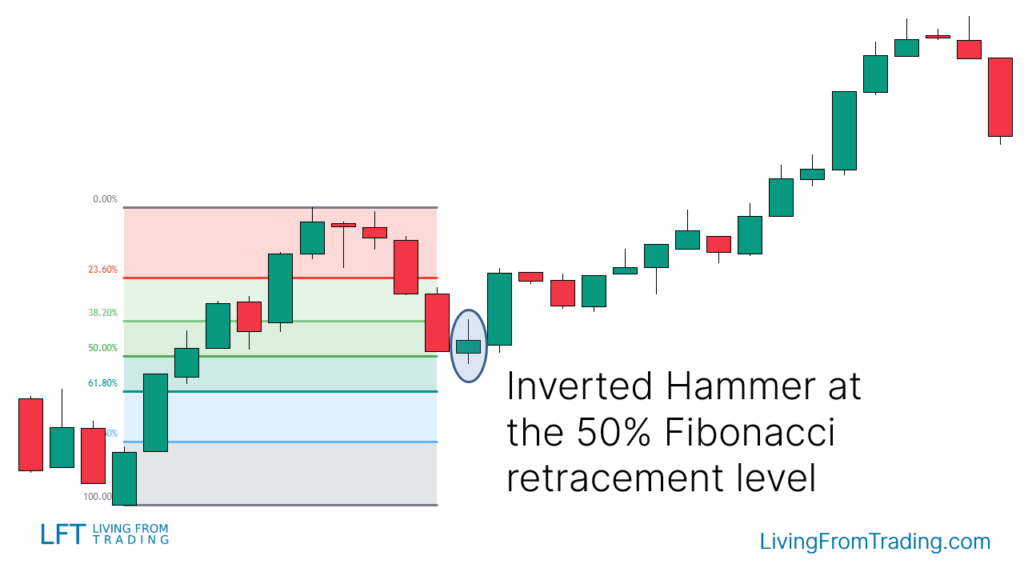
Strategy 5: Trading with Fibonacci
Another popular method of trading the "Inverted Hammer" candlestick pattern involves using the Fibonacci retracement tool. Fibonacci shows retracement levels where prices frequently revert. Here’s how the strategy works:
- First, identify an uptrend.
- Then, wait for a retracement, which occurs at some point.
- Select your Fibonacci tool and draw levels from the low to the high of the move.
- When the price hits a Fibonacci level and forms an "Inverted Hammer," that’s your signal.
- Go long when the price breaks the high of the "Inverted Hammer."
- Set your stop-loss and take-profit levels, anticipating an upward movement.
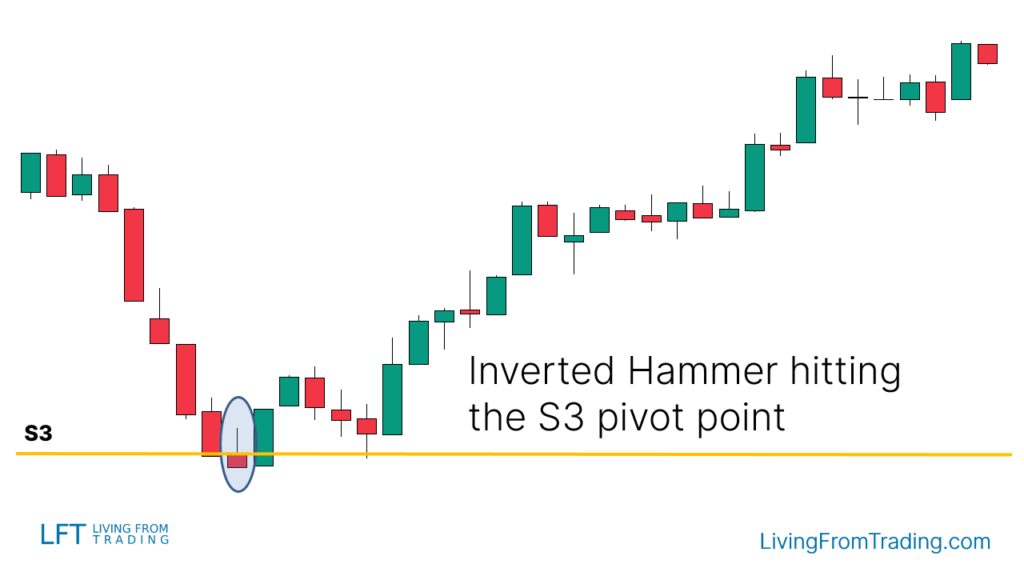
Strategy 6: Trading with Pivot Points
Pivot Points are automatic support and resistance levels calculated using mathematical formulas. For day trading, daily Pivot Points are the most popular, although weekly and monthly are also frequently used. Here’s how to trade the "Inverted Hammer" pattern with Pivot Points:
- Activate the Pivot Points indicator on your charts.
- Check which Pivot Points are below the price; these typically act as support.
- Ideally, you want to see the price in an uptrend, although it's not a requirement.
- Wait for the price to decline to a Pivot Point level.
- At that level, watch for an "Inverted Hammer" pattern to appear, indicating a rejection of the price decline.
- Go long when the price breaks the high of the "Inverted Hammer."
- Set your stop-loss and take-profit levels, anticipating an upward movement.
Conclusion
The "Inverted Hammer" candlestick pattern is a bullish reversal pattern that typically appears after a price decline, indicating a potential reversal to the upside. To effectively trade the "Inverted Hammer," it's essential not only to identify its shape but also to consider where it appears and combine it with other technical analysis tools.
With a success rate of approximately 67%, incorporating appropriate stop-loss and profit-taking targets can enhance trading accuracy and potential profitability.
Disclaimer: The views in this article are from the original Creator and do not represent the views or position of Hawk Insight. The content of the article is for reference, communication and learning only, and does not constitute investment advice. If it involves copyright issues, please contact us for deletion.


