Tweezer Bottom Candlestick Pattern - What Is And How To Trade
Learn all about the Tweezer Bottom candlestick pattern.What is, how to trade, and all the best trading strategies.
The Tweezer Bottom is a Japanese candlestick pattern used to identify potential market reversals. This article provides a detailed explanation of the Tweezer Bottom candlestick pattern, including its definition, identification methods, and trading strategies.
What is the Tweezer Bottom Candlestick Pattern?
The Tweezer Bottom is a bullish reversal pattern that typically appears after a price decline, indicating a potential rebound at lower levels. It consists of two similar candles: the first is a bearish (downward) candle, and the second is a bullish (upward) candle. The lows of both candles are generally at the same level. This pattern suggests a potential reversal to an upward trend.
How to Identify the Tweezer Bottom Candlestick Pattern
To identify the Tweezer Bottom pattern, focus on the following:
- First Candle: Should be a bearish (downward) candle.
- Second Candle: Should be a bullish (upward) candle.
- Lows: The lows of both candles should be approximately at the same level.
_2134097598_123.png)
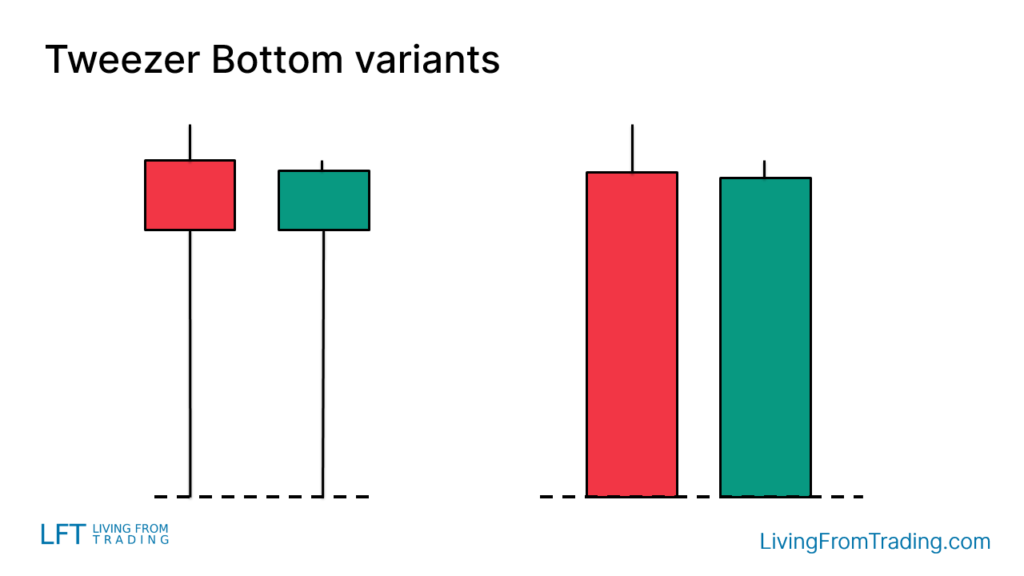
Variants of the Tweezer Bottom Candlestick Pattern
Variants of the Tweezer Bottom pattern may include:
- Long Lower Wicks: Similar to hammer candles, long lower wicks can indicate a strong buying signal.
- No Wicks: Sometimes the candles may have no lower wicks, resembling a bullish engulfing pattern.
How to Trade
Trading the Tweezer Bottom pattern requires more than just identifying the shape; the pattern's location also plays a crucial role. Here are some trading strategies:
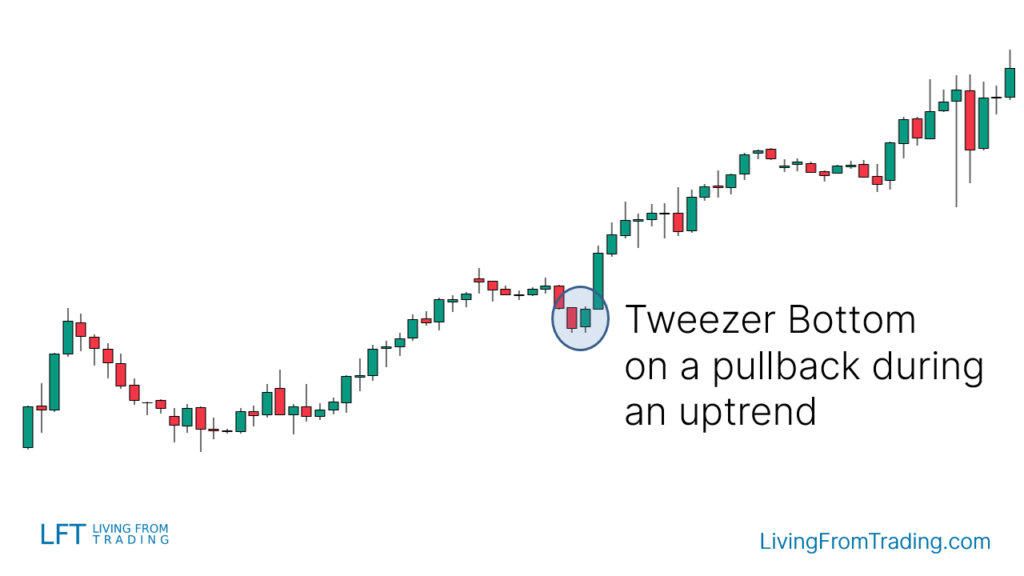
Strategy 1: Pullbacks on Naked Charts
As a bullish reversal pattern, the Tweezer Bottom is significant when the price is in an uptrend. Look for a pullback and then identify the Tweezer Bottom pattern, which often signals the end of the pullback and the beginning of a new upward movement.
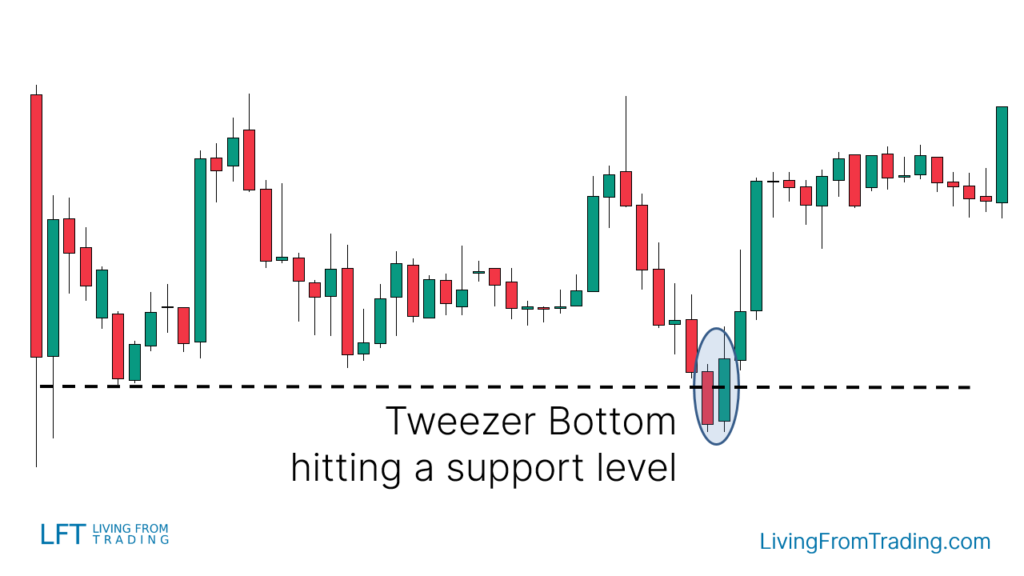
Strategy 2: Trading the Tweezer Bottom with Support Levels
Support and resistance levels are key to identifying price reversals. When the Tweezer Bottom appears at a support level, it can signal a buying opportunity. Steps include:
- Draw support levels on your charts.
- Wait for the price to decline to the support level.
- Check if a Tweezer Bottom pattern appears at this level.
- Buy when the price breaks the high of the last candle in the Tweezer Bottom pattern.
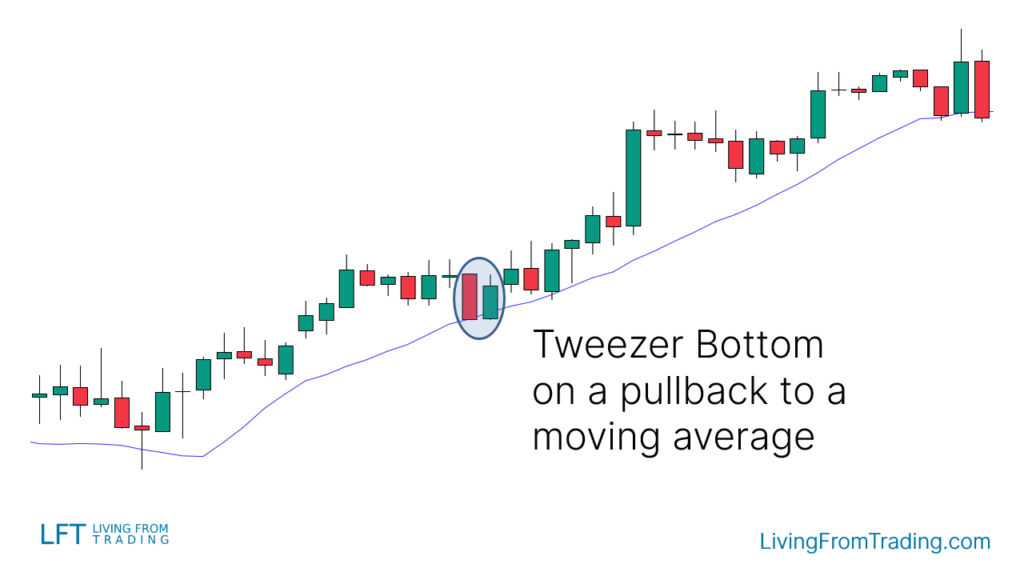
Strategy 3: Trading the Tweezer Bottom with Moving Averages
Moving averages are useful for trading trends. To trade the Tweezer Bottom pattern with moving averages:
- Identify an uptrend where the price is above a moving average.
- Wait for a price decline to the moving average.
- Confirm the Tweezer Bottom pattern at the moving average.
- Buy when the price breaks the high of the last candle in the Tweezer Bottom pattern.
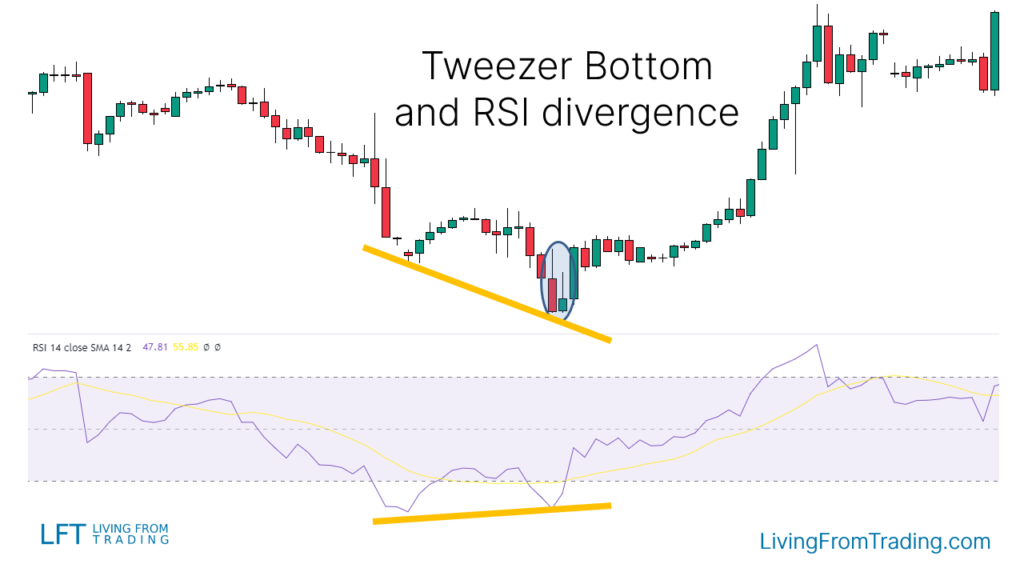
Strategy 4: Trading the Tweezer Bottom with RSI Divergences
For RSI divergence, look for the following:
- Identify a downtrend with lower lows and lower highs.
- Compare these lows with the RSI indicator.
- Look for instances where RSI shows higher lows while the price shows lower lows.
- Confirm a Tweezer Bottom pattern at these lower price lows aligned with higher RSI lows.
- Buy when the price breaks the high of the last candle in the Tweezer Bottom pattern.
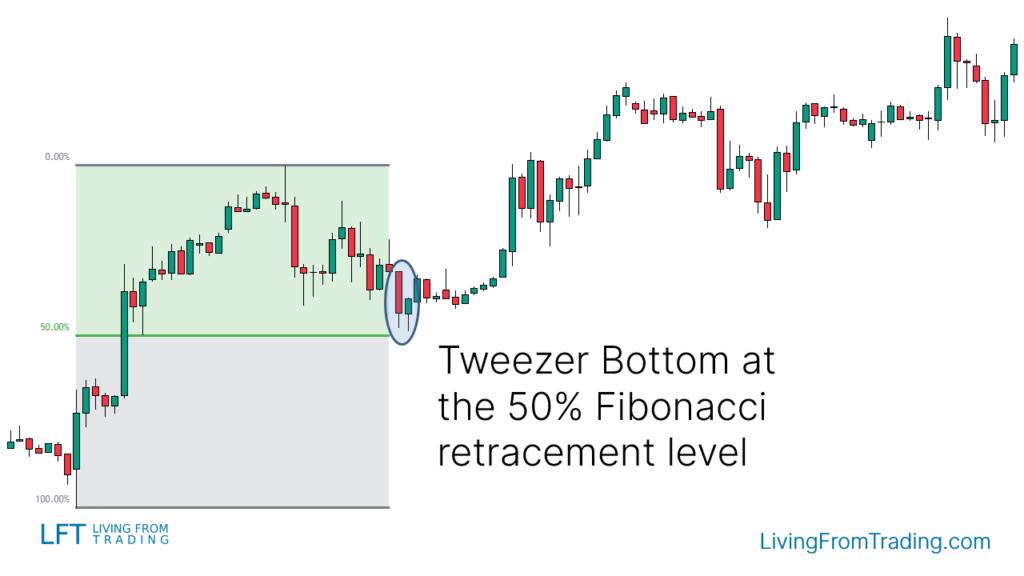
Strategy 5: Trading the Tweezer Bottom with Fibonacci
The Fibonacci retracement tool can be used to trade the Tweezer Bottom pattern. Here’s how:
- Identify an uptrend.
- Wait for a price decline.
- Use the Fibonacci tool to draw levels from the low to the high of the move.
- When the price hits a Fibonacci level and forms a Tweezer Bottom, it may signal a buying opportunity.
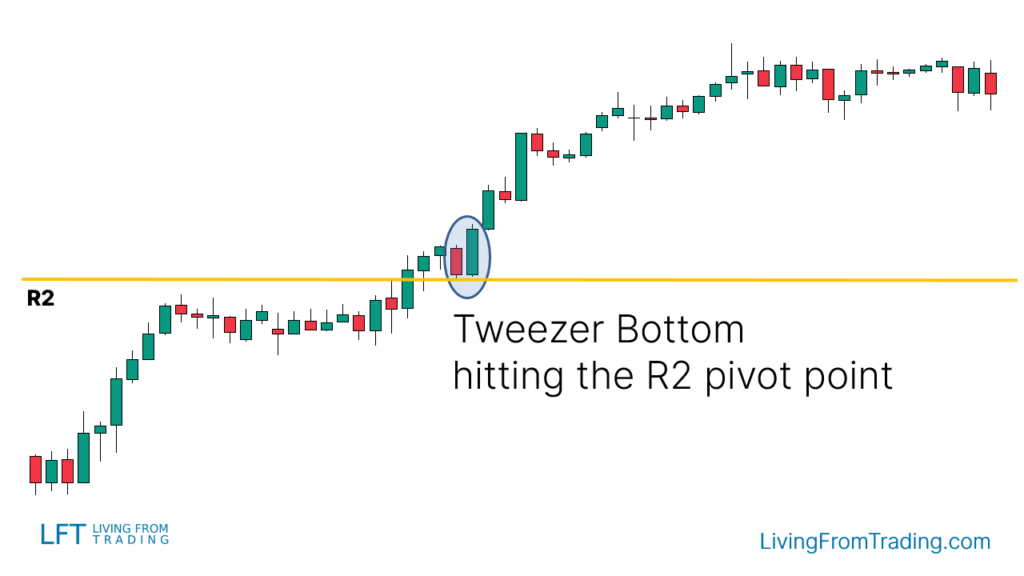
Strategy 6: Trading the Tweezer Bottom with Pivot Points
Pivot Points are automatic support and resistance levels calculated mathematically. To use Pivot Points:
- Activate the Pivot Points indicator on your charts.
- Identify Pivot Points below the price, which may act as support.
- Wait for a price decline to a Pivot Point level.
- Look for a Tweezer Bottom pattern at this level, indicating rejection of the level.
Summary
According to Thomas N. Bulkowski’s Encyclopedia of Candlestick Charts, the Tweezer Bottom pattern has a success rate of 56%.
The Tweezer Bottom is a bullish reversal pattern that indicates a potential upward trend reversal following a price decline. Combining the Tweezer Bottom pattern with other technical indicators and strategies, such as support levels, moving averages, RSI divergences, Fibonacci retracement, and Pivot Points, can enhance trading accuracy and success. The pattern has a 56% success rate, making it a valuable tool for traders to consider for making informed trading decisions.
Disclaimer: The views in this article are from the original Creator and do not represent the views or position of Hawk Insight. The content of the article is for reference, communication and learning only, and does not constitute investment advice. If it involves copyright issues, please contact us for deletion.
![[2023 Forecast] Amigo Stock](https://hawk-oss.hawkinsight.com/hawk/image/20231128/图片1_2390728484_528.png?w=3840&q=100)