XRP Price Poised for Drop Below Key Support Even as ETF Filing Progresses
Despite SEC progress on the XRP ETF, XRP's price shows bearish signs, trading near key support levels and facing further downside risk.
- The SEC officially acknowledges Bitwise's XRP ETF filing, but XRP's price drops, showing a lack of market enthusiasm.
- XRP trades near the lower trend line of its symmetrical triangle, signaling a potential bearish breakout if key support is broken.
- XRP faces a crucial moment as it struggles below its 20-day EMA and dynamic resistance at $3.12, with the potential for a drop to $2.24.

On February 18, the US Securities and Exchange Commission (SEC) officially acknowledged Bitwise’s XRP exchange-traded fund (ETF) filing. However, despite the regulatory progress, XRP’s price reaction has remained muted, continuing its downward trajectory.
With a strengthening bearish bias, the altcoin is poised to break below a key support level.
XRP’s Performance Remains Lackluster
The SEC has acknowledged various XRP ETF applications in the past week. On February 13, the regulator confirmed the filing from Grayscale, which was submitted in late January.
On Tuesday, Bitwise’s filing and a similar one from CBOE were formally recognized despite being just over a week old. However, XRP’s price reaction to this development has been underwhelming. It has continued its downward trend and now trades at the lower trend line of its symmetrical triangle.
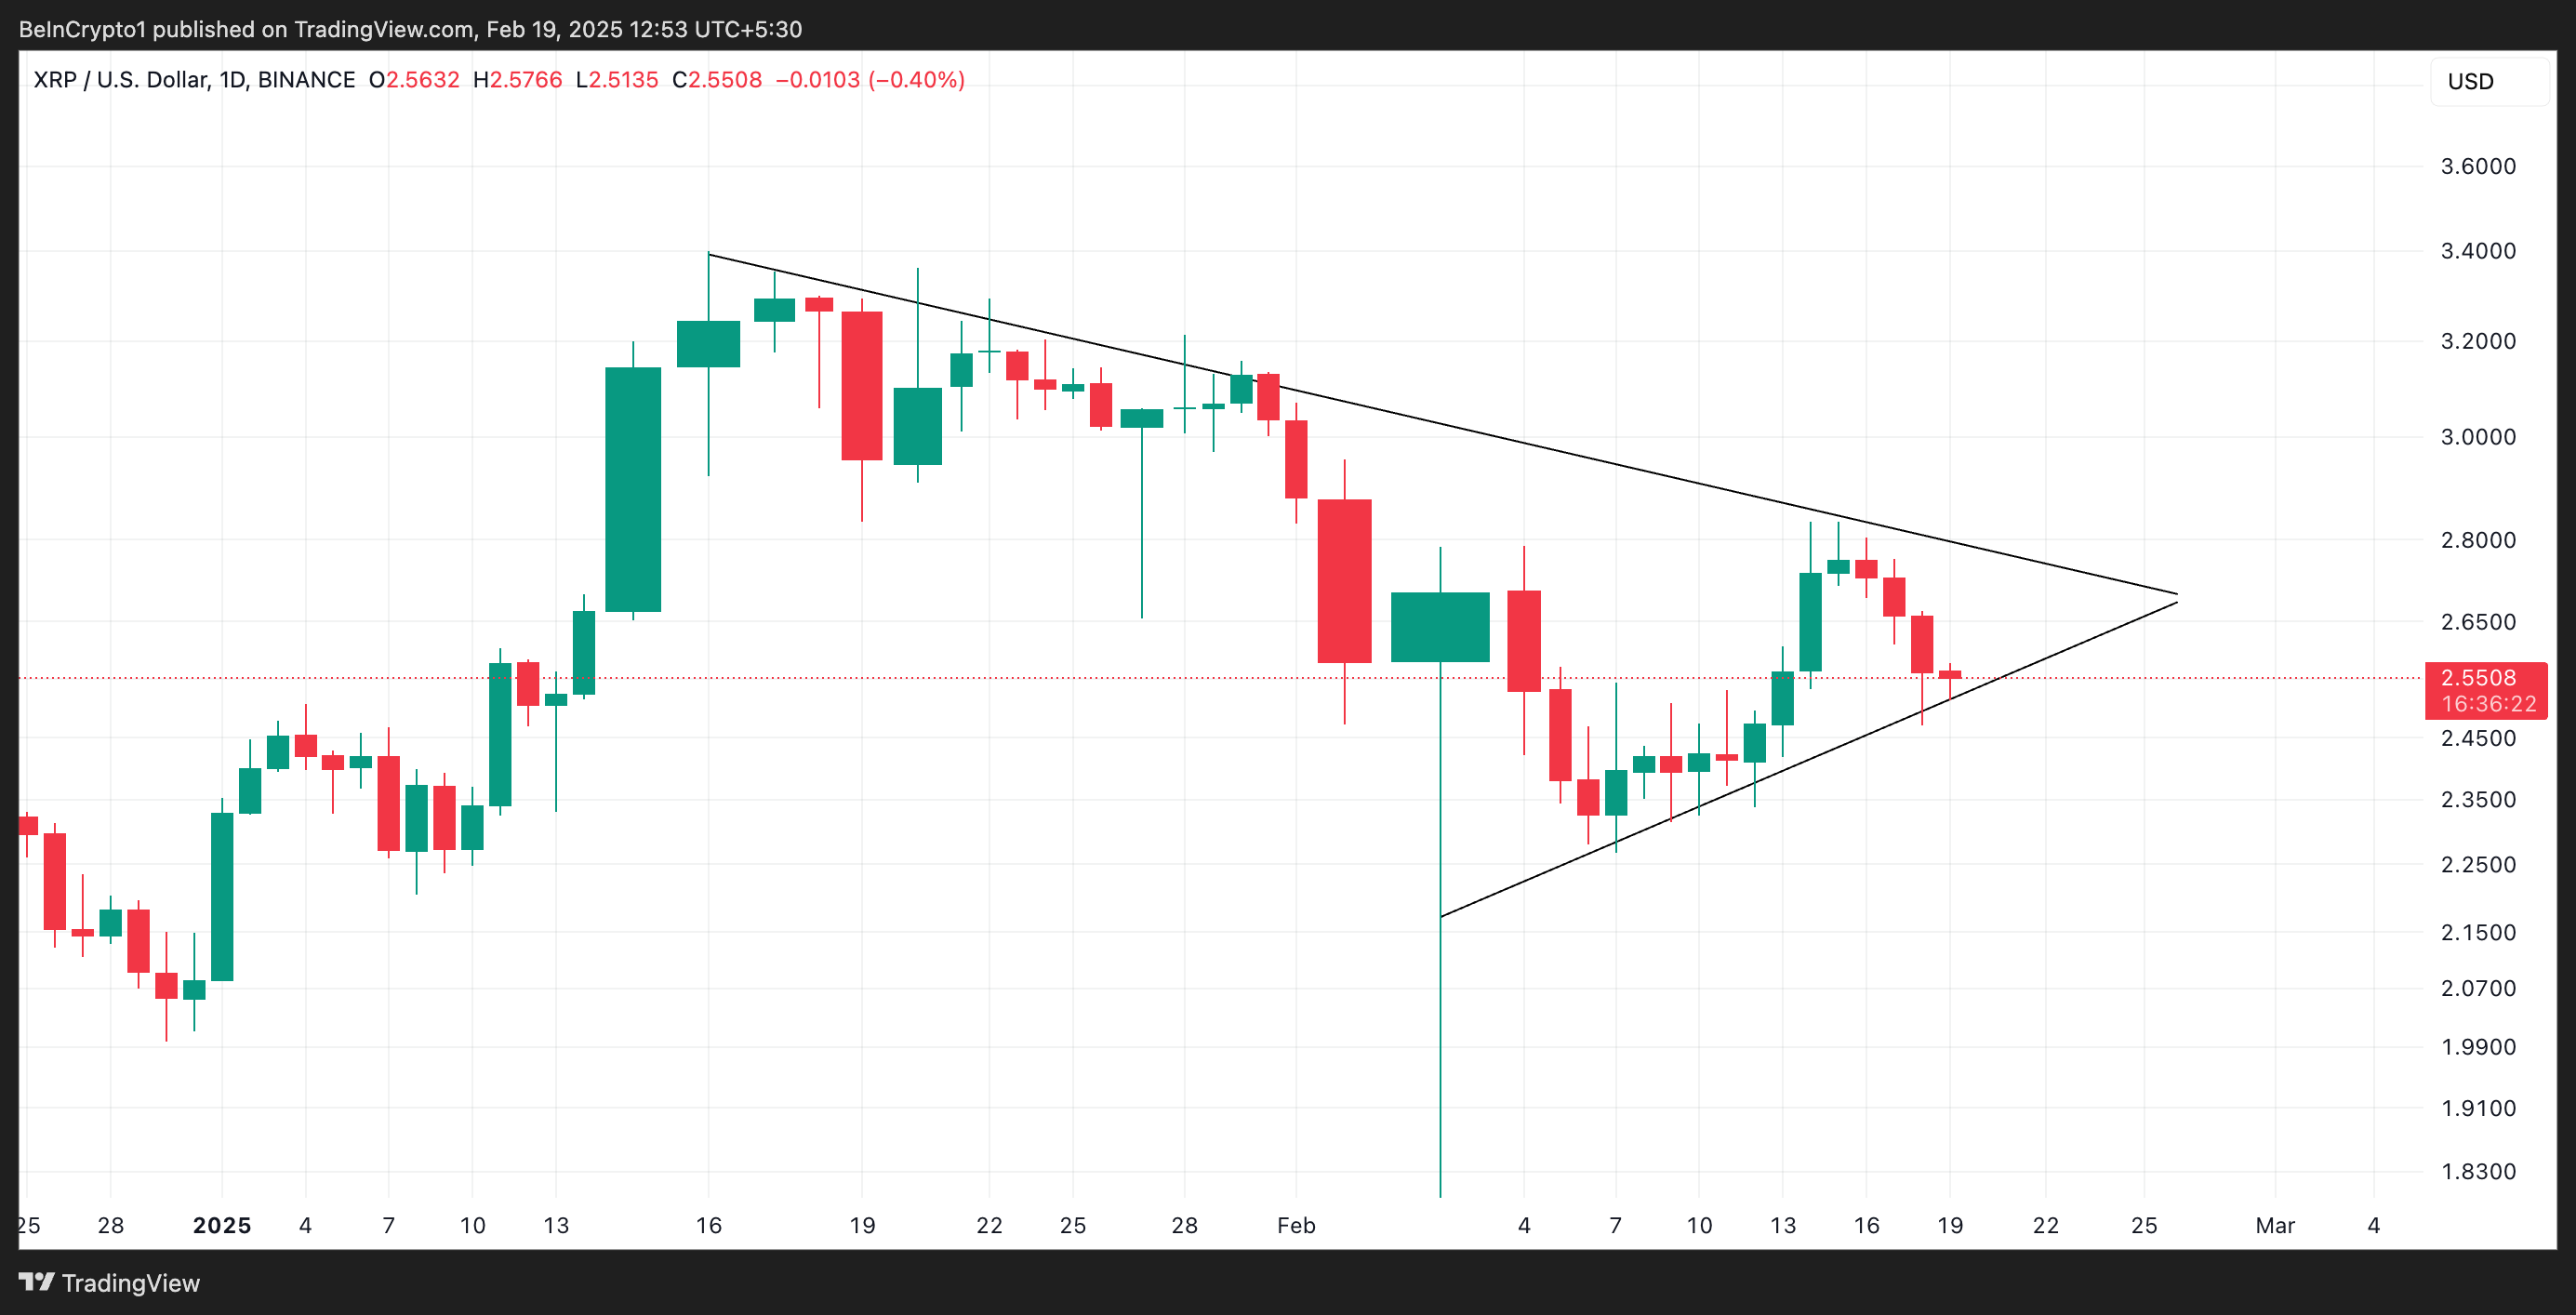
An assessment of the XRP/USD one-day chart reveals that the altcoin has traded within a symmetrical triangle pattern since it reached an all-time high (ATH) of $3.39 on January 16. This pattern is formed when an asset’s price trades within two converging trendlines, indicating a period of consolidation and decreasing volatility.
However, due to the climbing selling pressure over the past few days, XRP has traded near the lower trend line of this pattern. This confirms the market’s surging selloffs and hints at the potential for a bearish breakout if the support level fails to hold.
Furthermore, XRP trades below its 20-day exponential moving average (EMA), confirming this bearish outlook.
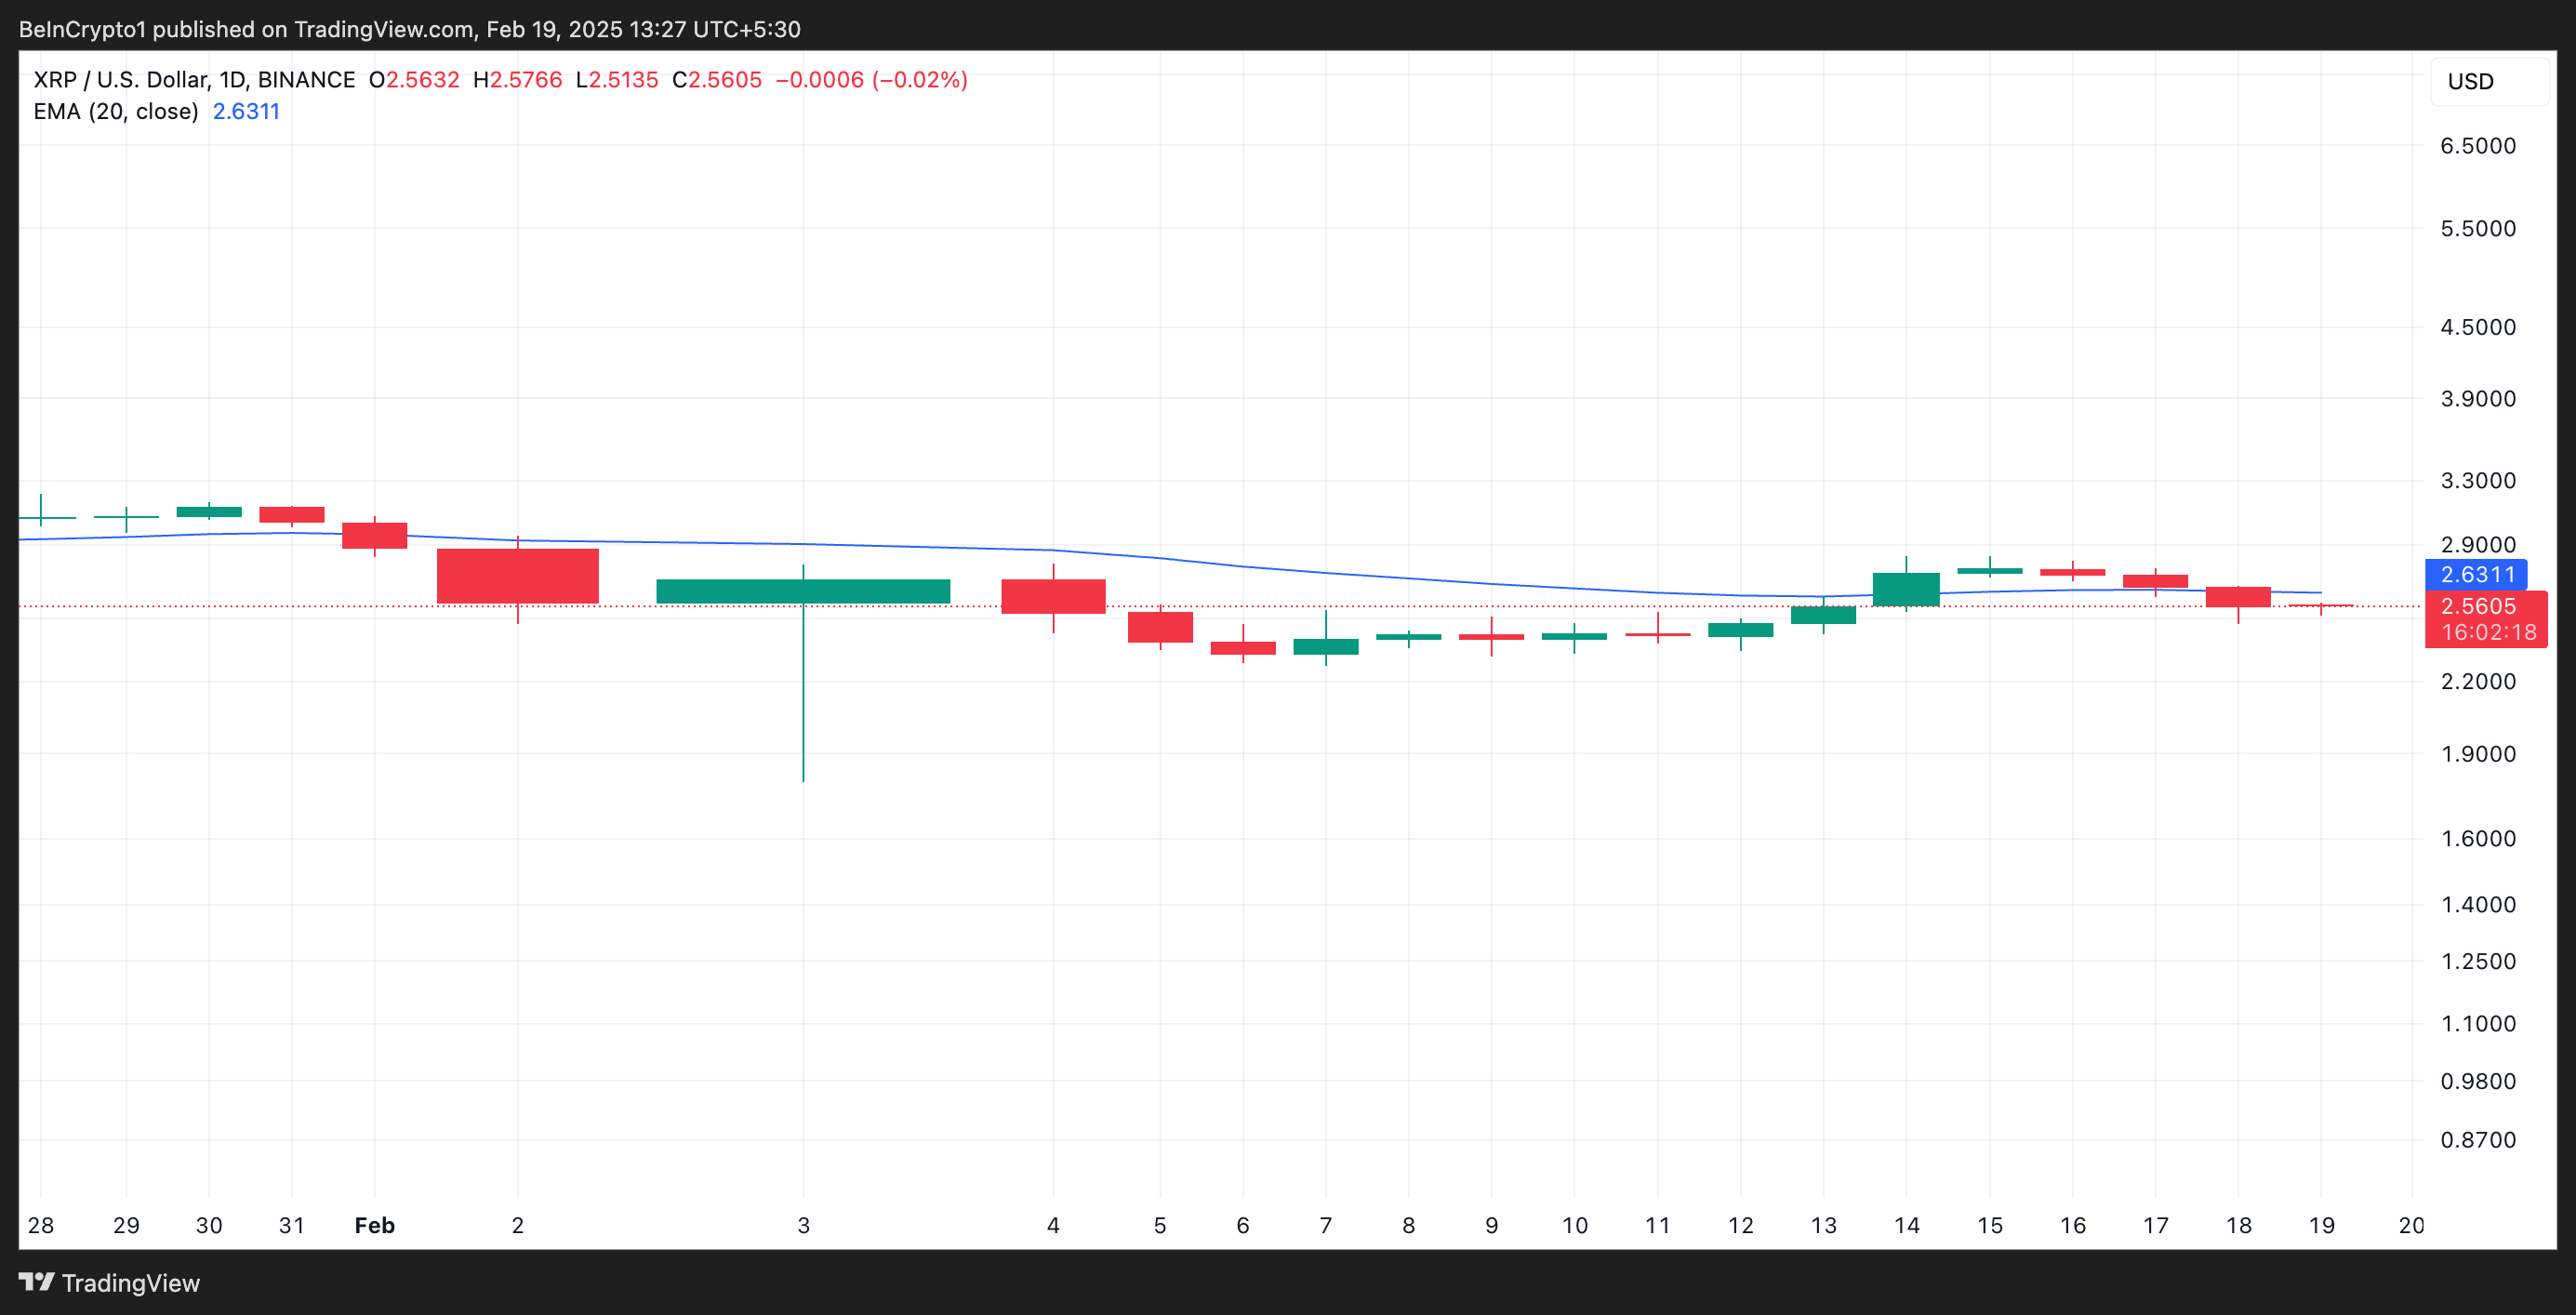
This indicator measures an asset’s average price over the past 20 trading days, giving more weight to recent prices to reflect current market trends. When an asset’s price trades below it, the market is in a downtrend as selling pressure mounts.
XRP Faces Make-or-Break Moment
At press time, XRP’s Super Trend indicator forms dynamic resistance above its price at $3.12. When an asset’s price trades under this line, it signals a bearish trend. It suggests that selling pressure is dominant, and further downside movement may follow.
If selloffs continue, XRP’s price could break below the lower trend line of its symmetrical triangle pattern, plummeting toward $2.24.
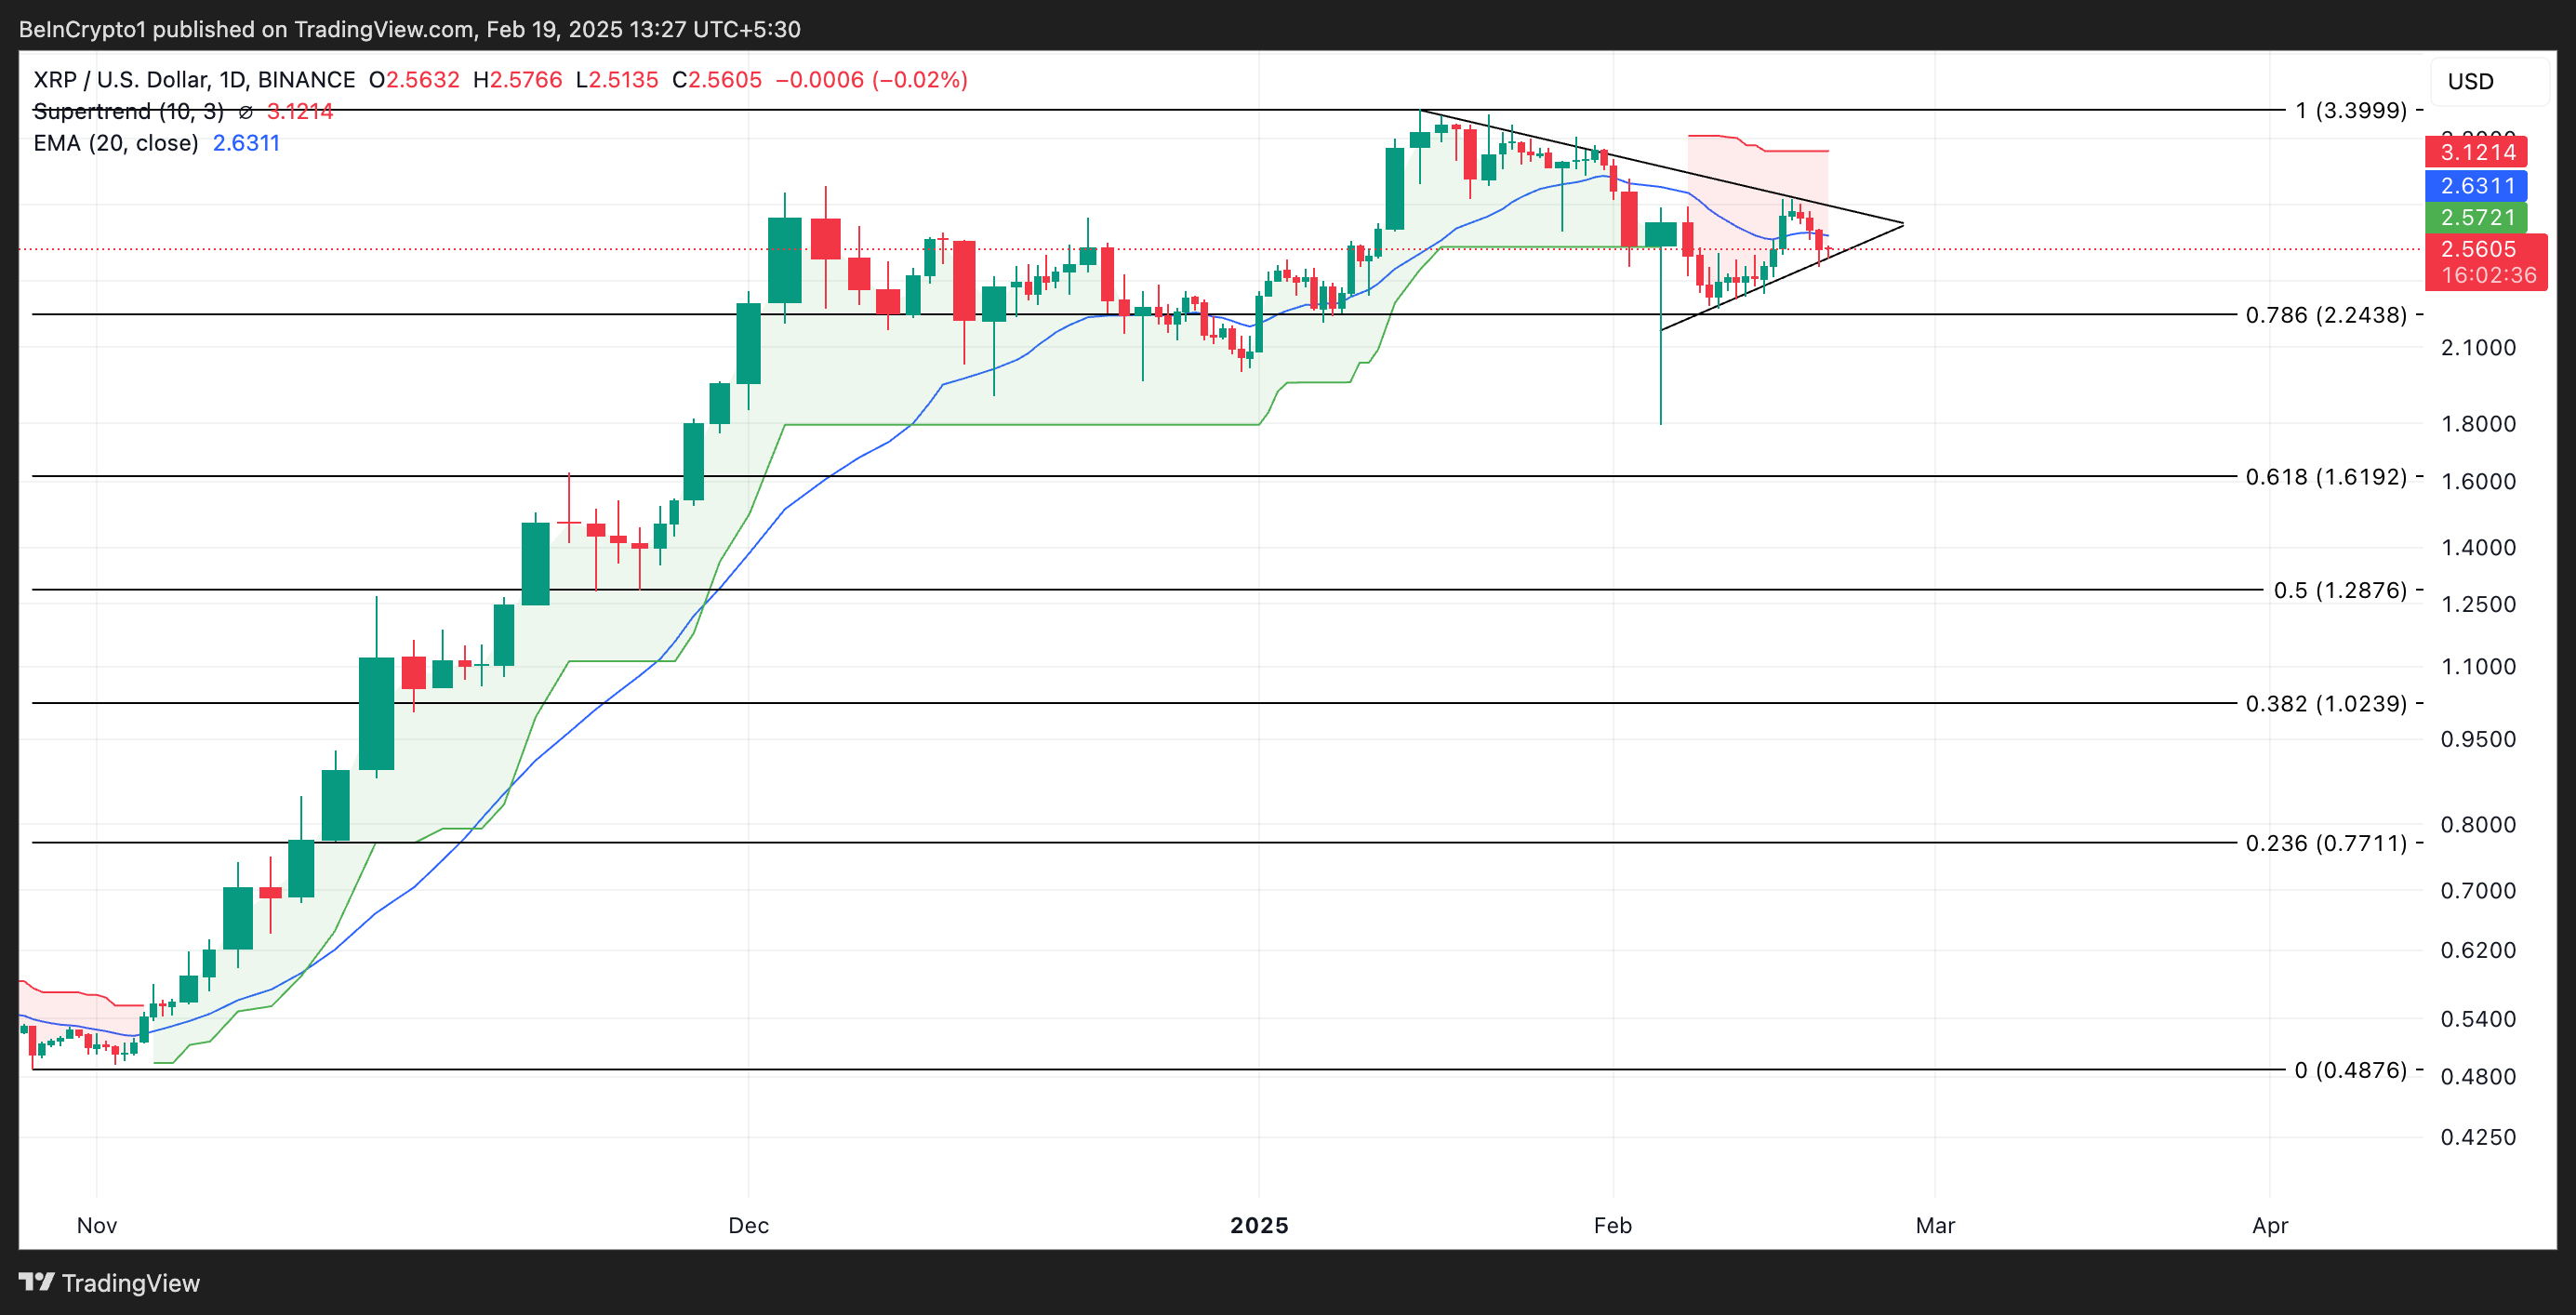
Conversely, a positive shift in market sentiment will invalidate this bearish projection. If XRP demand soars, its price could rally above the upper line of its symmetrical triangle pattern and attempt to breach the dynamic resistance formed at $3.12.
Disclaimer: The views in this article are from the original Creator and do not represent the views or position of Hawk Insight. The content of the article is for reference, communication and learning only, and does not constitute investment advice. If it involves copyright issues, please contact us for deletion.


