Gold Short-Term Price Outlook: Gold / USD Waiting for Breakthrough
Gold prices stagnate at upward resistance level after breaking through March opening range
Gold Technical Outlook: Gold / USD Short Term Trading Points
Gold prices stagnate at upward resistance level after breaking through March opening range
Gold / USD consolidation below - above 1912 still favorable
Resistance levels 1978, 2000, 2009 (key) - support levels 1950 +, 1933, 1912 / 18 (bottom line)
Gold prices are up a staggering 24% from their November 2022 lows, with Gold / USD surging more than 10% this month alone。Last week's rally stalled at uptrend resistance, and the risk of a larger correction in the broader uptrend range remains.。These are the important latest target and invalidation levels on the gold / USD short-term technical chart.。
Gold Price Chart - Gold / USD Daily Chart
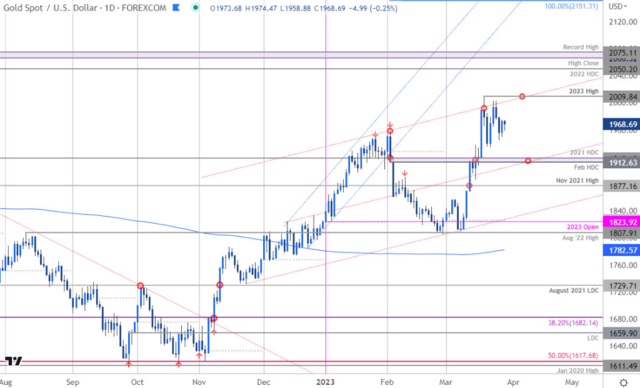
The chart was compiled by Michael Boutros, Senior Technical Strategist;
Technical Outlook: In last month's gold short-term price outlook, we noted that gold / USD, which broke through the March opening range, is approaching initial resistance and "eventually needs to break / close above the November 2021 high of 1877 to drive the next rally."。On March 13, gold broke through that barrier, rising more than 11% above its monthly low.。A few days later, the gains were struggling in the face of uptrend resistance due to momentum divergence, and prices are now waiting for guidance and seeking a breakthrough within the consolidation pattern below。
Gold Price Chart - Gold / USD 240 Minutes
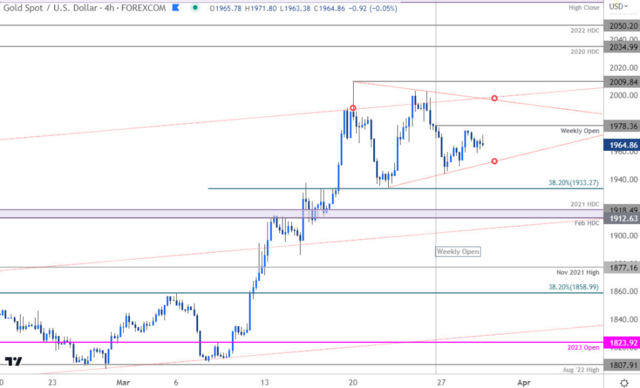
The chart was compiled by Michael Boutros, Senior Technical Strategist;
Note: Take a closer look at the gold price movement, Gold / USD is now trading within a symmetrical triangle around the week's opening price of 1978.。The resistance is located at the intersection of the highlighted slashes (near 2000), the upper break / close is higher than the high of the year 2009, marking the resumption of a wider upward trend, will move towards the daily high closing price of 2034 in 2020, the daily high closing price of 2050 in 2022, the historical high closing price of 2066 / high 2075。
The initial support is located on the consolidation slash (currently 1950 +), followed by 38 on the moon line.2% Fibonacci retracement level 1933 and February / 2021 daily high close 1912 / 18 - both areas could mean a lack of downside momentum / price inflection point once touched。
Summary: Gold consolidates below uptrend resistance, awaits breakthrough。From a trading perspective, the risk of a pullback to uptrend support remains, and within this pattern - if the price is lower, the rally should not exceed the opening price of the week 1978 - we are waiting for the lows after the trend breaks down in the coming days, and the closing price above the previous highs signals a resumption of the rally。As always, be cautious here and be flexible at the end of the month / season。Review the latest gold weekly technical forecast to understand the gold / USD trading point from a longer perspective。
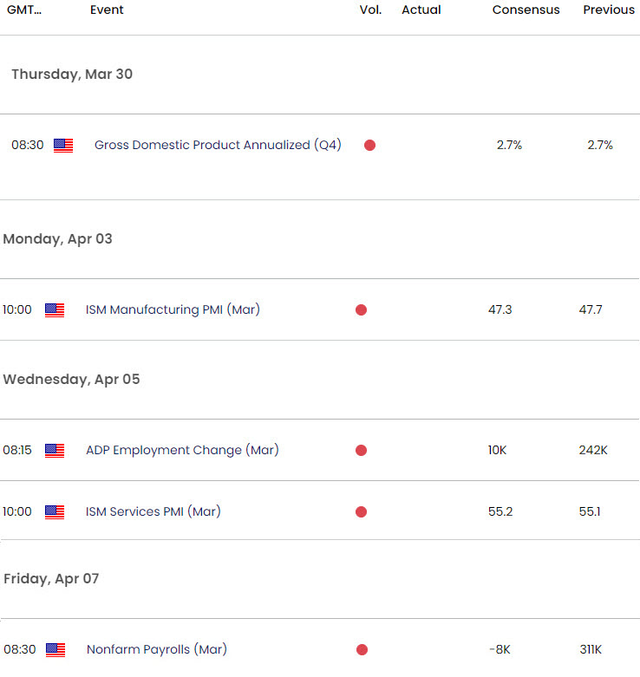
Key Economic Data Releases
Disclaimer: The views in this article are from the original Creator and do not represent the views or position of Hawk Insight. The content of the article is for reference, communication and learning only, and does not constitute investment advice. If it involves copyright issues, please contact us for deletion.


_918061884_279.jpeg?w=3840&q=100)


_680238114_281_2562062419_546.png?w=256&q=100)


