Cardano Recovers After 36% Weekly Plunge, Retests $0.64
Key momentsCardanos ADA price rebounds slightly after a significant drop, retesting a critical support level around $0.64.On-chain data indicates growing bullish sentiment, with the funding rate turni
Key moments
- Cardano’s ADA price rebounds slightly after a significant drop, retesting a critical support level around $0.64.
- On-chain data indicates growing bullish sentiment, with the funding rate turning positive and bullish bets reaching a monthly high.
- Despite positive indicators, a daily close below $0.57 would invalidate the bullish outlook, potentially leading to further declines.
Technical and On-Chain Analysis Suggest Potential for ADA Rebound
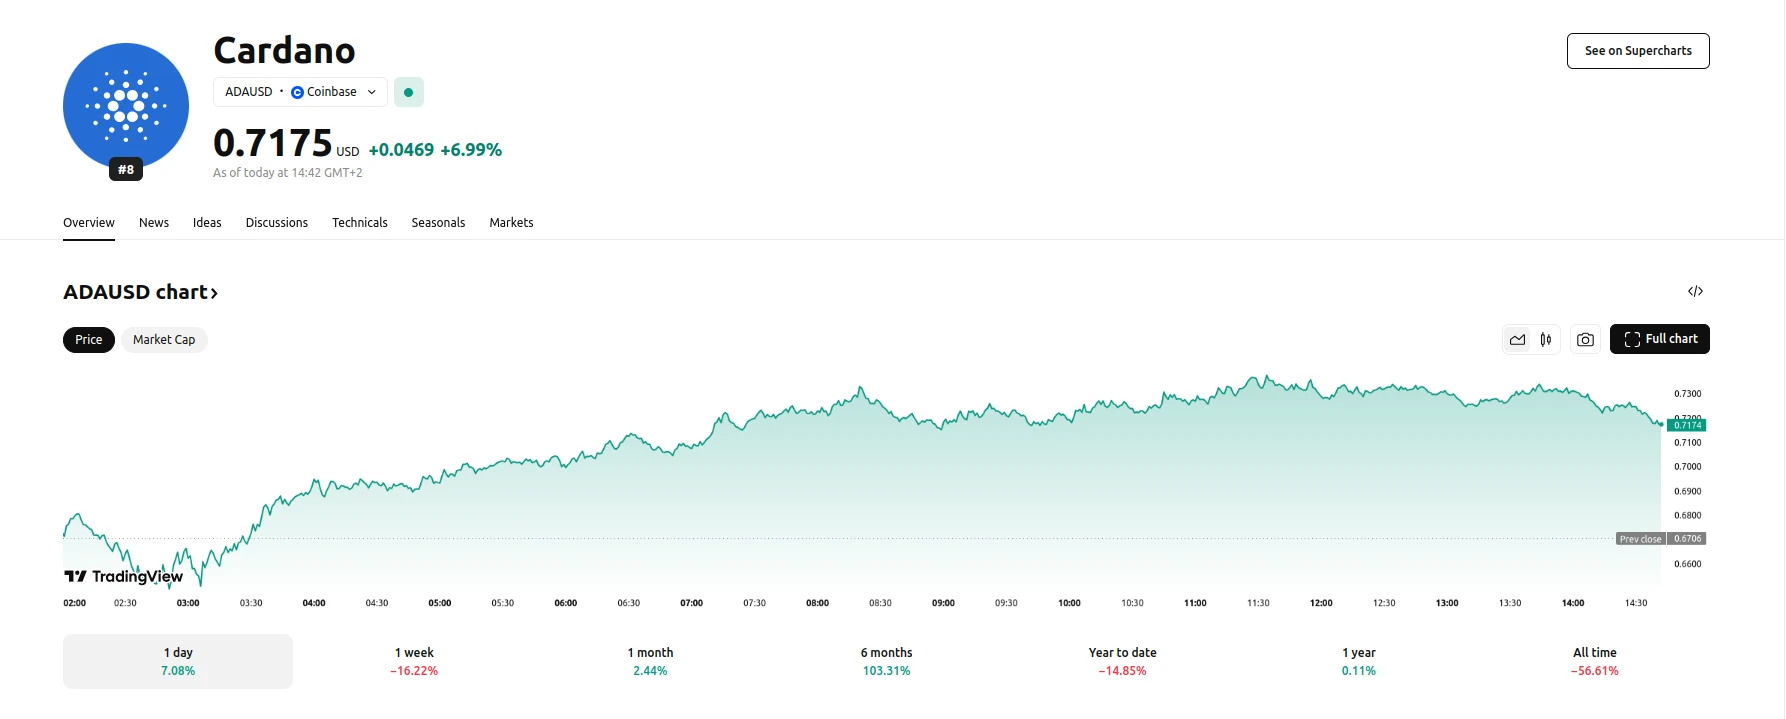
Cardano’s ADA cryptocurrency experienced a modest recovery on Tuesday, trading near $0.70, following a nearly 7% decline the previous day. This rebound coincides with on-chain metrics that suggest a potential reversal of the recent downward trend. The cryptocurrency has retested a critical support level at approximately $0.64, a point that aligns with multiple technical indicators, including a previously broken descending trendline and a key Fibonacci retracement level. This area also corresponds to a bullish order block, where institutional traders have historically placed buy orders.
The positive on-chain data reinforces the potential for a recovery. The long-to-short ratio for ADA (1.06) has reached a monthly high, indicating increased bullish sentiment among traders. Additionally, the OI-Weighted Funding Rate has turned positive, suggesting that more traders are betting on a price increase rather than a decline. This shift in funding rates, where long positions are paying short positions, is often interpreted as a sign of growing optimism in the market.
However, despite these positive indicators, the market remains cautious. The Relative Strength Index (RSI) remains below the neutral level of 50, indicating ongoing bearish momentum.
Furthermore, a daily candlestick close below $0.57 would invalidate the current bullish thesis, potentially leading to a retest of the next support level at $0.50. Therefore, while current data suggests a potential recovery, market participants are closely monitoring key support levels for confirmation of a sustained uptrend.
Disclaimer: The views in this article are from the original Creator and do not represent the views or position of Hawk Insight. The content of the article is for reference, communication and learning only, and does not constitute investment advice. If it involves copyright issues, please contact us for deletion.