Dark Cloud Cover Candlestick Pattern - What Is And How To Trade
Learn all about the Dark Cloud Cover candlestick pattern.What is, how to trade, and all the best trading strategies.
The "Dark Cloud Cover" is a Japanese candlestick pattern, categorized as a bearish reversal pattern. It typically appears after a price increase, indicating rejection from higher levels. This pattern signals a potential downturn, as the emergence of the "Dark Cloud Cover" generally suggests an expected price decline. It is essentially the inverse of the "Piercing Line" pattern.
How to Identify the "Dark Cloud Cover" Candlestick Pattern
- First Candle: Bullish (closing price higher than opening price), showing the market is moving up.
- Second Candle: Bearish (closing price lower than opening price), opening above the closing price of the first candle and closing below the 50% mark of the body of the first candle.
- Pattern Characteristics: The second candle may have a long upper shadow, reflecting a stronger rejection from higher prices.
_66617618_72.png)
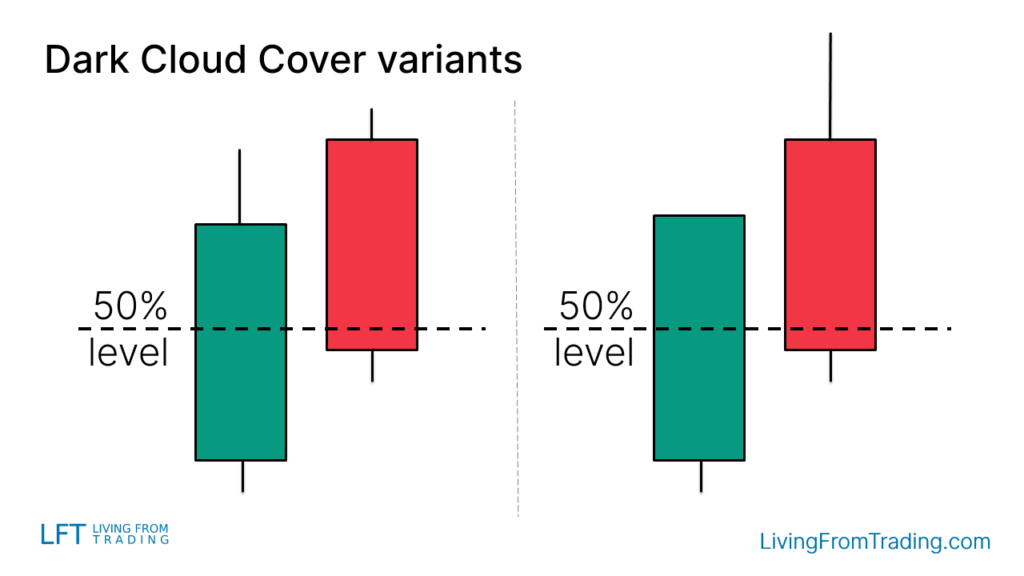
Variants of the "Dark Cloud Cover" Pattern
The pattern might appear differently on charts:
- With Long Shadows: The second candle may have a longer upper shadow, indicating stronger resistance at higher levels.
- Color Variations: The colors of the candlesticks (bullish and bearish) might vary, reflecting different market sentiments.
How to Trade
To trade the "Dark Cloud Cover" pattern effectively, follow these steps:
-
Confirm the Signal: The pattern should ideally form after a price increase, indicating a possible reversal. Confirm the pattern's validity by checking if it appears near significant resistance levels or technical indicators.
-
Entry Timing: Wait for the low of the second candle in the "Dark Cloud Cover" pattern to be broken. Consider shorting when the price falls below this level.
-
Setting Stop-Loss: A common stop-loss strategy is to place it on the other side of the pattern (i.e., at the high of the second candle) to protect against price reversals.
-
Setting Targets: Use other technical analysis tools, such as support levels or historical volatility ranges, to set target prices. Employ a reasonable risk-reward ratio for target planning.
_66612328_142.png)
Trading Strategies
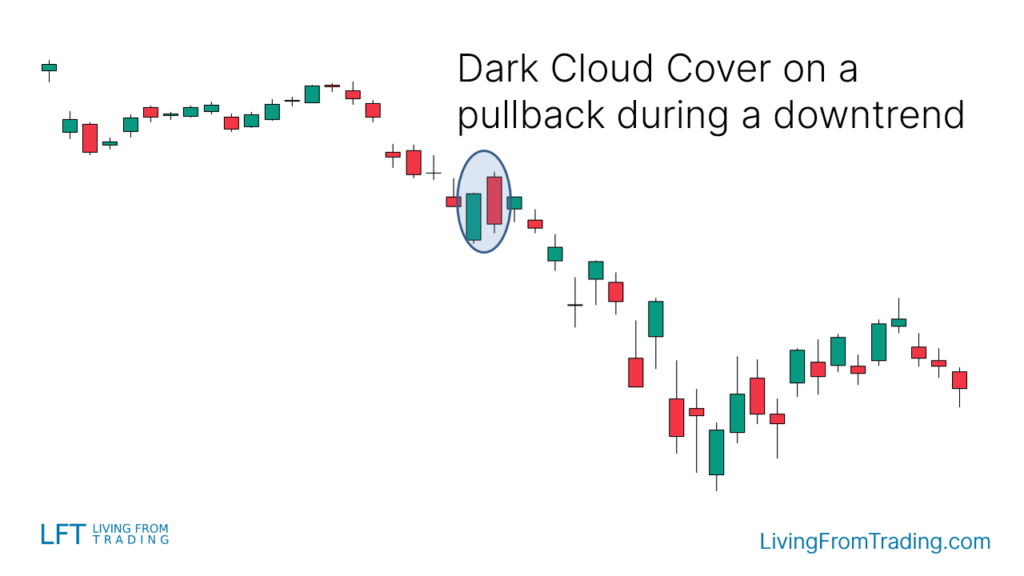
Strategy 1: Pullbacks on Naked Charts
- Description: In a downtrend, wait for a pullback and then look for the "Dark Cloud Cover" pattern, which often signals the end of the pullback and the beginning of a new downtrend.
- Implementation: Short when the price breaks below the pullback low after the "Dark Cloud Cover" forms. Set a stop-loss at the pattern's high and target the next support level.
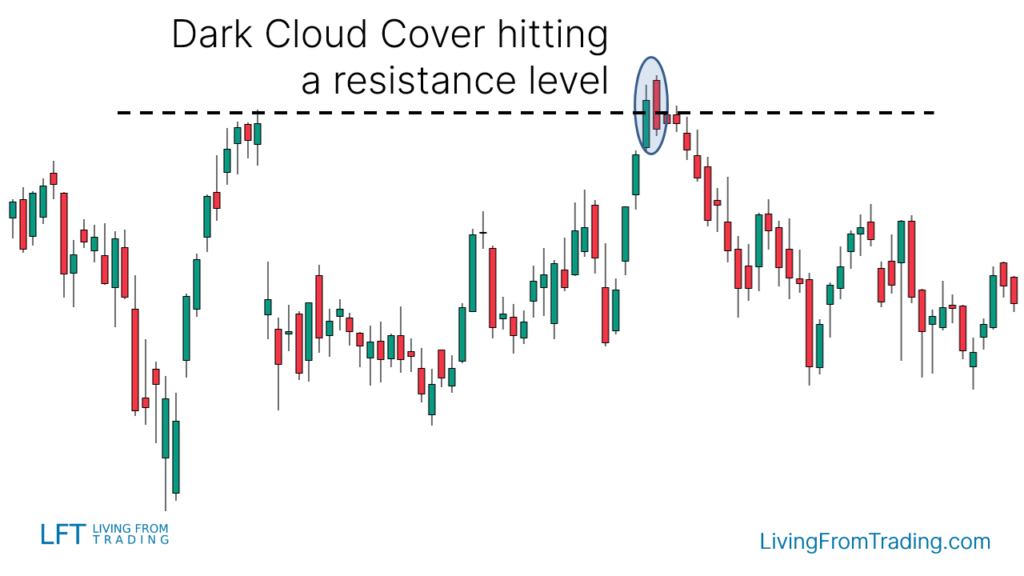
Strategy 2: Combining with Resistance Levels
- Description: The pattern at significant resistance levels indicates strong resistance and potential decline.
- Implementation: Mark resistance levels on the chart. Short when the price hits these levels and the "Dark Cloud Cover" forms, confirming the signal. Set stop-loss at the pattern's high and target the next support level.
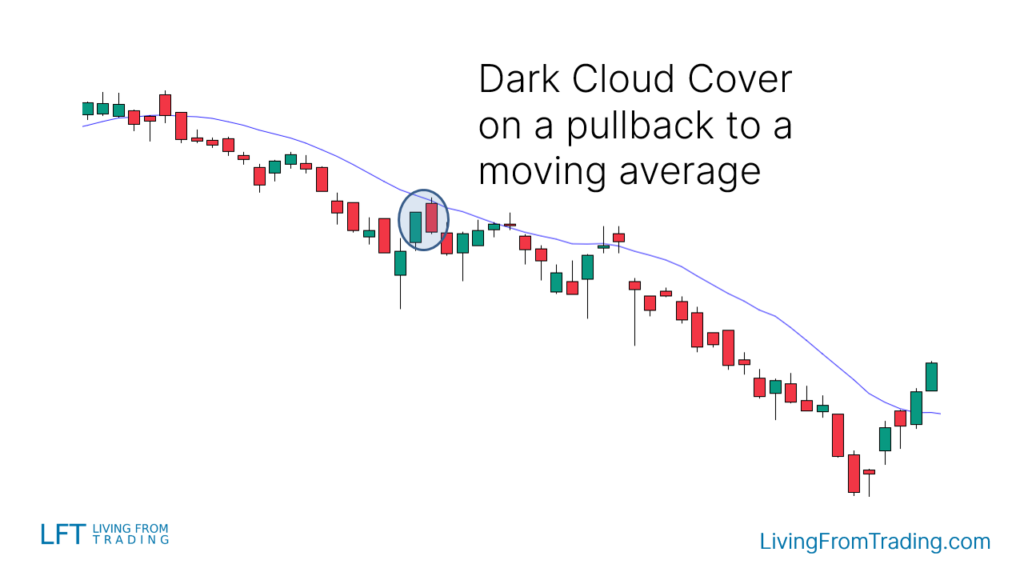
Strategy 3: Combining with Moving Averages
- Description: Moving averages help identify trends and pullbacks.
- Implementation: In a downtrend, when the price rises to the moving average and forms the "Dark Cloud Cover," short when the price breaks below the pullback low. Set stop-loss at the pattern's high and target the next support level.
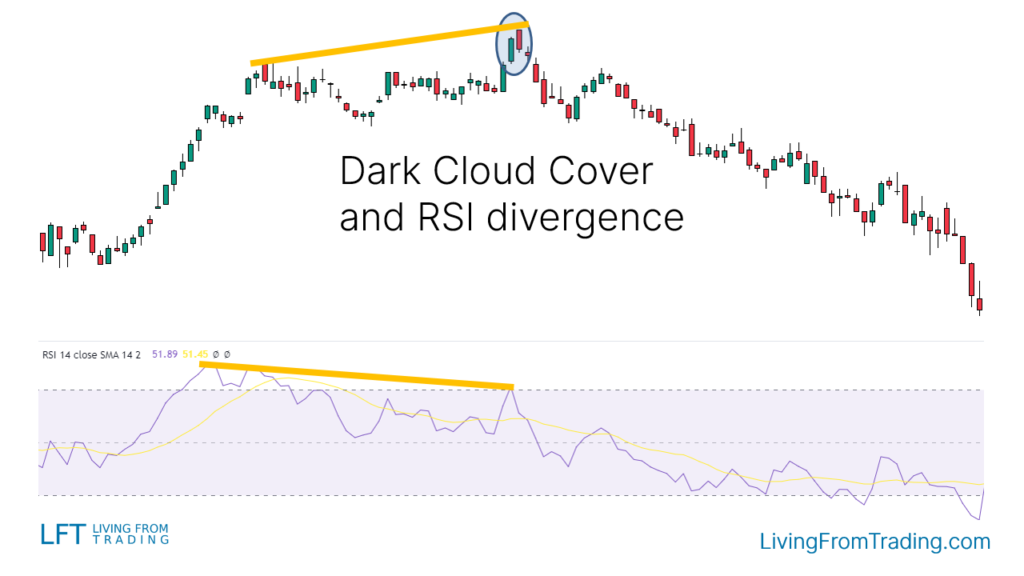
Strategy 4: Combining with RSI Divergences
- Description: RSI divergences indicate potential reversals when price makes new highs but RSI does not.
- Implementation: In an uptrend, identify price highs and compare with RSI. Look for bearish divergence and "Dark Cloud Cover" at higher price highs. Short when the price breaks below the pattern's low, set stop-loss at the pattern's high, and target the next support level.
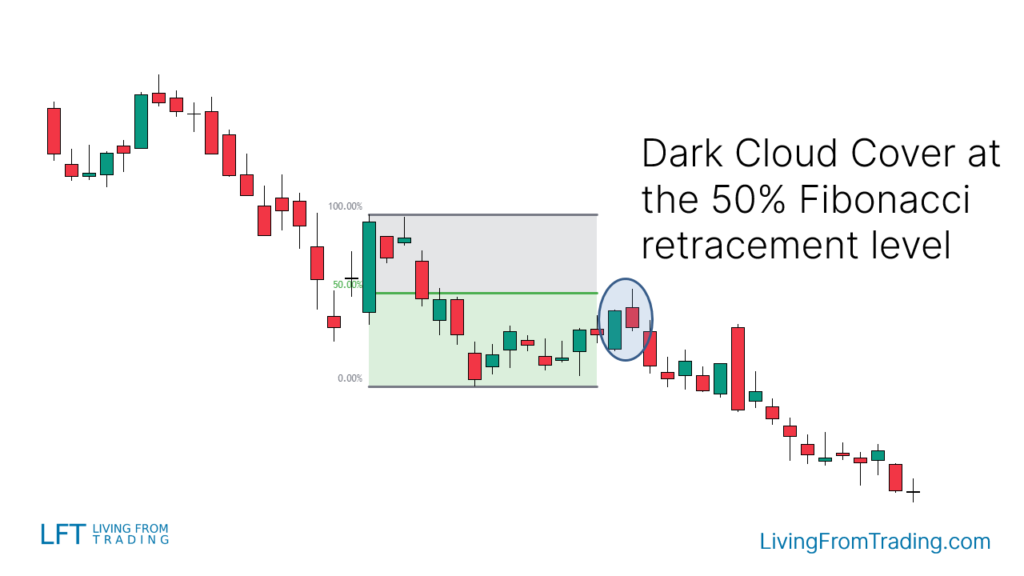
Strategy 5: Combining with Fibonacci Retracement
- Description: Fibonacci levels identify potential reversal zones where the price may reverse.
- Implementation: In a downtrend, wait for a price move up to a Fibonacci level with the "Dark Cloud Cover." Short when the price breaks below the pattern's low, set stop-loss at the pattern's high, and target the next support level.
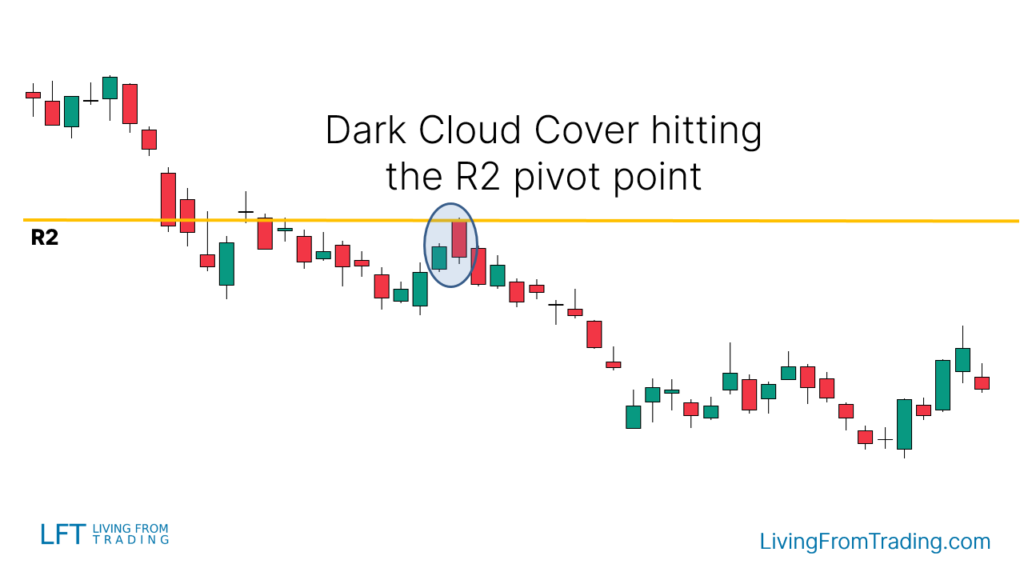
Strategy 6: Combining with Pivot Points
- Description: Pivot points are automatic support and resistance levels calculated using mathematical formulas.
- Implementation: Use pivot points to identify resistance levels. Short when the price moves up to these levels and forms "Dark Cloud Cover," breaking below the pattern's low. Set stop-loss at the pattern's high and target the next support level.
Summary
The "Dark Cloud Cover" is an effective bearish reversal pattern suitable for various trading strategies. By combining technical indicators with the pattern itself, traders can enhance accuracy. Understanding its definition, identification, and trading strategies will aid investors in making more precise market decisions.
Disclaimer: The views in this article are from the original Creator and do not represent the views or position of Hawk Insight. The content of the article is for reference, communication and learning only, and does not constitute investment advice. If it involves copyright issues, please contact us for deletion.