Falling Three Methods Candlestick Pattern - What Is And How To Trade
Learn all about the Falling Three Methods candlestick pattern.What is, how to trade, and all the best trading strategies.

The "Falling Three Methods" is a classic Japanese candlestick pattern used to identify potential continuation of a market downtrend. This article provides a detailed introduction to the definition, identification methods, and trading strategies for the "Falling Three Methods" candlestick pattern, ensuring a presentation with financial professionalism and logical rigor.
What is the "Falling Three Methods" Candlestick Pattern
The "Falling Three Methods" is a bearish continuation pattern that typically appears after a price decline, indicating market rejection of higher prices. This pattern signifies a brief pause during a downtrend and suggests that the price will continue to fall. It is the mirror image of the "Rising Three Methods" pattern.
How to Identify the "Falling Three Methods" Candlestick Pattern
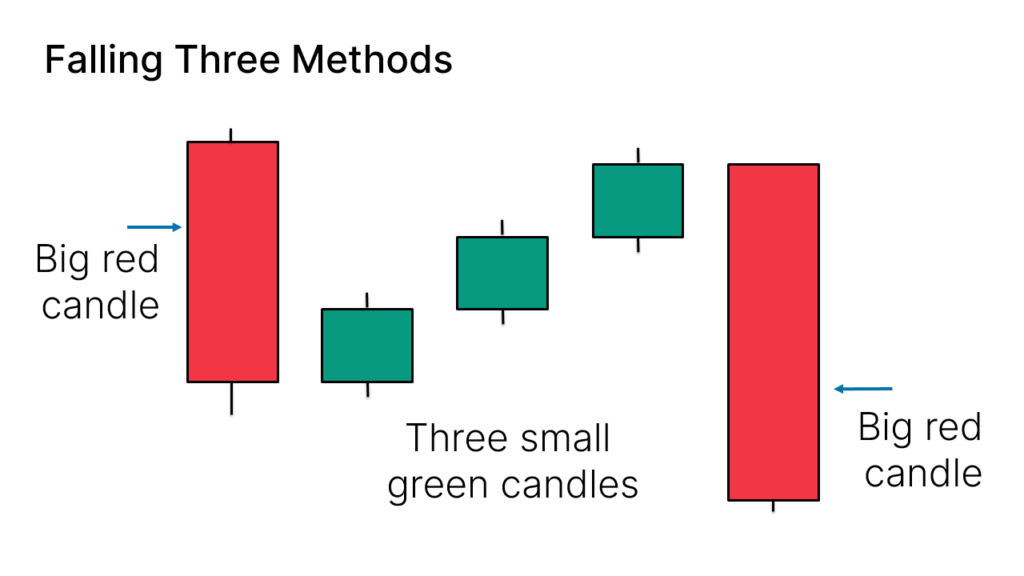
The "Falling Three Methods" candlestick pattern consists of five candles:
- First Candle: A long red (bearish) candle.
- Next Three Candles: Three small green (bullish) candles, with their highs lower than the high of the first red candle.
- Final Candle: A long red (bearish) candle closing below the close of all preceding candles.
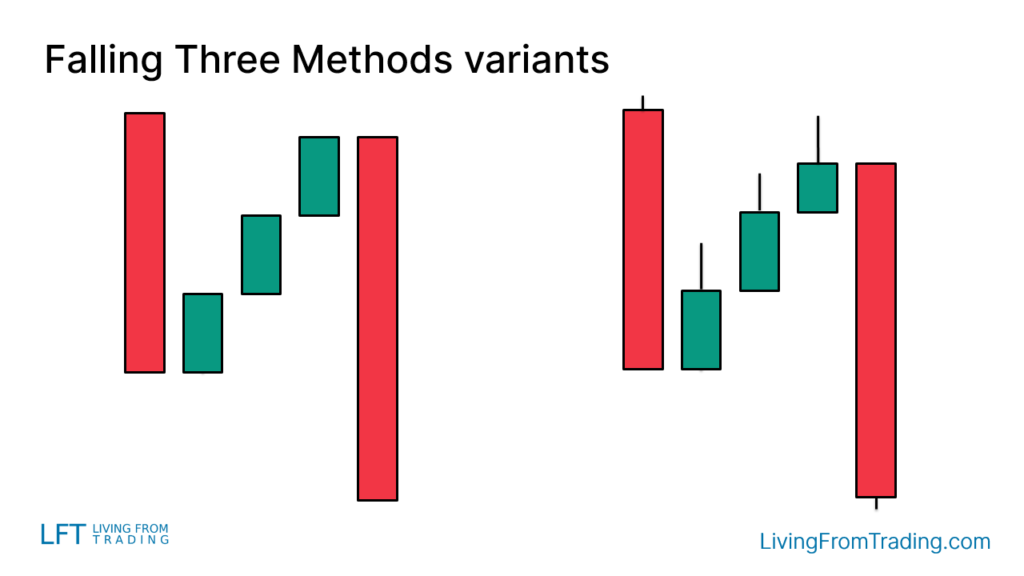
Variants of the "Falling Three Methods" Candlestick Pattern
The "Falling Three Methods" pattern may appear differently on actual charts:
- Red Candles: May have short lower shadows.
- Green Candles: If they have shadows, ideally, these should be at the top of the candles.
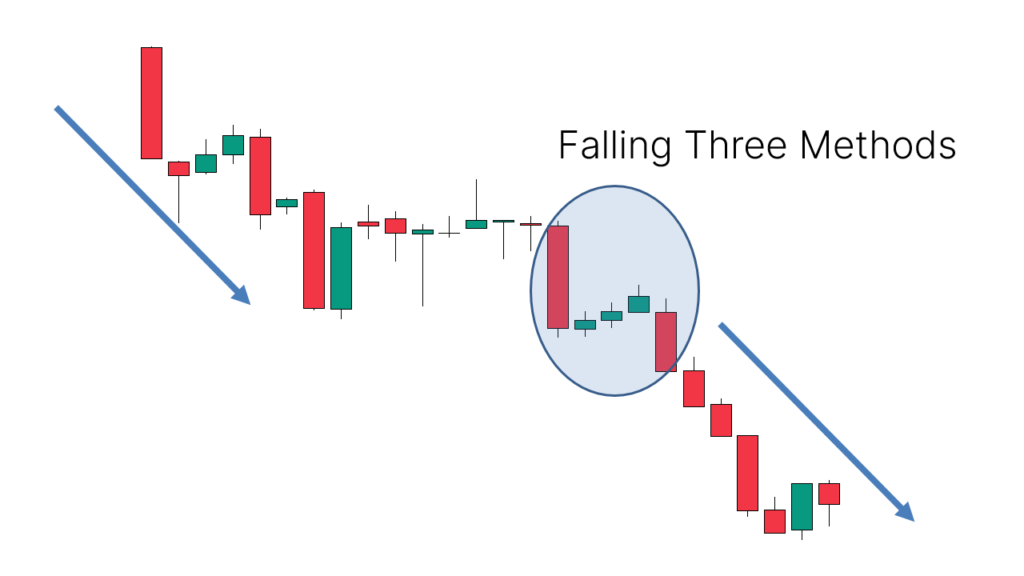
How to Trade
To effectively trade the "Falling Three Methods" pattern, it is essential to consider not only the pattern itself but also the location where it appears:
- Confirm Downtrend: Ensure that there is a downtrend before the pattern appears.
- Trading Trigger: Initiate a short position when the low of the last candle is broken.
- Stop Loss: Set the stop loss on the opposite side of the pattern to protect against market reversals.
Trading Strategies
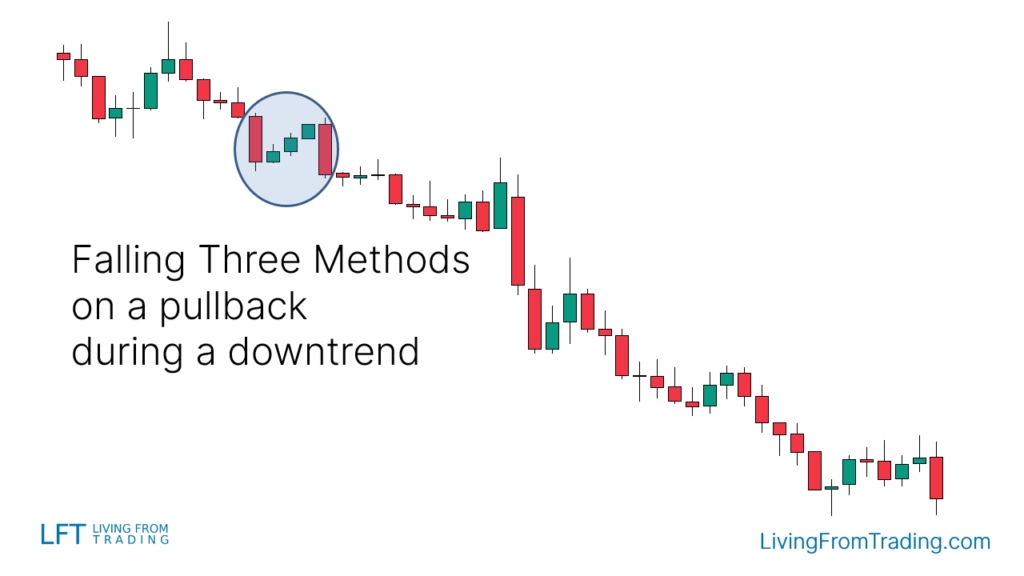
Strategy 1: Pullbacks on Naked Charts
Observe the price pullback in a clear downtrend. When a pullback ends and the "Falling Three Methods" pattern appears, it typically signals the start of a new downward leg.
Steps:
- Identify Downtrend: Confirm that the market is in a downtrend, preferably using longer time frames.
- Wait for Pullback: Price will naturally pull back or rebound during a downtrend.
- Confirm Pattern: Ensure the "Falling Three Methods" pattern is complete, consisting of five candles.
- Entry Point: Enter a short position when the low of the last red candle is broken.
- Set Stop Loss: Place a stop loss above the high of the last red candle to mitigate the risk of price reversal.
- Set Target: Define target prices based on historical support levels or trendlines.
Suppose a stock is in a downtrend and undergoes a pullback. When a "Falling Three Methods" pattern forms during this pullback, a trader short-sells at the low of the last red candle and sets the target at a previous support level.
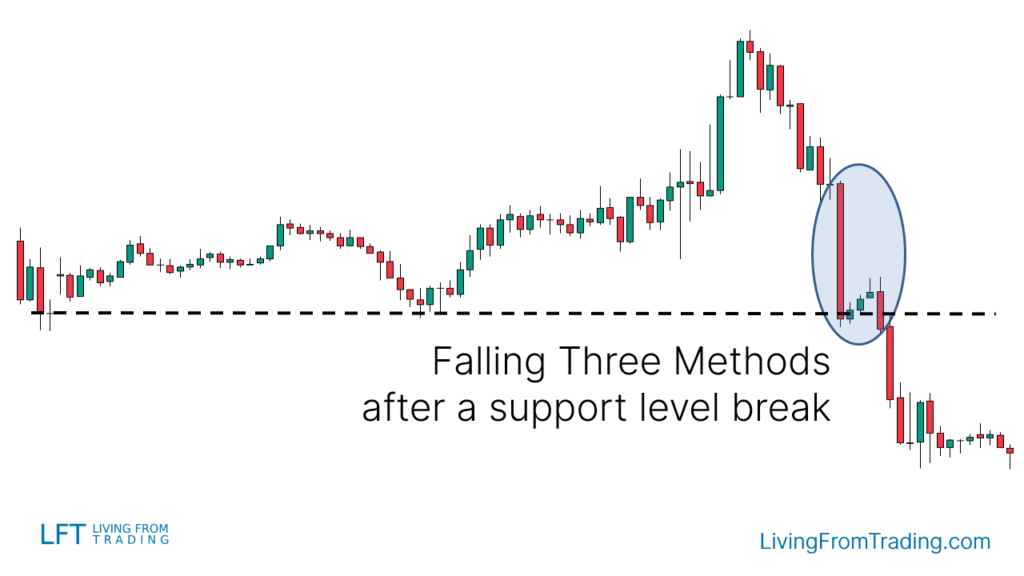
Strategy 2: Trading with Support Levels
Use support and resistance levels for trading. When the price breaks and retests a support level and a "Falling Three Methods" pattern appears, it indicates potential further declines.
Steps:
- Draw Support Levels: Mark key support levels on the chart.
- Price Breakthrough: Watch for the price to move down, break a support level, and then retest it.
- Confirm Pattern: Ensure the "Falling Three Methods" pattern appears during the retest.
- Entry Point: Short when the price breaks the low of the last red candle of the pattern.
- Set Stop Loss: Place the stop loss above the broken support level to cover potential price reversals.
- Set Target: Establish target prices below the next support level or adjust based on market trends.
A stock breaks a significant support level and then retests it. If a "Falling Three Methods" pattern forms at this retest, the trader short-sells at the low of the last red candle and targets the next support level.
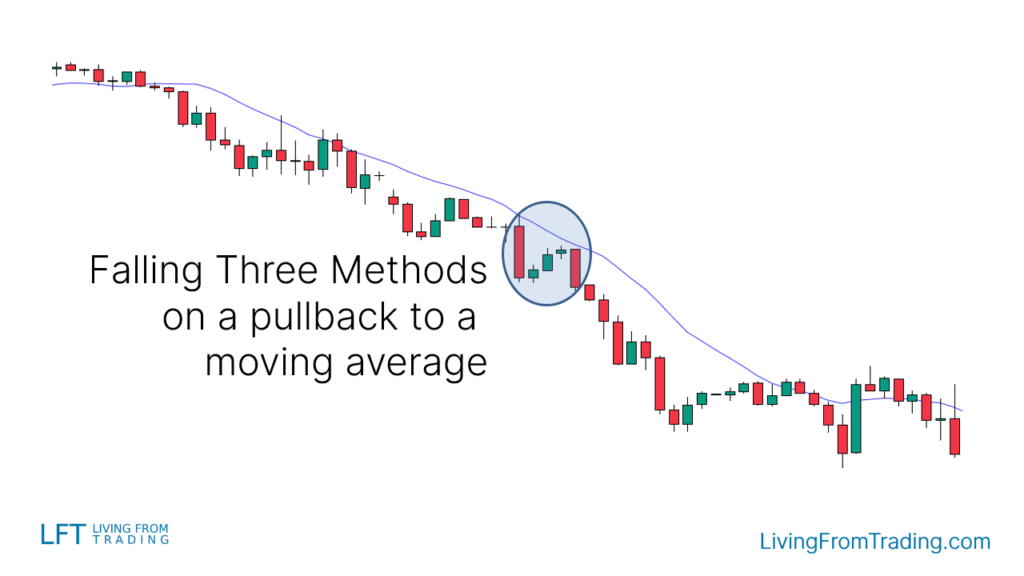
Strategy 3: Trading with Moving Averages
Utilize moving averages to trade trends. Trade pullbacks to the moving average when the price is in a downtrend.
Steps:
- Identify Downtrend: Use moving averages (e.g., 50-day or 200-day) to confirm a downtrend.
- Wait for Pullback: Observe if the price moves up and touches the moving average.
- Confirm Pattern: Check if a "Falling Three Methods" pattern forms near the moving average.
- Entry Point: Short when the price breaks the low of the last red candle of the pattern.
- Set Stop Loss: Place the stop loss above the moving average to guard against price rebounds.
- Set Target: Define target prices below the moving average or adjust based on market conditions.
A stock in a downtrend moves up to the 50-day moving average and forms a "Falling Three Methods" pattern. The trader short-sells at the low of the last red candle and sets the stop loss above the moving average.
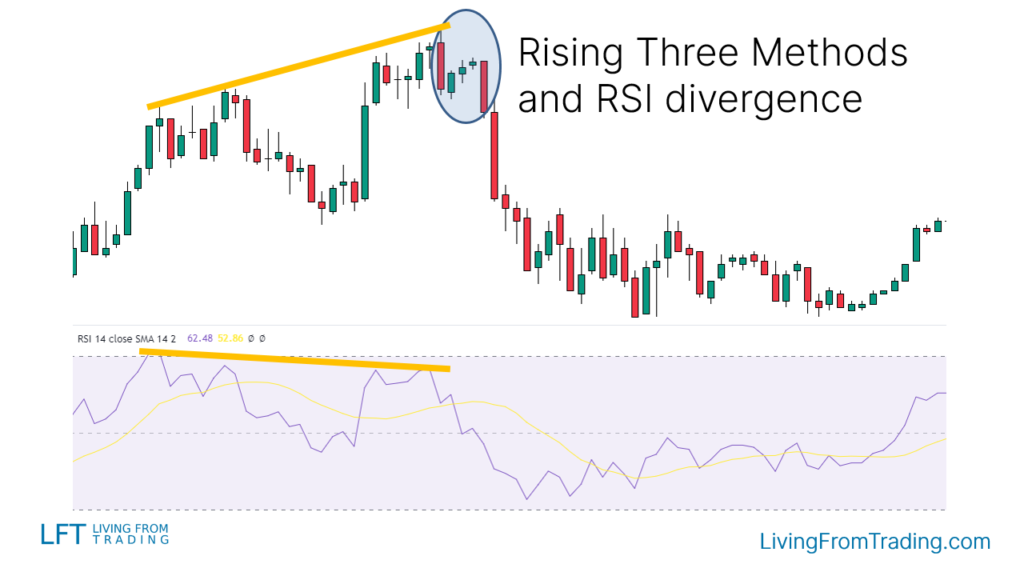
Strategy 4: Trading with RSI Divergences
Use RSI divergences to trade. When the price makes new highs but the RSI shows a divergence, combine this with a "Falling Three Methods" pattern for shorting opportunities.
Steps:
- Identify Uptrend: Determine the market is in an uptrend, marking the highs.
- Monitor RSI: Compare price highs with RSI to identify divergences.
- Confirm Pattern: Look for a "Falling Three Methods" pattern at a new high where RSI shows lower highs.
- Entry Point: Short when the price breaks the low of the last red candle of the pattern.
- Set Stop Loss: Place the stop loss above the high of the "Falling Three Methods" pattern.
- Set Target: Establish target prices based on RSI divergence and market support levels.
A stock reaches new highs while the RSI shows a divergence, and a "Falling Three Methods" pattern forms. The trader short-sells at the low of the last red candle and targets based on RSI divergence.
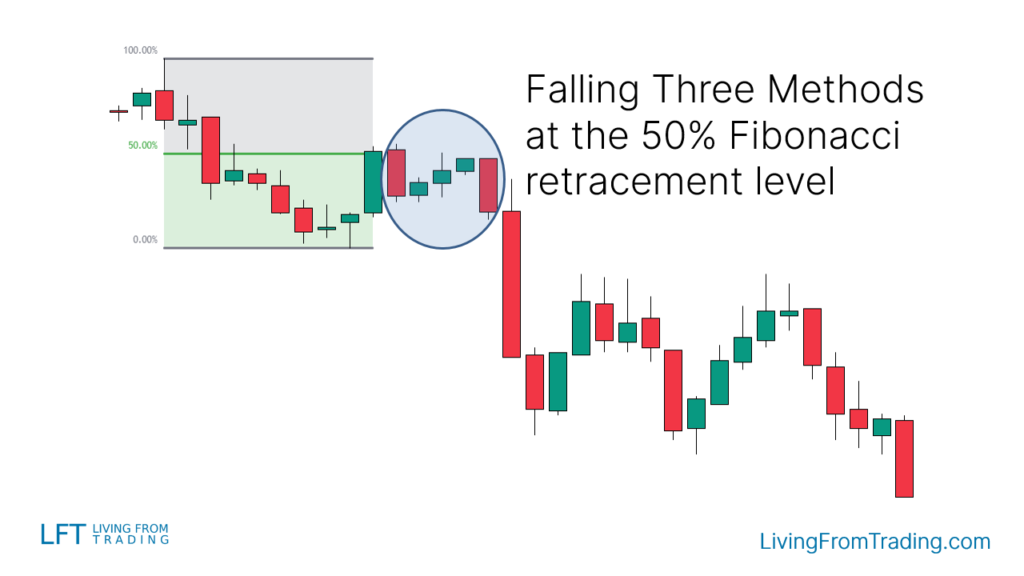
Strategy 5: Trading with Fibonacci Retracement
Use Fibonacci retracement levels to trade. When the price retraces to a Fibonacci level and forms a "Falling Three Methods" pattern, it’s a signal to short.
Steps:
- Identify Downtrend: Confirm a downtrend and apply the Fibonacci tool from the recent high to low.
- Draw Fibonacci Levels: Plot Fibonacci retracement levels on the chart.
- Observe Retracement: Wait for the price to move up to a Fibonacci level.
- Confirm Pattern: Check for the "Falling Three Methods" pattern at the Fibonacci level.
- Entry Point: Short when the price breaks the low of the last red candle.
- Set Stop Loss: Place the stop loss above the Fibonacci level to manage risk.
- Set Target: Define target prices below the Fibonacci level or based on trend strength.
A stock retraces to the 61.8% Fibonacci level during a downtrend and forms a "Falling Three Methods" pattern. The trader short-sells at the low of the last red candle and sets the stop loss above the Fibonacci level.
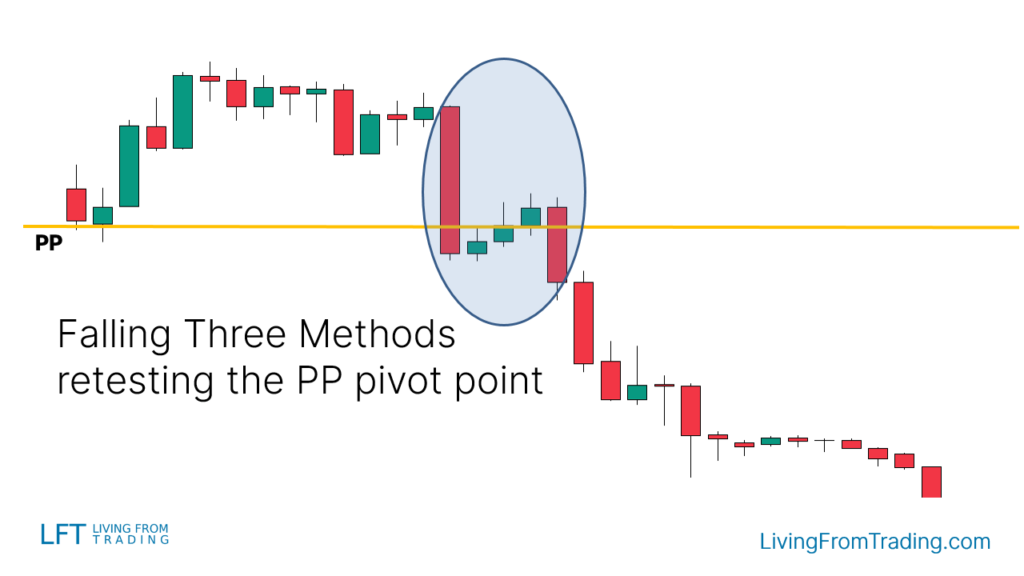
Strategy 6: Trading with Pivot Points
Use Pivot Points as automatic support and resistance levels. When the price hits a Pivot Point level and forms a "Falling Three Methods" pattern, it indicates a selling opportunity.
Steps:
- Apply Pivot Points Indicator: Activate Pivot Points on the chart.
- Identify Pivot Levels: Determine which Pivot Points are below the price, as these may act as resistance.
- Observe Price Movement: Wait for the price to move to a Pivot Point level and break through it.
- Confirm Pattern: Look for the "Falling Three Methods" pattern at the broken Pivot Point level.
- Entry Point: Short when the price breaks the low of the last red candle.
- Set Stop Loss: Place the stop loss above the Pivot Point level to cover potential reversals.
- Set Target: Set target prices below the next Pivot Point level or adjust based on market conditions.
A stock touches a daily Pivot Point level and forms a "Falling Three Methods" pattern. The trader short-sells at the low of the last red candle and targets the next Pivot Point level.
Summary
The "Falling Three Methods" candlestick pattern is a bearish continuation model, indicating that the price may continue to decline during a downtrend. Combining this pattern with other technical indicators, such as support levels, moving averages, RSI divergences, Fibonacci retracements, and Pivot Points, can enhance trading accuracy. The success rate of this pattern is 71%, making it an effective tool for traders to consider.
Disclaimer: The views in this article are from the original Creator and do not represent the views or position of Hawk Insight. The content of the article is for reference, communication and learning only, and does not constitute investment advice. If it involves copyright issues, please contact us for deletion.

![[2023 Forecast] Southern Copper Stock](https://hawk-oss.hawkinsight.com/hawk/image/20231128/图片1_2391029672_944.png?w=3840&q=100)