Fibonacci Trading - Full Guide and Strategies
Fibonacci magic levels are an effective way of trading.Learn all you need to know to use the Fibonacci extensions and retracements.

What is Fibonacci Trading?
Fibonacci trading is a strategy based on the Fibonacci sequence introduced by mathematician Leonardo Fibonacci. Market prices often exhibit cyclical and patterned behavior during fluctuations. Fibonacci trading leverages these patterns by calculating key Fibonacci retracement and extension levels to predict potential price reversal points and future target prices. This method helps traders identify potential trading opportunities and risk management points in complex market environments.
Fibonacci Sequence and Key Levels
The Fibonacci sequence is a mathematical series introduced by Leonardo Fibonacci in the 13th century, where each number is the sum of the two preceding numbers. The sequence starts with 0 and 1, followed by 1, 2, 3, 5, 8, 13, 21, 34, 55, 89, 144, and so on. The characteristics of the Fibonacci sequence manifest in financial markets as specific retracement and extension ratios, commonly used to forecast key points in market fluctuations.
Major Fibonacci Levels Include:
- 23.6%: This level is derived by dividing a number in the sequence by the number two places before it, used to identify smaller retracements.
- 38.2%: Calculated by dividing a number in the sequence by the number three places before it, used to identify deeper retracements.
- 50%: While not a number in the Fibonacci sequence, it is commonly used as a retracement level in trading.
- 61.8%: One of the most important levels, derived by dividing a number in the sequence by the next number, used to identify significant retracement levels.
- 78.6%: This level is the square root of 61.8%, often used for deeper retracement predictions.
Fibonacci Retracements and Extensions
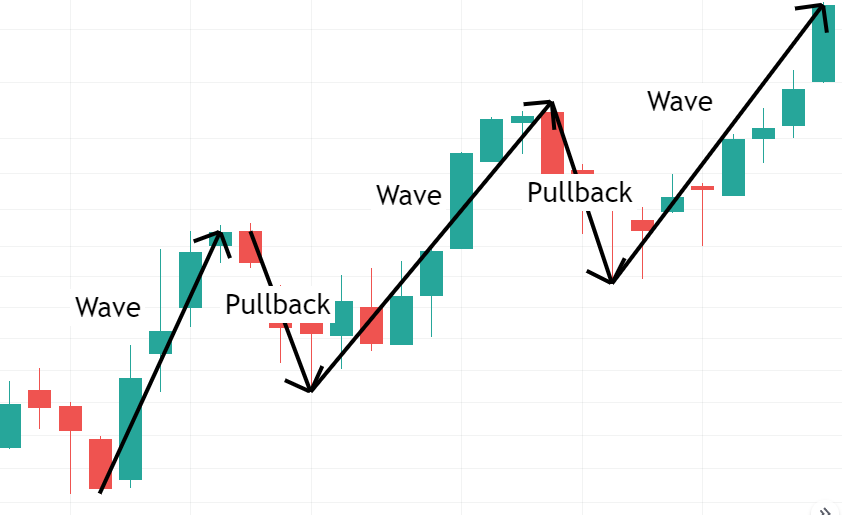
- Fibonacci Retracement: Measures the depth of a price pullback from a previous high or low. Retracement depths are expressed in Fibonacci percentages, with common levels including 23.6%, 38.2%, 50%, 61.8%, and 78.6%. For example, a 50% retracement indicates that the price has pulled back 50% from a previous uptrend.
- Fibonacci Extension:Measures the extent of a new wave relative to a previous wave. Extension levels are also expressed as percentages, such as a 100% extension level indicating that the new wave's magnitude is the same as the previous wave. Common extension levels include 61.8%, 100%, and 161.8%.
How to Draw Fibonacci Levels
Drawing Fibonacci Retracements:
-
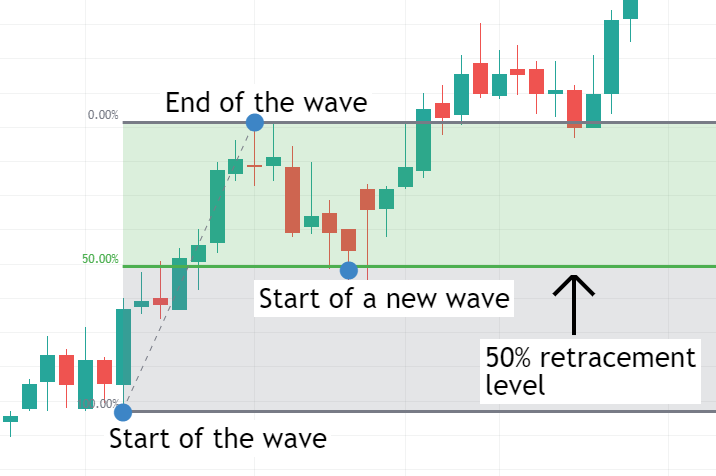
Identify Start and End Points:
- In an uptrend, the start point is the lowest point of the trend, and the end point is the highest point.
- In a downtrend, the start point is the highest point, and the end point is the lowest point.
-
Select Fibonacci Tool:
- In charting software, locate the Fibonacci retracement tool (usually found in drawing tools or technical indicators).
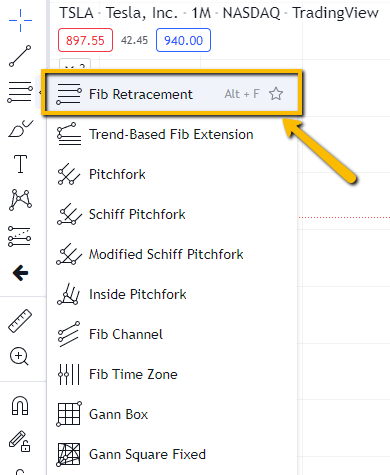
- In charting software, locate the Fibonacci retracement tool (usually found in drawing tools or technical indicators).
-
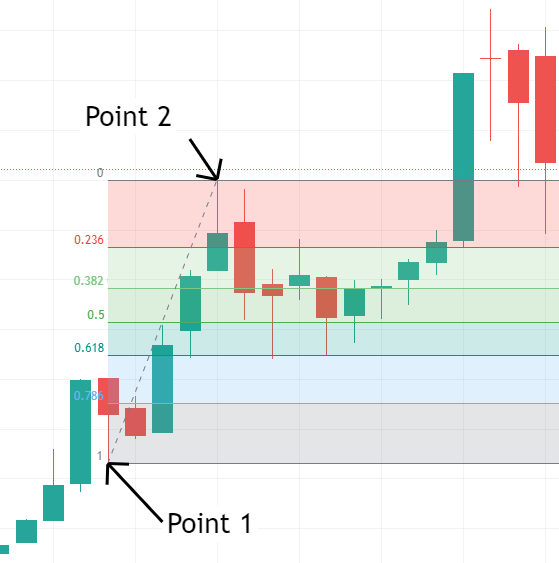
Apply the Tool:
- On the chart, drag the tool from the start point to the end point. For an uptrend, drag from the low to the high; for a downtrend, drag from the high to the low.
- On the chart, drag the tool from the start point to the end point. For an uptrend, drag from the low to the high; for a downtrend, drag from the high to the low.
-
View Retracement Levels:
- The chart will automatically display various Fibonacci retracement levels such as 23.6%, 38.2%, 50%, 61.8%, and 78.6%.
Drawing Fibonacci Extensions:
-
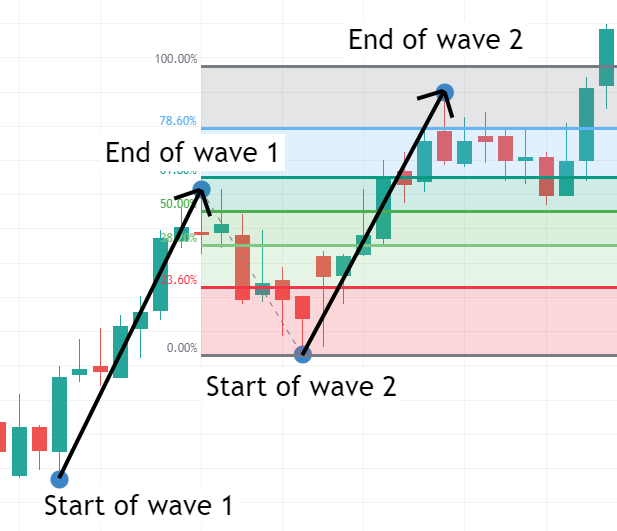
Select Start, End, and Retracement End Points:
- In an uptrend, the start point is the lowest point, the end point is the highest point, and the retracement end point is the lowest point of the price pullback.
- In a downtrend, the start point is the highest point, the end point is the lowest point, and the retracement end point is the highest point of the price pullback.
-
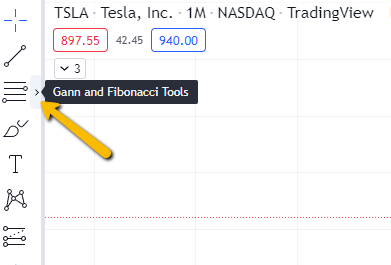
Select Fibonacci Extension Tool:
- In charting software, locate the Fibonacci extension tool.
_59228491_861.png)
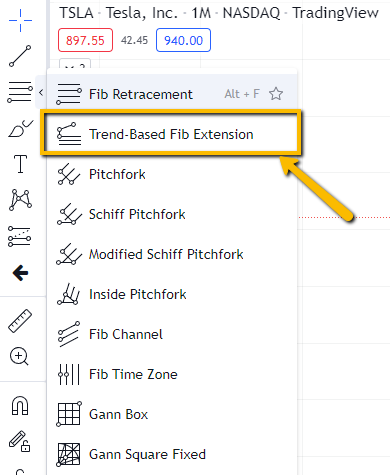
- In charting software, locate the Fibonacci extension tool.
-
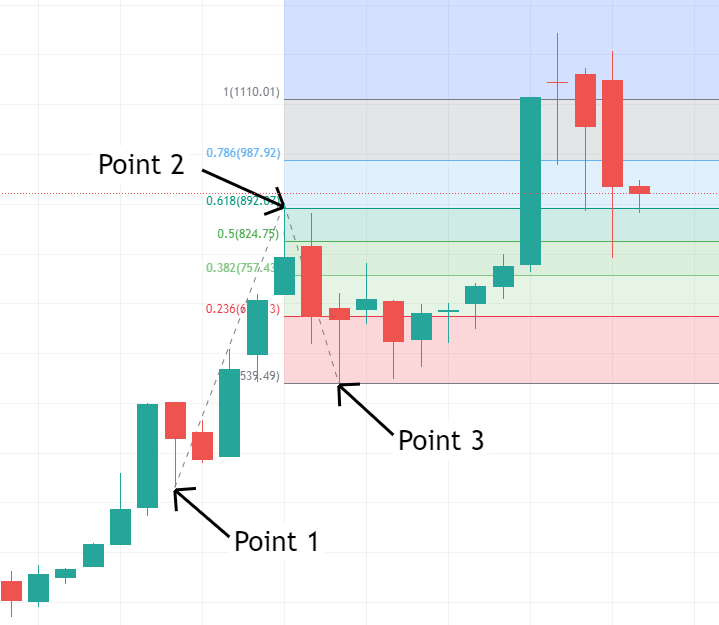
Apply the Tool:
- On the chart, drag the tool from the start point to the end point, then drag to the retracement end point. For an uptrend, drag from the low to the high, then to the low of the pullback; for a downtrend, drag from the high to the low, then to the high of the pullback.
- On the chart, drag the tool from the start point to the end point, then drag to the retracement end point. For an uptrend, drag from the low to the high, then to the low of the pullback; for a downtrend, drag from the high to the low, then to the high of the pullback.
-
View Extension Levels:
- The chart will automatically display various Fibonacci extension levels such as 61.8%, 100%, and 161.8%.
Fibonacci Trading Strategy
1.Draw Fibonacci Retracement Levels:
Identify market pullback phases. When prices begin to pull back, draw Fibonacci retracement levels. Avoid chasing prices during rapid upswings or downswings; patiently wait for the price to pull back into key areas.
2.Analyze Market Conditions:
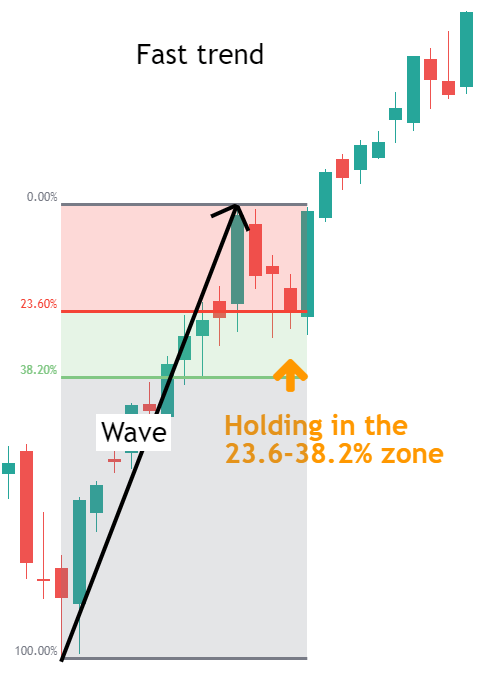
Fast Trends: In rapid upswings or downswings, retracements often occur in the 23.6% to 38.2% range. These retracements are usually brief, with the market likely to quickly resume its original trend.
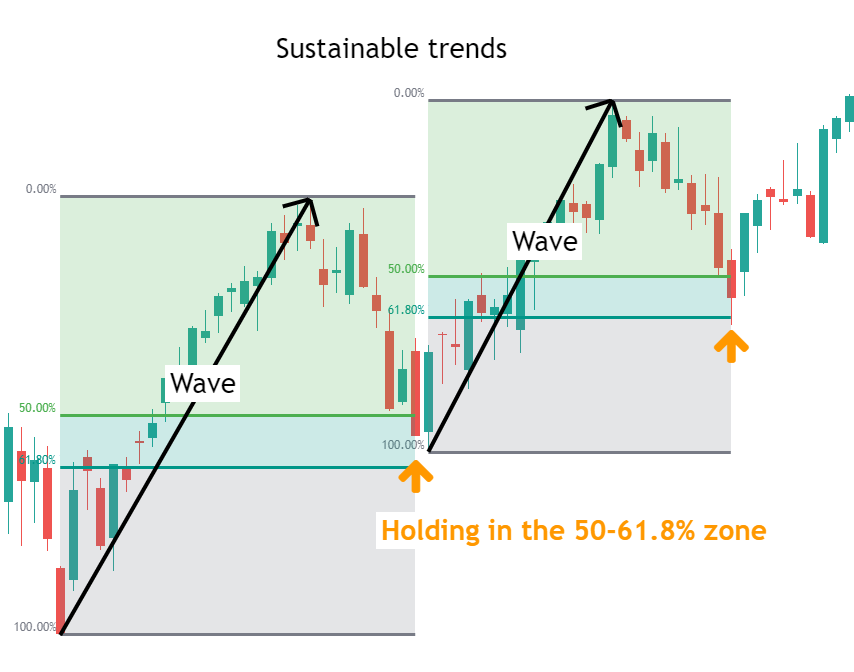
Stable Trends: In stable market trends, retracements often reach the 50% to 61.8% range. These retracements are typically deeper and occur multiple times, providing ideal trading opportunities.
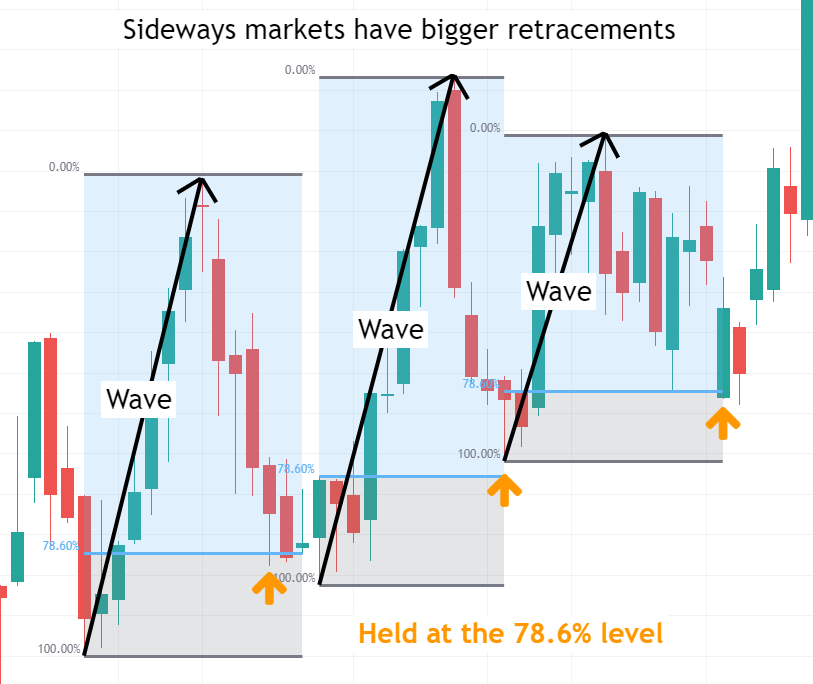
Consolidation: In a consolidating market, retracements might be deeper, with the 78.6% level often performing well. When the market breaks out of consolidation and resumes the trend, smaller retracement levels may be more effective.
3.Entry Strategies:
Aggressive Entry: Open positions immediately when the price enters the designated Fibonacci area. Set stop-loss orders on the opposite side of this area to protect against adverse movements.
Conservative Entry: Wait for a reversal signal in the Fibonacci area, such as price action patterns (e.g., pin bars or engulfing patterns). Set stop-loss orders on the other side of the pattern to prevent signal failure.
4.Set Targets:
Using Fibonacci Extensions: In fast and stable trends, target areas around 80%-100% of the extension levels. In consolidating markets, smaller extension levels (e.g., 50%) are usually more effective.
Risk/Reward Ratio: Ensure the risk/reward ratio of the trade is at least 1:1, ideally greater than 2:1.
Support and Resistance: Use prominent support and resistance levels as targets, as prices often stall at these levels.
Summary
The Fibonacci trading methodology helps traders to identify potential trading opportunities in market volatility by applying the retracement and extension levels of the Fibonacci series, which is useful when developing trading strategies, predicting price reversals and setting targets.
By accurately analysing market conditions and applying the Fibonacci levels appropriately, traders are able to increase the accuracy and success of their trading decisions.
Disclaimer: The views in this article are from the original Creator and do not represent the views or position of Hawk Insight. The content of the article is for reference, communication and learning only, and does not constitute investment advice. If it involves copyright issues, please contact us for deletion.


