Hanging Man Candlestick Pattern - What Is And How To Trade
Learn all about the Hanging Man candlestick pattern.What is, how to trade, and all the best trading strategies.
The "Hanging Man" candlestick pattern is a significant bearish reversal signal in technical analysis. This article will detail the definition, identification methods, variants, and multiple trading strategies of the "Hanging Man" candlestick pattern, along with an analysis of its success rate, to assist investors in effectively using this tool for trading decisions.
What is the Hanging Man Candlestick Pattern?
The Hanging Man is a Japanese candlestick pattern primarily used to indicate a potential reversal from an uptrend to a downtrend. It typically appears after a period of upward price movement, signaling a weakening of bullish momentum and rejection of higher prices.
Similar in appearance to the Shooting Star candlestick, it is considered a reversal signal but appears under different market conditions.
How to Identify the Hanging Man Candlestick Pattern?
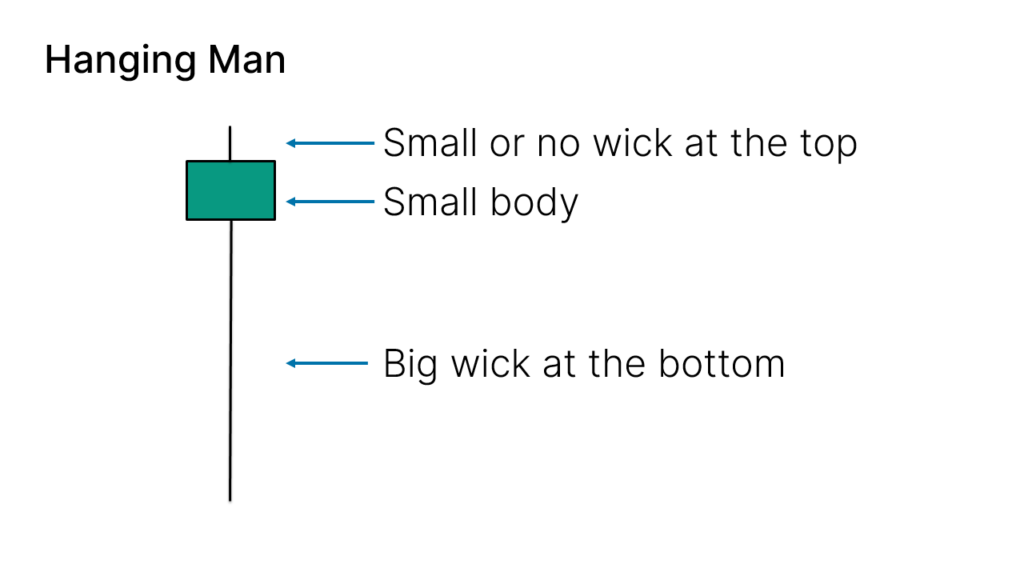
When identifying the Hanging Man candlestick pattern, consider the following characteristics:
- Small Candle Body: The candle has a small body, indicating a narrow price range between open and close.
- Long Lower Shadow: The lower shadow is significantly longer than the body, often twice the length.
- Short or No Upper Shadow: The upper shadow is very short or non-existent, suggesting failure to breach higher than the opening price.
- Color Irrelevant: The color of the candle body (whether red or green) does not affect the identification of the Hanging Man, though a red body often signifies a stronger bearish signal.
Variants of the Hanging Man Candlestick Pattern
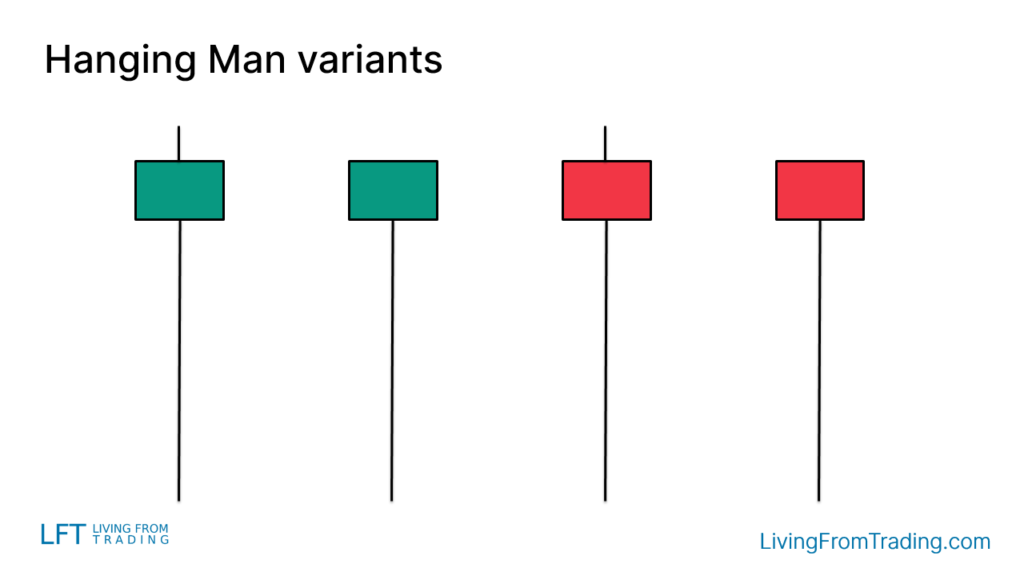
The Hanging Man candlestick pattern may vary in appearance on different charts:
- Candle Body Color: The color of the candle body (red or green) does not impact the effectiveness of the Hanging Man pattern.
- Length of Lower Shadow: While ideally the lower shadow should be longer than the body, in practice, a shorter lower shadow can still qualify as a Hanging Man as long as it exists.
Trading Strategy
Trading the Hanging Man candlestick pattern requires more than identifying its shape on a chart. Here are several commonly used trading strategies to enhance accuracy and success:
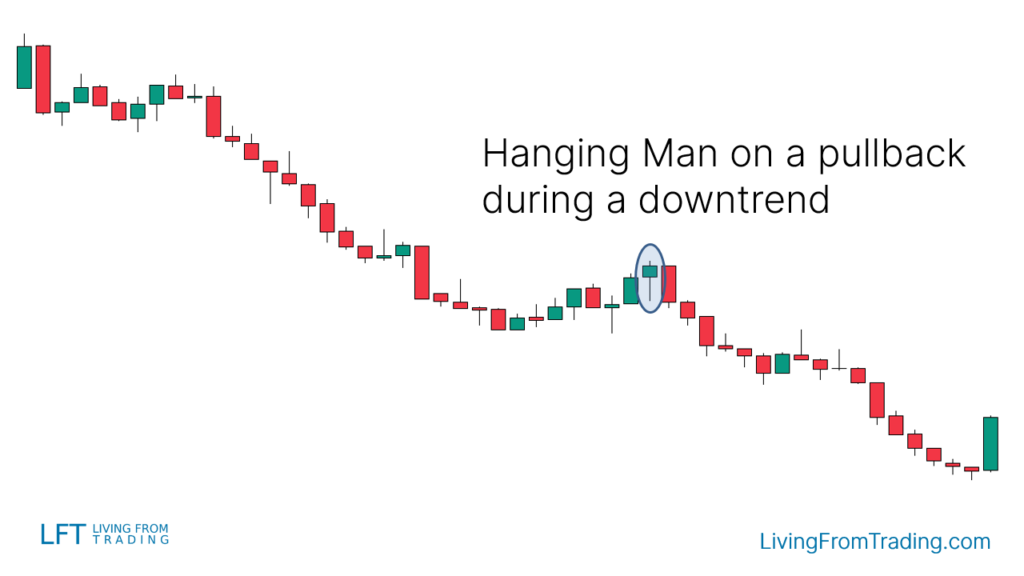
1.Pullback Strategy on Naked Charts
Concept: In a downtrending market, wait for a price pullback and identify the Hanging Man pattern, signaling the end of the pullback and a potential downtrend continuation.
Steps:
- Wait for a price pullback and the appearance of the Hanging Man pattern.
- Confirm the end of the pullback and consider opening a short position.
- Set stop-loss above the Hanging Man and target profits in the downward target area.
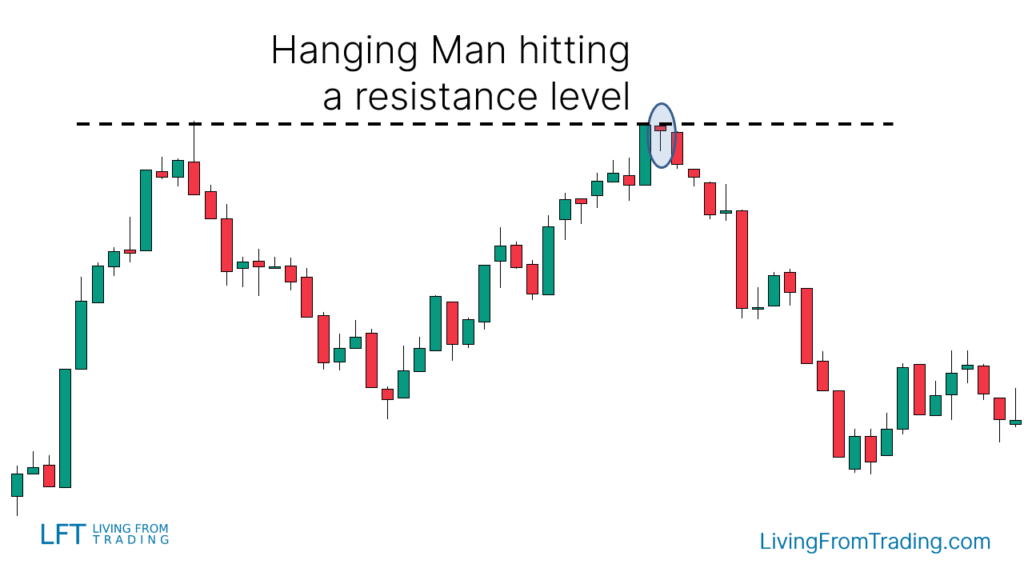
2.Strategy Using Resistance Levels
Concept: Support and resistance levels are areas where price reversals are likely. When price approaches a resistance level and forms a Hanging Man pattern, it signals a potential downside move.
Steps:
- Mark resistance levels on your charts.
- Wait for price to rise and reach the resistance level, observing the formation of a Hanging Man pattern.
- Short when price breaks the low of the Hanging Man.
- Set stop-loss above the resistance level and target profits in the downward target area.
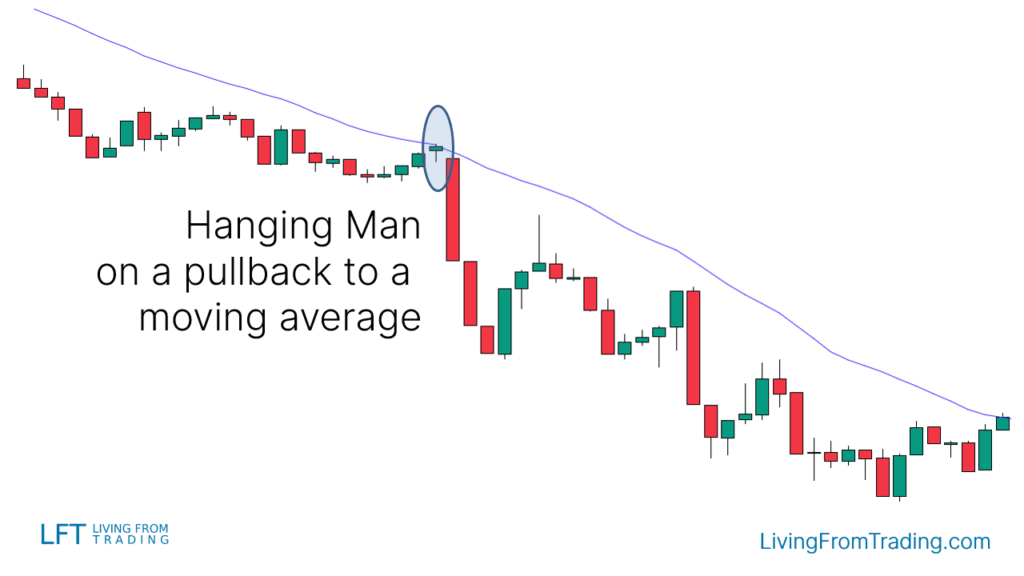
3.Trading with Moving Averages
Concept: Moving averages help identify market trends. When price is in a downtrend and retraces to a moving average, the appearance of a Hanging Man pattern often signals a potential continuation of the downtrend.
Steps:
- Confirm a downtrend in the market.
- Wait for price to rise and touch the moving average, observing the formation of a Hanging Man pattern.
- Short when price breaks the low of the Hanging Man.
- Set stop-loss above the moving average and target profits in the downward target area.
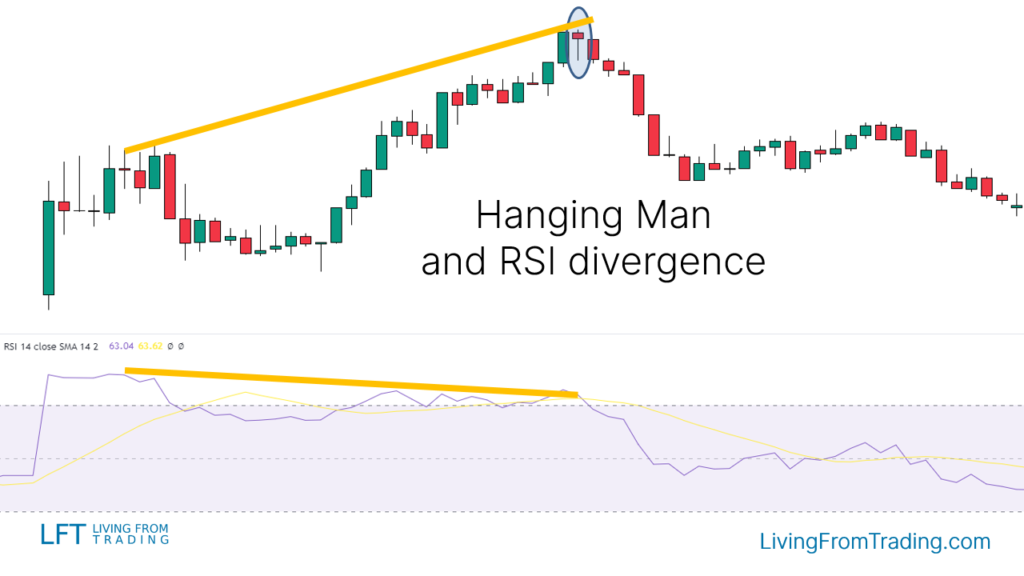
4.RSI Divergence Strategy
Concept: RSI divergence signals potential market reversals. When price is in an uptrend and RSI fails to make higher highs, while price continues higher, it suggests a bearish divergence.
Steps:
- Confirm an uptrend in price, marking each high point.
- Simultaneously monitor the RSI indicator, looking for lower highs compared to price highs.
- When a Hanging Man forms at a price high aligned with RSI divergence, open a short position.
- Set stop-loss above the Hanging Man and target profits in the downward target area.
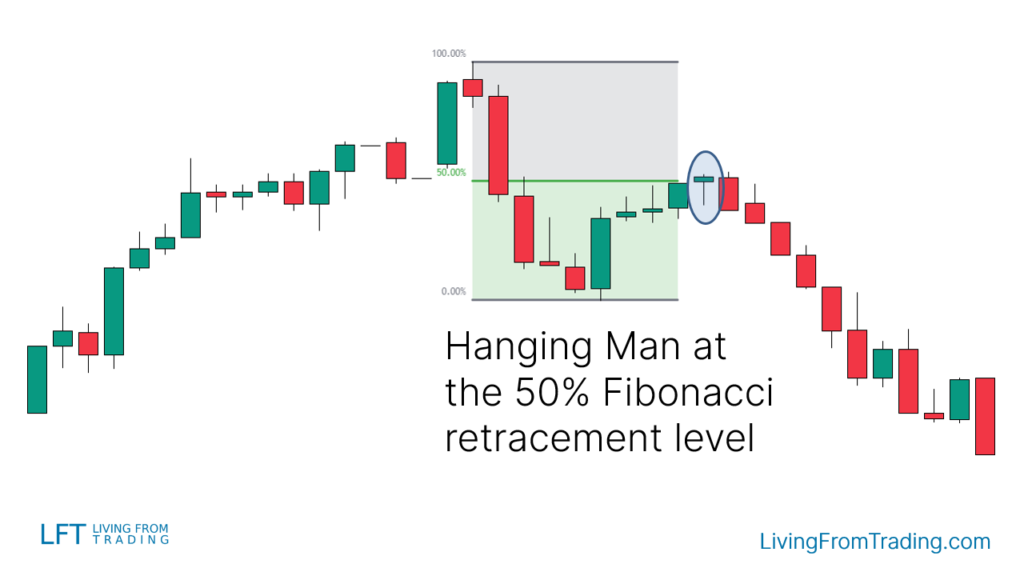
5.Fibonacci Retracement Strategy
Concept: Fibonacci retracement levels identify potential price reversal areas. When price retraces to a Fibonacci level and forms a Hanging Man pattern, it signals a potential reversal.
Steps:
- Identify Fibonacci retracement levels in a downtrend.
- Wait for price to bounce and touch a Fibonacci retracement level, observing the formation of a Hanging Man pattern.
- Short when price breaks the low of the Hanging Man.
- Set stop-loss above the Fibonacci retracement level and target profits in the downward target area.
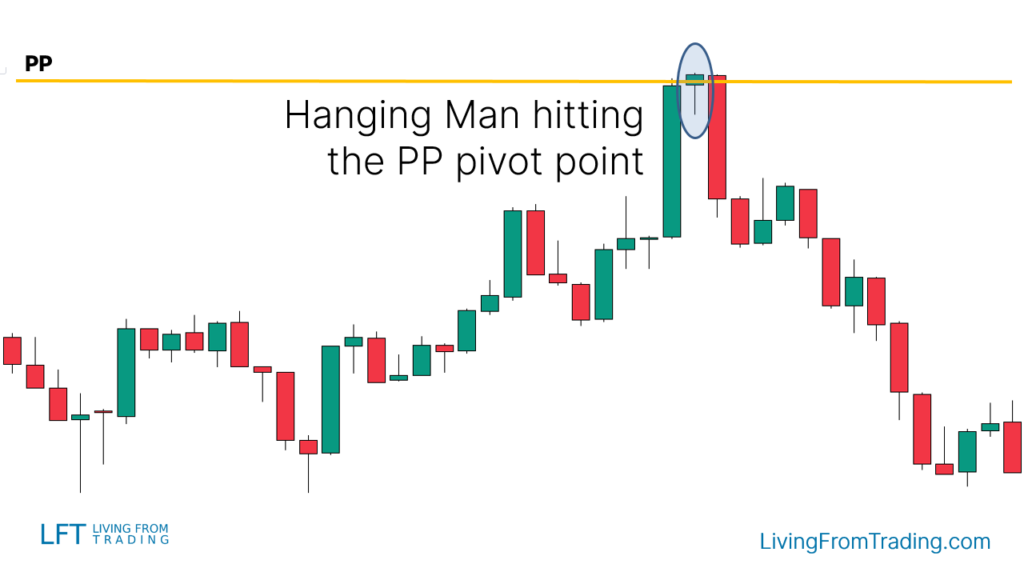
6.Pivot Points Strategy
Concept: Pivot Points are automatic support and resistance levels. When price approaches a Pivot Point resistance level and forms a Hanging Man pattern, it signals a potential downside move.
Steps:
- Activate Pivot Points indicator and mark support and resistance levels on your charts.
- Wait for price to rise and reach a Pivot Point resistance level, observing the formation of a Hanging Man pattern.
- Short when price breaks the low of the Hanging Man.
- Set stop-loss above the Pivot Point resistance level and target profits in the downward target area.
Conclusion
The Hanging Man candlestick pattern is a crucial bearish reversal signal in technical analysis, suitable for identifying potential downtrends in market prices. By integrating pullbacks, resistance levels, moving averages, RSI divergence, Fibonacci retracement, and Pivot Points, among other technical indicators, traders can enhance the effectiveness of their trading strategies using the Hanging Man candlestick pattern.
Disclaimer: The views in this article are from the original Creator and do not represent the views or position of Hawk Insight. The content of the article is for reference, communication and learning only, and does not constitute investment advice. If it involves copyright issues, please contact us for deletion.