Market Volatility Indicator: VIX Index
The VIX index symbolizes the intense emotions of investor panic and desire to flee during stock market volatility.
The market is always evolving, and investors often need a metric to quantify and evaluate market volatility in order to make informed decisions. This is precisely the question that the market volatility index, known as the VIX, aims to answer.
The VIX index is not only a key data point in the financial markets but also a mirror of investment sentiment, reflecting investors' emotions towards risk and uncertainty. In the stock market, as stock prices rise or fall, most investors undergo psychological changes characterized by "greed" and "panic".
What is the VIX?
The VIX, short for the Chicago Board Options Exchange Volatility Index, is a measure developed by the Chicago Board Options Exchange (CBOE) to gauge the magnitude of price fluctuations in S&P 500 index options.
The VIX is often referred to as the "fear index" or "market fear index" because it tends to rise during market instability and fall during stability.
What does the VIX imply?
The level of the VIX represents the sentiment of investors in the market. A higher VIX suggests that investors are more concerned about the current stock market, anticipating significant fluctuations in the near future. On the other hand, a lower VIX indicates that investors perceive the stock market to be relatively stable.
In stable market conditions, the VIX typically ranges between 10 and 20. When the index is below 20, it indicates relative market stability and optimism among investors. Conversely, when it exceeds 30, it suggests heightened market volatility and investor panic, often accompanied by significant stock market declines.
How is the VIX calculated?
Although the calculation of the VIX is relatively complex, its core idea is based on real-time prices of S&P 500 index options to estimate the expected market volatility.
The calculation of the VIX involves several steps:
- Select option contracts: The CBOE selects a range of near-term and longer-term S&P 500 index option contracts.
- Calculation of implied volatility: By analyzing the prices of these option contracts, the market's expectation of future volatility, known as implied volatility, can be derived.
- Weight allocation: The VIX uses a weighted average, where the prices of near-term options are given greater weight than those of longer-term options. The square of the implied volatility of options is used as the basis for calculation.
- Calculation of volatility: The VIX also considers the impact of the time remaining until option expiration on the calculation. The volatility of near-term options is weighted to reflect short-term market expectations.
- Presentation of results: The final result of the VIX is a percentage figure, representing investors' expected annualized volatility over the next 30 days.
Applications of the VIX
The VIX has wide-ranging applications in financial markets, including:
- Market sentiment indicator: The VIX is widely regarded as one of the key indicators of market sentiment. Investors can gauge market participants' expectations of future volatility and their overall outlook on market trends by observing changes in the VIX.
- Risk management tool: For institutional investors and asset management companies, the VIX can serve as an important risk management tool. By monitoring the VIX, they can adjust their investment portfolios timely to adapt to changes in market volatility.
- Formulate trading strategies: Some traders use the VIX as a significant reference when formulating trading strategies. For example, when the VIX is at elevated levels, protective measures such as purchasing options or futures contracts may be taken to mitigate market risk.
Does the VIX truly reflect market sentiment?
The rise in the VIX is often associated with increased investor concerns about future volatility in the market, making it a measure of investor panic.
When the VIX increases, it indicates heightened market volatility expectations, often accompanied by concerns and increased emotional reactions among investors. Conversely, a decline in the VIX suggests reduced market volatility expectations and a calmer investor sentiment.
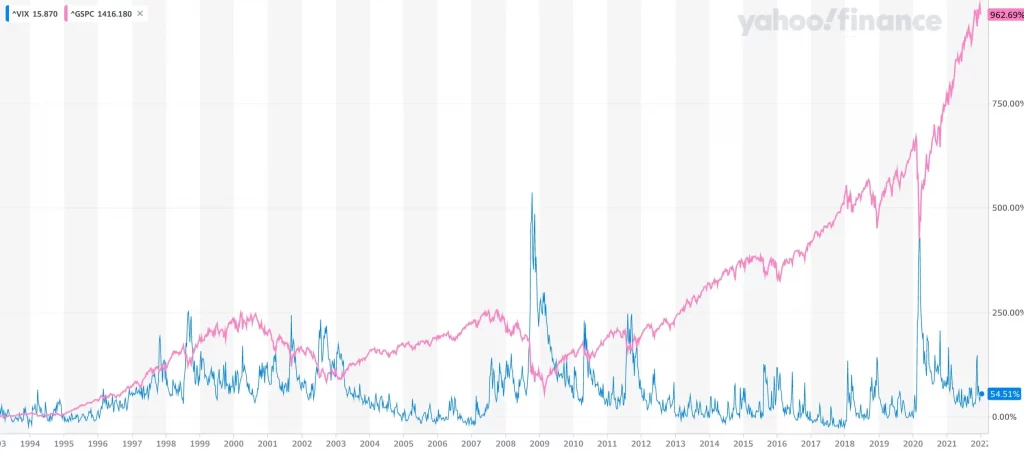
Throughout history, during crises such as the 1997 Asian financial crisis, the 2001 September 11 terrorist attacks, the 2008 financial crisis, the 2010 European debt crisis, the 2018-2019 US-China trade war, and the 2020 COVID-19 pandemic, the VIX exhibited significant spikes, indicating extreme panic in the market.
Relationship between the VIX and the stock market
The VIX primarily reflects the volatility of S&P 500 index futures, used to predict market volatility over the next 30 days, assess future risks, and measure an index compiled for market volatility.
The S&P 500 comprises 500 listed companies in the United States and is one of the most important indices globally, serving as a crucial benchmark for observing the development of the US market.
The VIX and the S&P 500 index exhibit a negative correlation. When observing the two together, you'll often find their trends to be inversely related.
Conclusion
In conclusion, the VIX, as a key indicator of market volatility, plays an essential role in financial markets. It not only helps investors gauge market sentiment but also serves as a reference for risk management tools and trading strategy formulation.
Disclaimer: The views in this article are from the original Creator and do not represent the views or position of Hawk Insight. The content of the article is for reference, communication and learning only, and does not constitute investment advice. If it involves copyright issues, please contact us for deletion.