Mastering RSI Divergence: A Comprehensive Guide for Traders
An RSI divergence is when the price is out of sync with the indicator.Here you’ll learn how to find them and the trading strategies to use.
In financial markets, technical analysis is a crucial tool, and Relative Strength Index (RSI) divergence is a widely recognized technical pattern. RSI divergence not only helps traders identify potential market reversals but also provides a solid basis for trading decisions.
Definition and Basic Principles of RSI Divergence
RSI Divergence refers to the inconsistency between market price movements and the RSI indicator, where the price continues to move in one direction while the RSI indicator moves in the opposite direction. RSI divergence is often regarded as an early warning signal of a trend reversal, indicating potential changes in the current trend.
RSI is an oscillating indicator used to measure the speed and magnitude of price movements over a specific period. Its value ranges between 0 and 100. Typically, an RSI above 70 is considered overbought, while below 30 is considered oversold. However, when the price and RSI indicator show inconsistent movements, a divergence occurs, often signaling a shift in market momentum.
Types of RSI Divergence
Bullish RSI Divergence
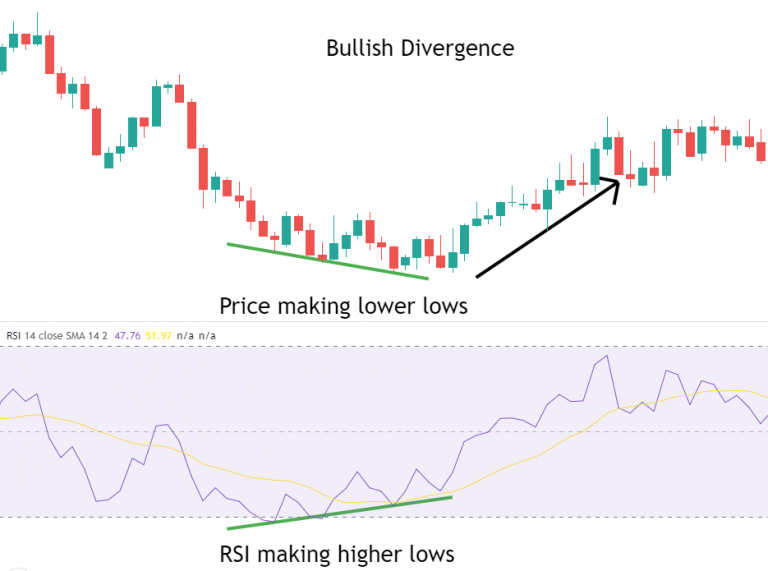
Bullish divergence usually appears at the end of a downtrend, where the price makes a new low, but the RSI indicator fails to reach a new low, instead forming a higher low. This indicates that although the price is still declining, the downward momentum is weakening, and the market may soon reverse and start rising.
Example: Suppose the price of a stock continues to decline, making new lows with each drop, but the RSI indicator shows higher lows. This divergence suggests that selling pressure is weakening, and investors might consider gradually building positions in anticipation of a price rebound.
Bearish RSI Divergence
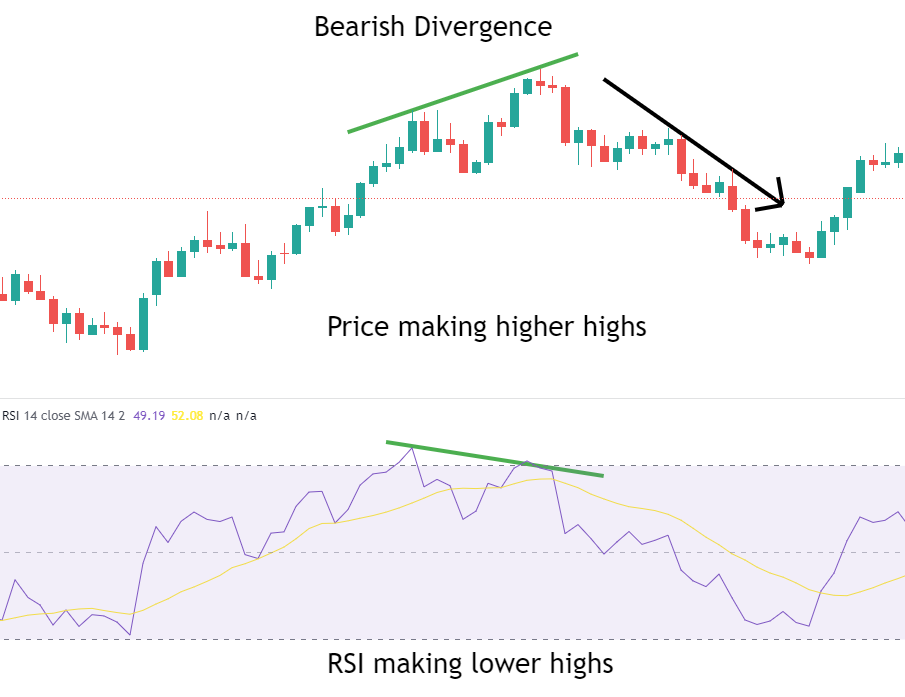
Bearish divergence appears at the end of an uptrend, where the price reaches a new high, but the RSI indicator fails to reach a new high, instead forming a lower high. This suggests that although the price is still rising, the upward momentum is weakening, and the market may soon experience a correction or reversal.
Example: Suppose the stock price of a company continues to rise, making new highs, but the RSI indicator shows lower highs. This bearish divergence indicates that buying pressure is weakening, and investors should be cautious of potential market corrections or declines, adjusting their positions or taking profits accordingly.
Market Significance of RSI Divergence
RSI divergence is an important signal in technical analysis, providing traders with critical information about changes in market momentum. The occurrence of divergence often signals the end of a current trend and the beginning of a new one, making it valuable for identifying potential market reversals.
-
Trend Reversal Signal: RSI divergence is viewed as an early signal of a trend reversal. When a bullish divergence occurs, it suggests that a downtrend may be ending and a new uptrend might begin; conversely, a bearish divergence suggests that an uptrend might be ending, with the market potentially entering a downtrend.
-
Risk Management Tool: For those holding positions, RSI divergence can serve as a risk management tool. If holding long positions, and a bearish divergence occurs, investors might consider reducing or closing positions to mitigate potential downside risk; if holding short positions, a bullish divergence may prompt profit-taking to avoid losses from a possible rebound.
-
Trading Decision Support: RSI divergence is useful not only for trend traders but also for short-term traders. In a consolidating market, divergence signals can help traders identify breakout directions and provide more advantageous entry and exit points.
How to Identify and Trade RSI Divergence
In practice, identifying and utilizing RSI divergence is a technically demanding process, typically involving the following steps:
Steps to Identify Bullish RSI Divergence
-
Identify the Downtrend: First, observe whether the market is in a downtrend or forming a series of lower lows. Even in a sideways market, if multiple lower lows occur, a bullish divergence may form.
_470865315_470.png)
-
Observe the RSI Indicator: As the price forms lows, check the RSI indicator's movement to see if it forms corresponding lower lows.
_470863683_96.png)
-
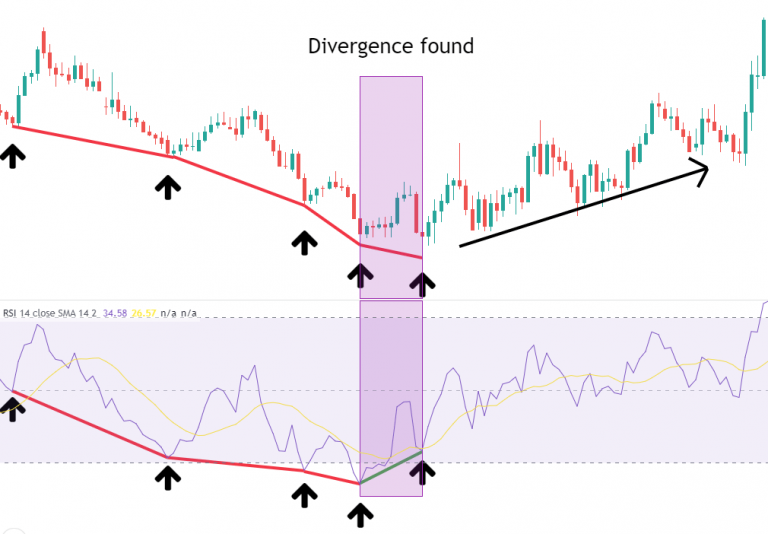
Connect the Lows: Draw trendlines connecting the price lows and RSI lows. If the price lows trendline slopes downward while the RSI lows trendline slopes upward, a bullish divergence has formed.
_470862045_503.png)
-
Confirm the Divergence and Trade: Once the divergence is confirmed, traders may choose to close short positions or begin building long positions. Typically, the price will start rebounding after a bullish divergence appears, providing an entry opportunity.
Steps to Identify Bearish RSI Divergence
-
Identify the Uptrend: First, determine if the market is in an uptrend or if a series of higher highs has been identified.
_471658424_99.png)
-
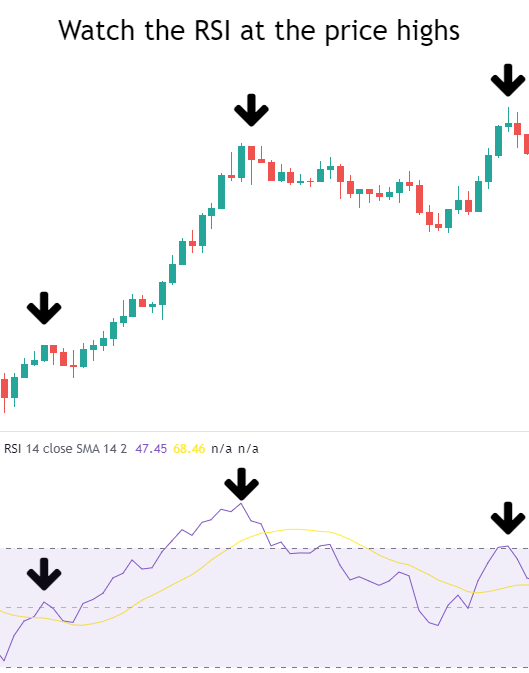
Observe the RSI Indicator: As the price forms highs, check if the RSI indicator forms corresponding higher highs.
-
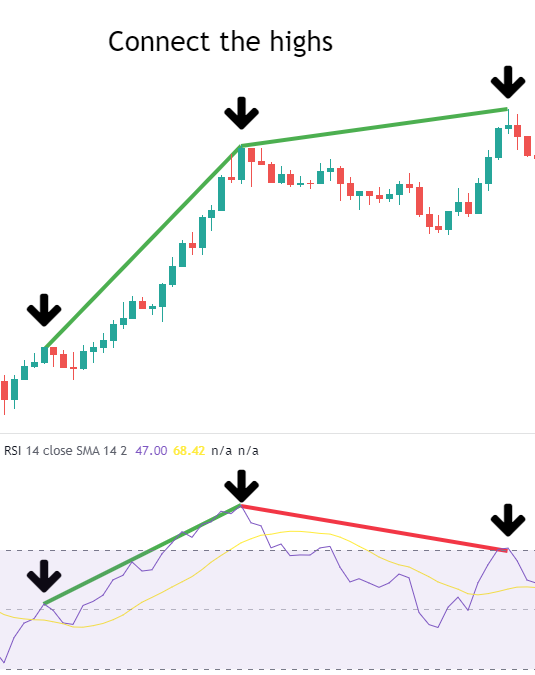
Connect the Highs: Draw trendlines connecting the price highs and RSI highs. If the price highs trendline slopes upward while the RSI highs trendline slopes downward, a bearish divergence has formed.
-
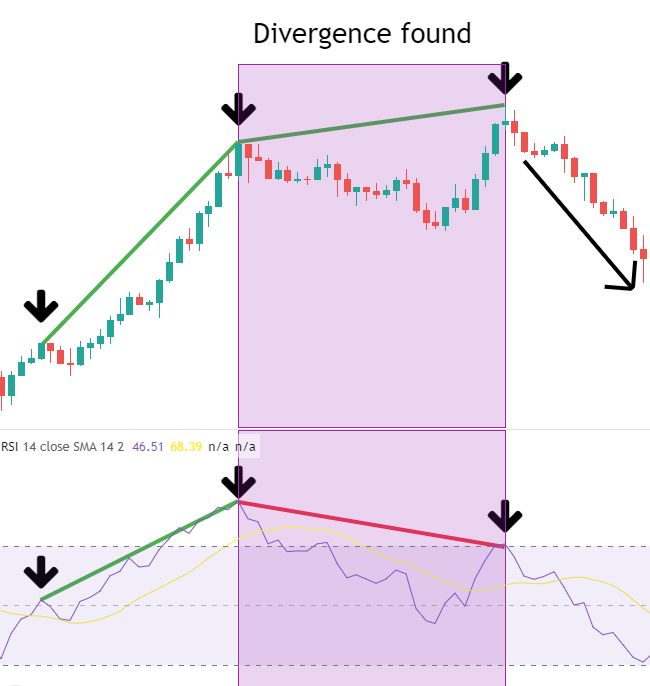
Confirm the Divergence and Trade: After the bearish divergence forms, traders should consider reducing or closing long positions and may open short positions upon confirming further signals, capturing the downward trend.
RSI Divergence Trading Trigger Strategies
When trading with RSI divergence, combining it with other technical indicators and strategies can enhance success rates. Here are two common trigger strategies:
Strategy 1: Post-Divergence Retracement
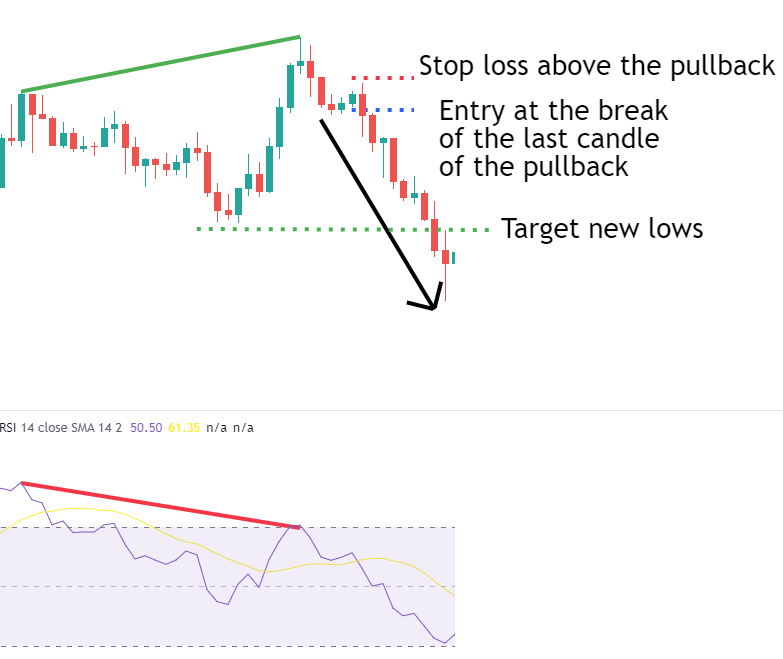
After a divergence signal appears, the price often undergoes a retracement. Traders can wait for the retracement to end and confirm failure before entering a trade. Typically, the price will continue moving in the direction indicated by the divergence after completing the retracement, offering a safer entry point.
Example: After a bearish divergence occurs, the price experiences a brief retracement upward. If this retracement fails and bearish patterns like pin bars or engulfing patterns form, it can serve as a sell signal. Traders may enter at this point, targeting new lows or waiting for another divergence in the opposite direction.
Strategy 2: Moving Average Breakout and Retracement
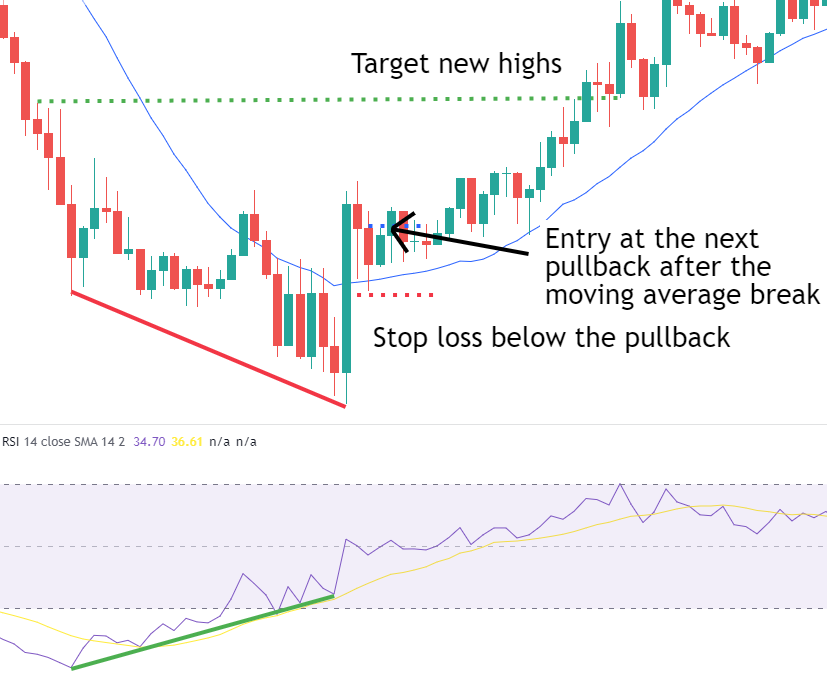
This strategy is often used for long-term trend trading. After a divergence signal, the price often breaks through short- or medium-term moving averages. Traders should wait for the price to retrace near the moving averages and confirm the retracement has ended before entering. This strategy effectively filters out some false signals and improves trade accuracy.
Example: After a bullish divergence, the price breaks above the 20-day moving average and retraces near the average. Traders may choose to enter long positions at this point, targeting new highs or waiting for a bearish divergence signal.
Disclaimer: The views in this article are from the original Creator and do not represent the views or position of Hawk Insight. The content of the article is for reference, communication and learning only, and does not constitute investment advice. If it involves copyright issues, please contact us for deletion.