Rising Window Candlestick Pattern - What Is And How To Trade
Learn all about the Rising Window candlestick pattern.What is, how to trade, and all the best trading strategies.

What is the "Rising Window" Candlestick Pattern?
The "Rising Window" is a Japanese candlestick pattern that is a bullish continuation pattern. It usually occurs during a short pullback after a price rise and shows a rejection of lower prices, often signalling a continuation of the price rise, and is therefore often seen as a signal of trend continuation.
This pattern consists of two consecutive bullish candles (green candles), with a noticeable upward gap between them. The "Rising Window" can be seen as the mirror image of the "Falling Window" pattern, which is bearish.
How to Identify the "Rising Window" Candlestick Pattern?
To identify the "Rising Window" pattern, look for the following characteristics:
- Two Consecutive Bullish Candles: These two candles must have significant bodies, indicating strong buying pressure.
- Upward Gap: There must be a clear upward gap between the two candles.
This pattern usually appears during an uptrend and signals a potential for further price increases.
_386287525_967.png)
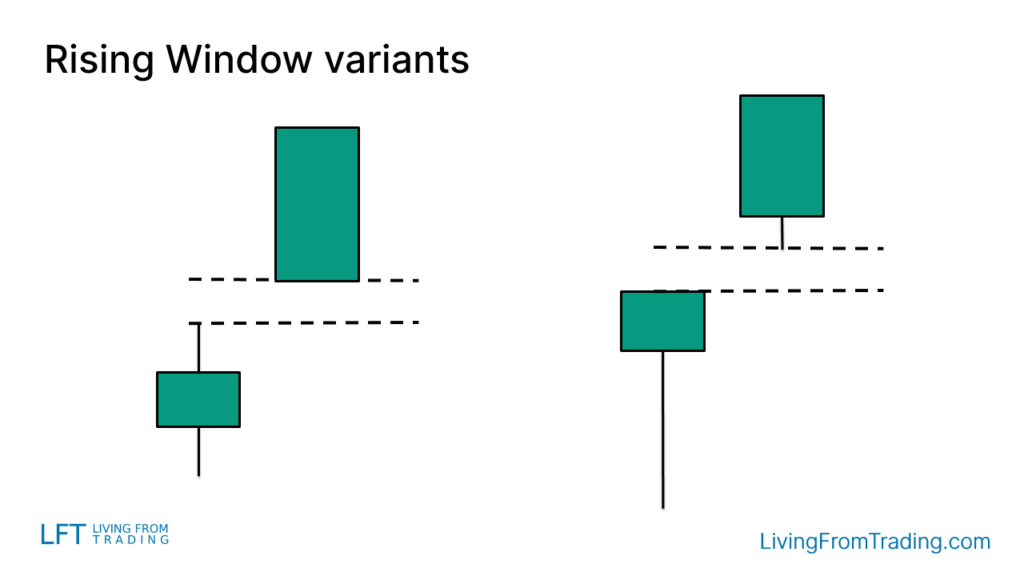
Variations of the "Rising Window" Candlestick Pattern
The "Rising Window" pattern can manifest in various forms on the chart. For example, the candlesticks may or may not have shadows (wicks), but ideally, these shadows should be short and located at the lower part of the candlesticks.
How to Trade
Merely identifying the "Rising Window" pattern is not enough for successful trading. It's crucial to pay attention to its position on the chart, as the same pattern may indicate different market signals depending on where it appears.
When trading, it is generally recommended to enter a long position when the high of the last candle is breached. This is a more conservative entry signal. Alternatively, traders can wait for a pullback to the gap area before entering, though this strategy might miss some trading opportunities.
To reduce trading risk, stop-loss orders are commonly used. A typical stop-loss strategy involves placing the stop-loss on the opposite side of the pattern.
_386284183_996.png)
Trading Strategies
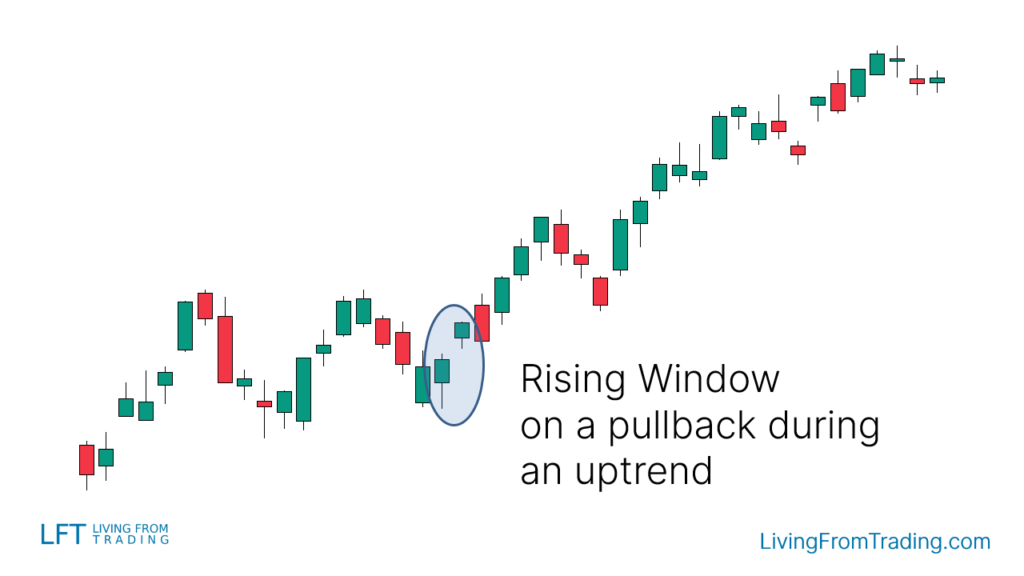
Strategy 1: Naked Chart Pullback
In an uptrend, the "Rising Window" pattern often indicates that the price will continue rising after a brief pullback. Traders can wait for a pullback and then enter when the "Rising Window" pattern appears. Typically, the formation of this pattern signals the end of the pullback and the start of a new upward move.
Trading Steps:
- Confirm that the market is in an uptrend.
- Wait for the price to pull back.
- Identify the "Rising Window" pattern at the end of the pullback.
- Enter a long position when the high of the last candle is breached.
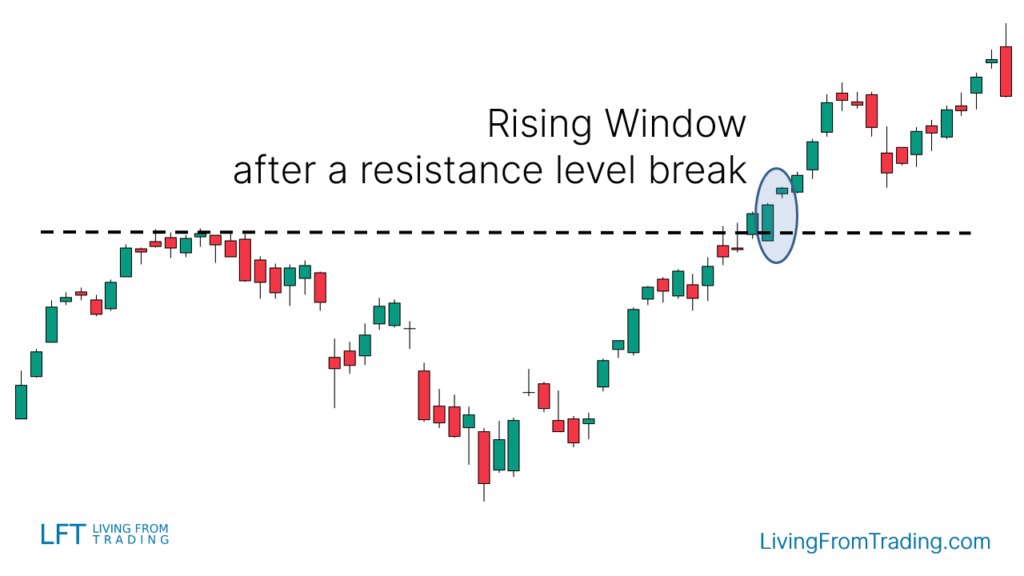
Strategy 2: Trading with Resistance Levels
Resistance levels are price levels where an uptrend might encounter selling pressure. Once breached, they often turn into support levels. The "Rising Window" pattern appearing after a breakout and retest of a resistance level is often a strong buy signal.
Trading Steps:
- Draw key resistance levels on the chart.
- Observe the price breaking through and retesting the resistance level.
- Identify the "Rising Window" pattern during the retest.
- Enter a long position when the high of the last candle is breached, and set stop-loss and take-profit levels.
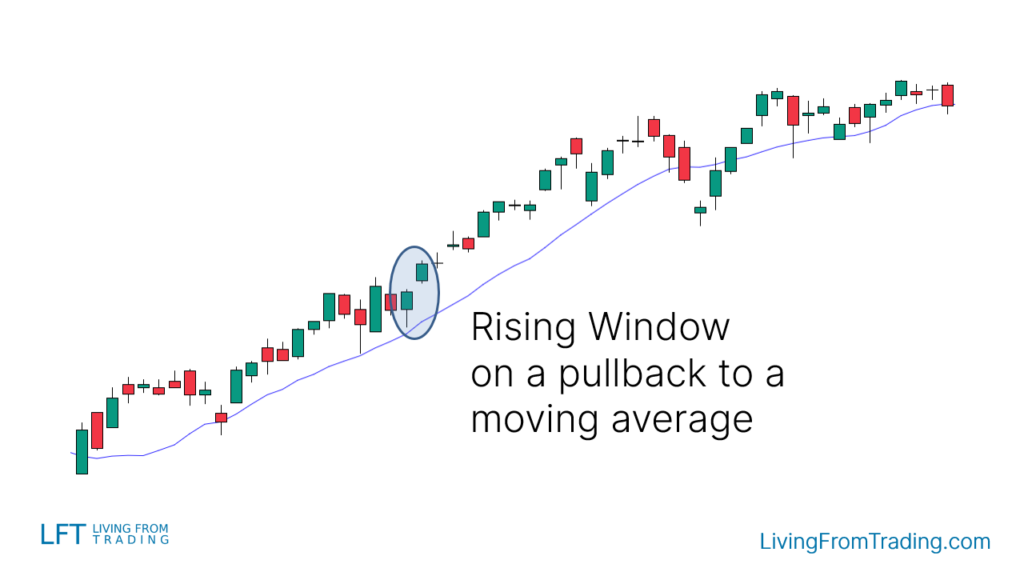
Strategy 3: Trading with Moving Averages
Moving averages are trend-following indicators that help traders determine the overall market trend. When the price pulls back to a moving average and forms a "Rising Window" pattern, it often signals the beginning of a new upward move.
Trading Steps:
- Confirm that the market is in an uptrend and the price is above the moving average.
- Wait for the price to pull back to the moving average.
- Identify the "Rising Window" pattern at the end of the pullback.
- Enter a long position when the high of the last candle is breached, and set stop-loss and take-profit levels.
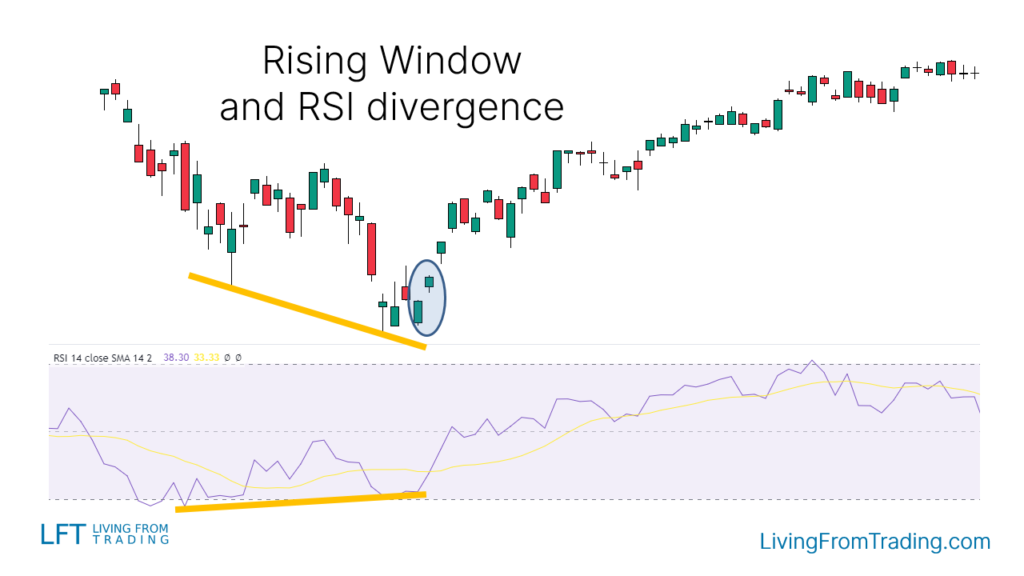
Strategy 4: Trading with RSI Divergence
The Relative Strength Index (RSI) measures price momentum. When the price makes a new low in a downtrend but the RSI fails to make a new low, a divergence occurs, which is a potential reversal signal. If the "Rising Window" pattern appears at this point, consider entering a counter-trend long position.
Trading Steps:
- Mark each low in the downtrend.
- Monitor the RSI for divergence signals.
- Identify the "Rising Window" pattern when the price makes a new low, but the RSI does not.
- Enter a long position when the high of the last candle is breached, and set stop-loss and take-profit levels.
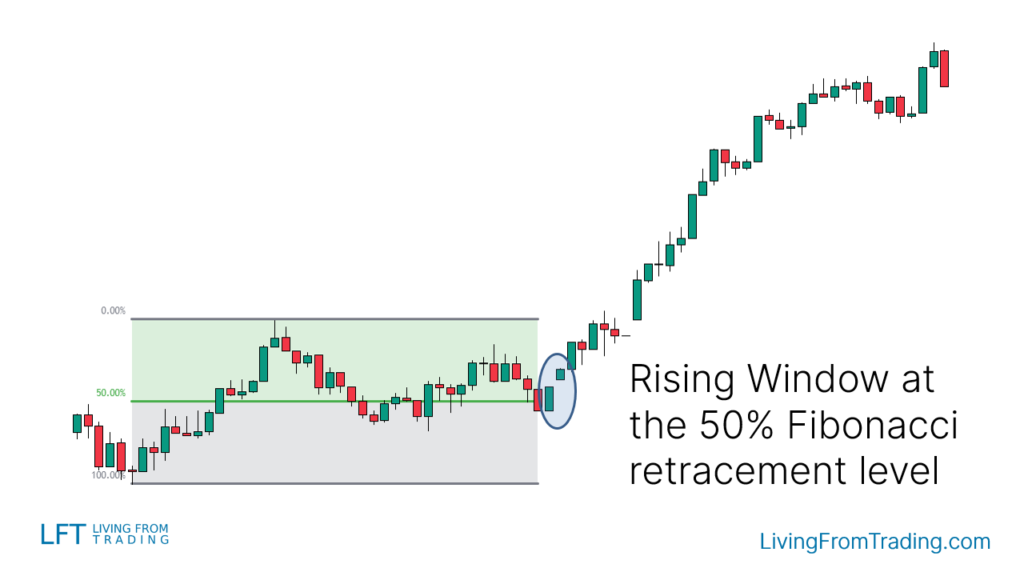
Strategy 5: Trading with Fibonacci Retracement
The Fibonacci retracement tool helps traders identify potential pullback levels within a trend. When the price retraces to a Fibonacci level and forms a "Rising Window" pattern, it usually indicates that the price is about to rebound.
Trading Steps:
- Confirm that the market is in an uptrend.
- Use the Fibonacci tool to mark key retracement levels.
- Wait for the price to retrace to a Fibonacci level.
- Identify the "Rising Window" pattern near the retracement level.
- Enter a long position when the high of the last candle is breached, and set stop-loss and take-profit levels.
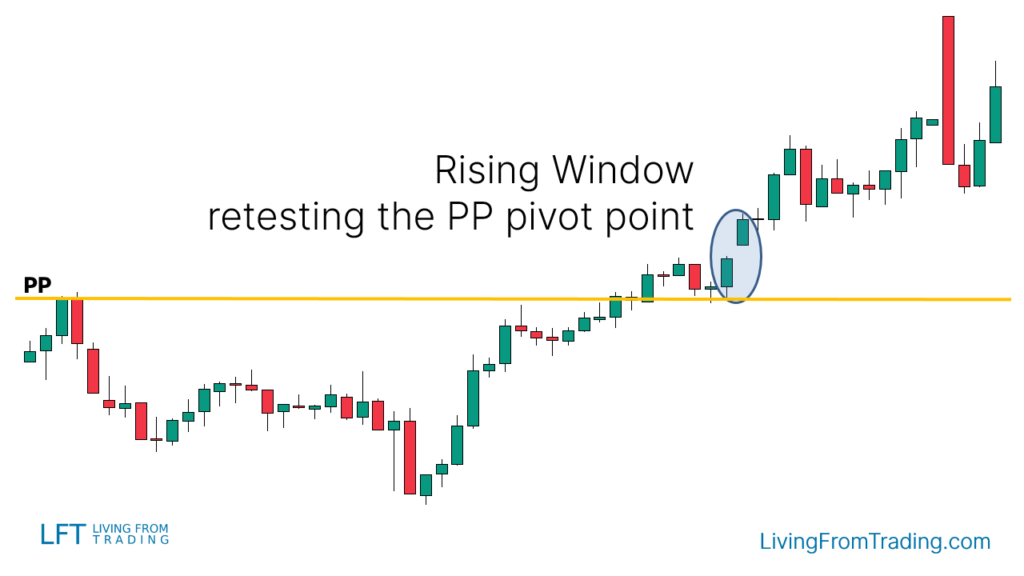
Strategy 6: Trading with Pivot Points
Pivot points are automatically calculated support and resistance levels, often used for short-term trading. When the price breaks above a daily or weekly pivot point and retests it, the appearance of a "Rising Window" pattern can serve as an entry signal.
Trading Steps:
- Activate the pivot point indicator and mark key levels.
- Confirm that the price is in an uptrend and has broken above a pivot point.
- Identify the "Rising Window" pattern during the retest of the pivot point.
- Enter a long position when the high of the last candle is breached, and set stop-loss and take-profit levels.
Conclusion
The "Rising Window" pattern has a success rate of about 75%, indicating that when investors are able to accurately identify and reasonably trade this pattern, they can often make significant gains.
As an efficient bullish continuation pattern, the "Rising Window" helps investors capture more trading opportunities during an uptrend. By combining different technical analysis tools and indicators, such as moving averages, RSI, and Fibonacci retracement, traders can enhance their accuracy and success rate.
However, it is important to remember that any trading strategy carries inherent risks, so proper stop-loss settings and position management are crucial for successful trading.
Disclaimer: The views in this article are from the original Creator and do not represent the views or position of Hawk Insight. The content of the article is for reference, communication and learning only, and does not constitute investment advice. If it involves copyright issues, please contact us for deletion.