Shooting Star Candlestick Pattern - What Is And How To Trade
Learn all about the Shooting Star candlestick pattern.What is, how to trade, and all the best trading strategies.

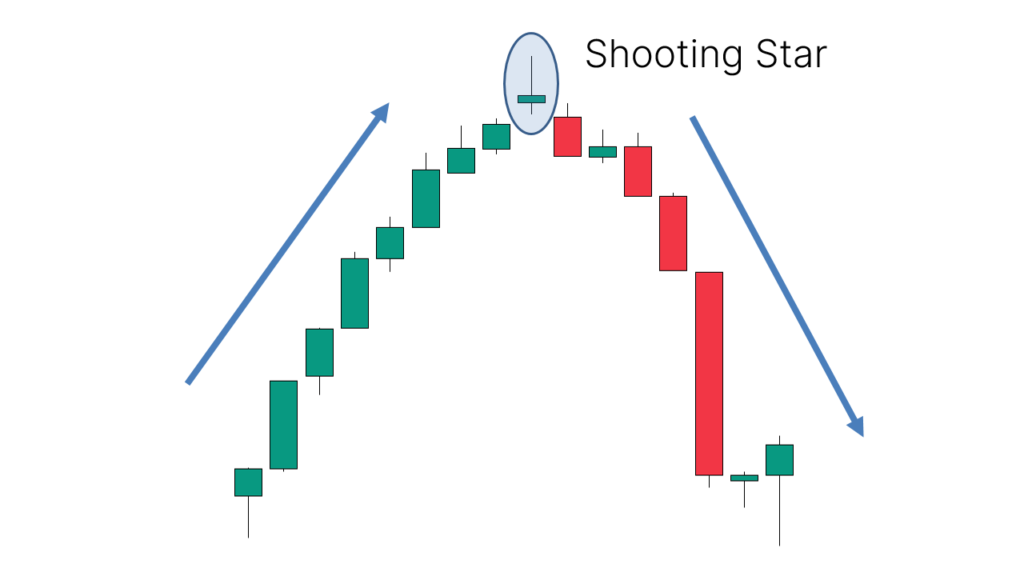
The Shooting Star is a Japanese candlestick pattern known for its bearish reversal signal. Typically appearing after a price uptrend, it indicates a rejection of higher prices. The pattern is considered bearish as it often signals a potential downturn after its formation. The Shooting Star is also a mirrored version of the Hanging Man candlestick pattern.
Identifying the Shooting Star Candlestick Pattern
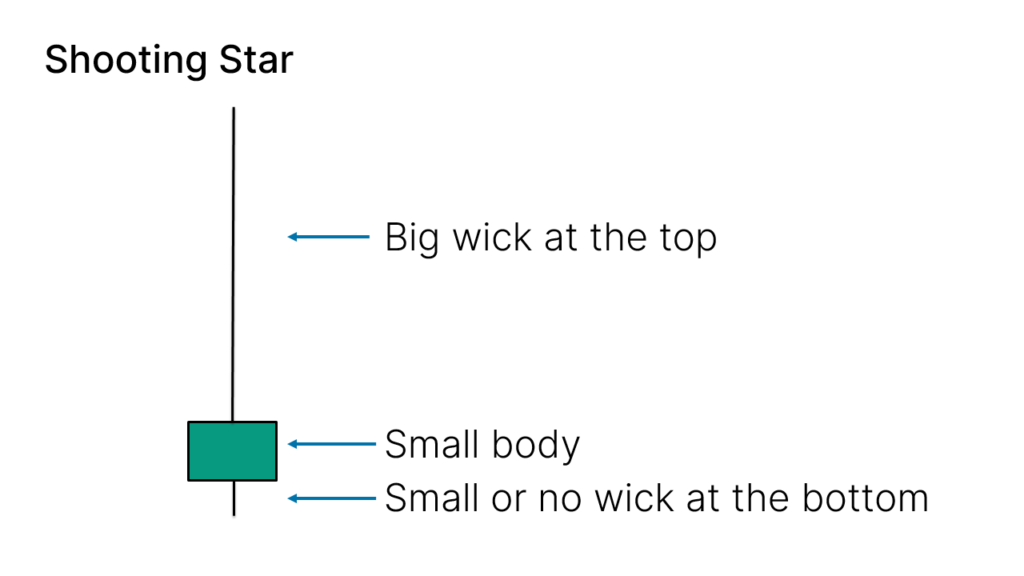
The Shooting Star is characterized by a single candlestick with the following features:
- Body: Small
- Upper Shadow: Long, significantly larger relative to the body
- Lower Shadow: Very small or nonexistent
- Body Color: Not significant
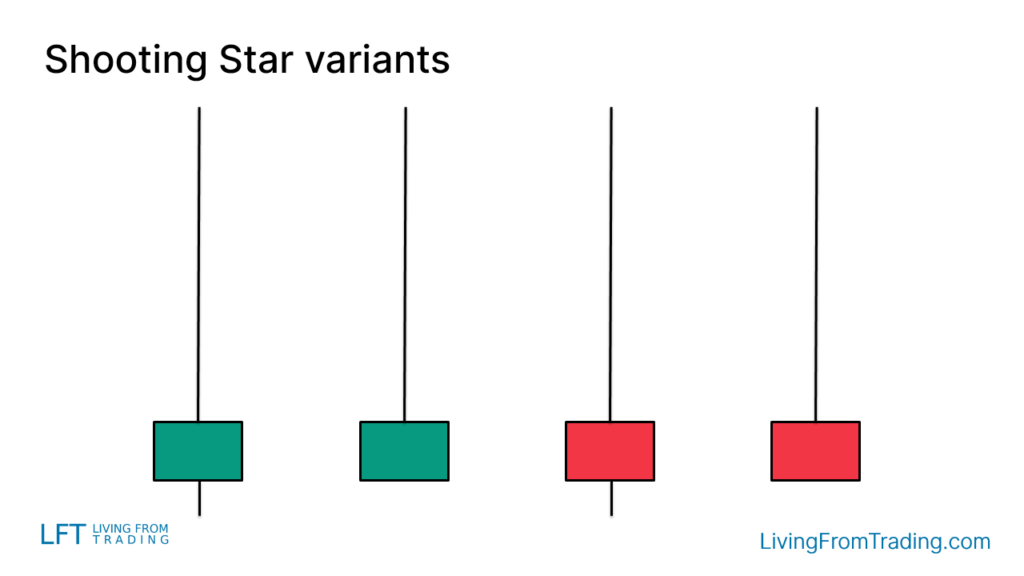
Variants of the Shooting Star Candlestick Pattern
While the Shooting Star may appear differently on charts, its key characteristics—long upper shadow, small body, and minimal or no lower shadow—remain constant. The color of the body is not important.
How to Trade
Trading the Shooting Star requires more than just identifying its shape; the context of its appearance is crucial. An effective Shooting Star should appear after a price uptrend, indicating a potential reversal.
When a Shooting Star appears, traders should consider entering a short position when the low of the candlestick is broken. Additionally, a stop loss should be set to mitigate potential adverse movements. To enhance accuracy, it is often combined with other technical analysis tools or indicators.
Trading Strategies
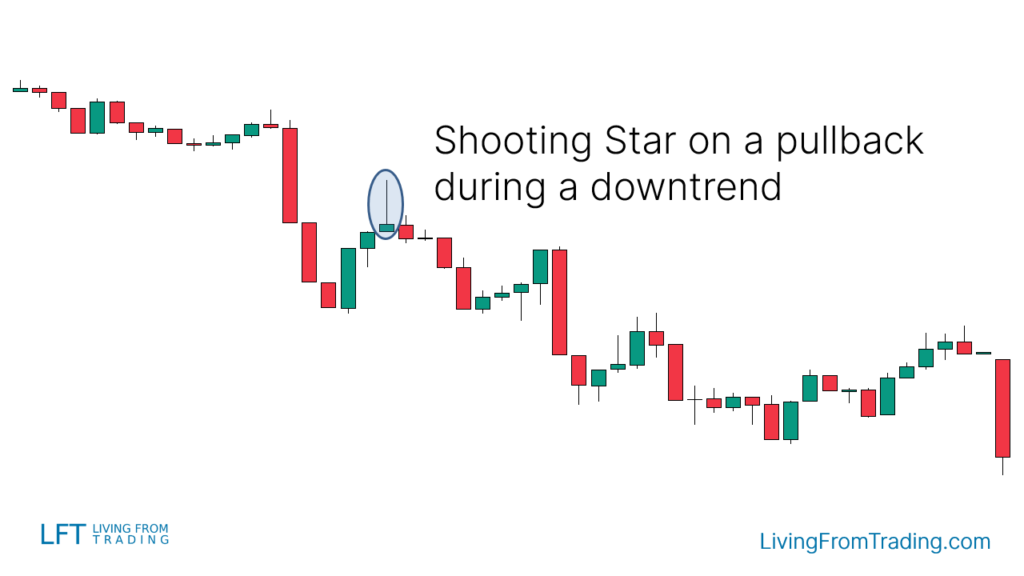
Strategy 1: Pullbacks on Naked Charts
- Confirm that the market is in a downtrend.
- Observe for a price pullback, indicating a short-term rise.
- Look for a Shooting Star pattern during the pullback.
- Short when the price breaks the low of the Shooting Star candle.
- Set the stop loss above the Shooting Star’s high and adjust the target price to the previous low or according to the risk-reward ratio.
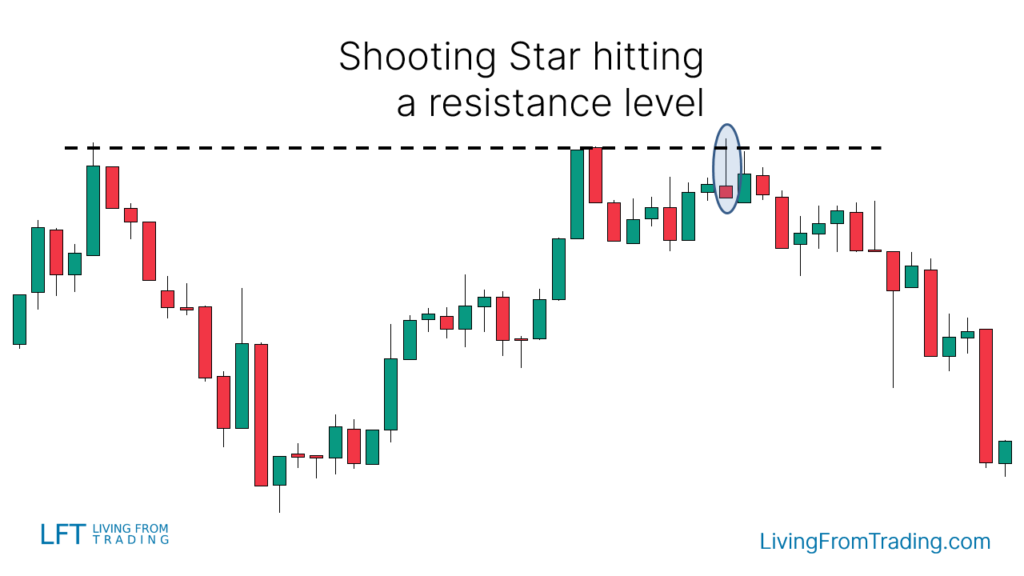
Strategy 2: Trading with Resistance Levels
- Identify major resistance levels on the chart.
- Watch for price movement towards and reaching the resistance level.
- Look for a Shooting Star pattern at this resistance level.
- Short when the price breaks the low of the Shooting Star candle.
- Set the stop loss above the resistance level and adjust the target price to the next support level or according to the risk-reward ratio.
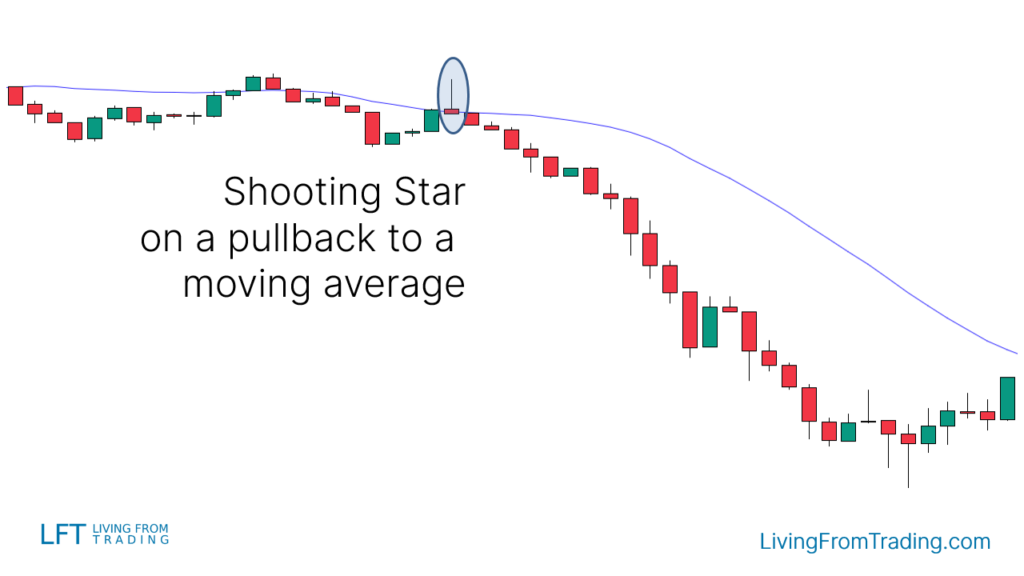
Strategy 3: Trading with Moving Averages
- Determine if the market is in a downtrend and use a 20-day or 50-day moving average as a reference.
- Observe price movements as it pulls back towards the moving average.
- Look for a Shooting Star pattern when the price reaches the moving average.
- Short when the price breaks the low of the Shooting Star candle.
- Set the stop loss above the moving average and adjust the target price to the previous low or according to the risk-reward ratio.
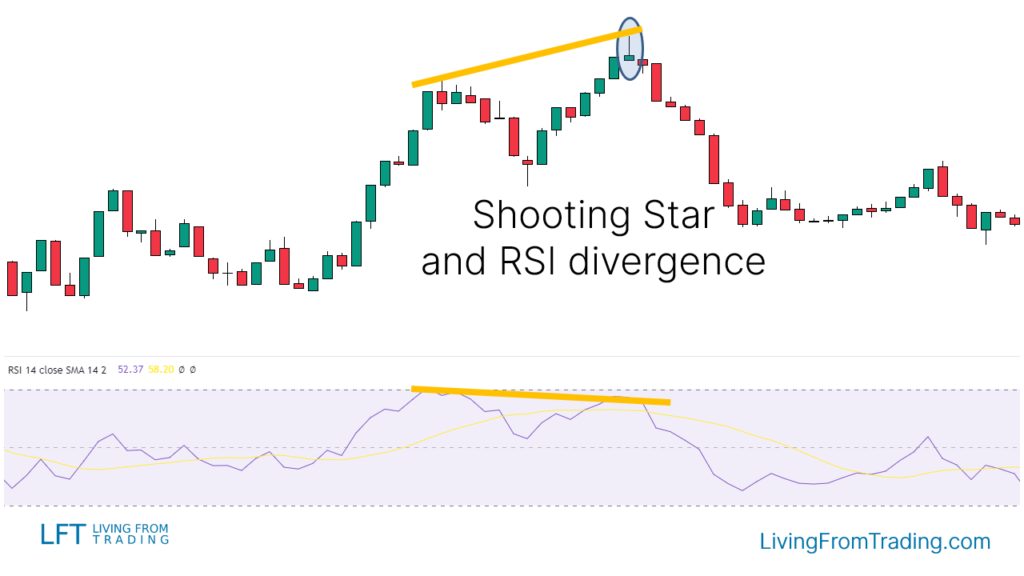
Strategy 4: Trading with RSI Divergences
- Confirm that the market is in an uptrend, with the RSI set to a 14-period.
- Track the price and RSI movements, looking for a divergence where the price makes new highs while RSI does not.
- When RSI divergence forms, look for a Shooting Star pattern at a price high.
- Short when the price breaks the low of the Shooting Star candle.
- Set the stop loss at the high of the Shooting Star and adjust the target price to the previous support level or according to the risk-reward ratio.
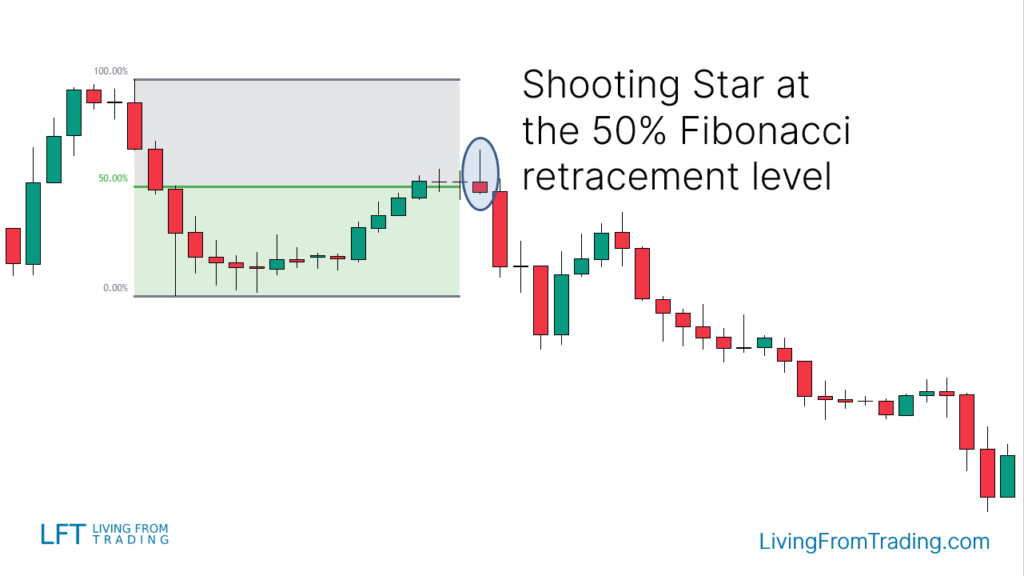
Strategy 5: Trading with Fibonacci Retracement
- Use the Fibonacci retracement tool to mark significant highs and lows of a recent downtrend.
- Watch for price pullbacks to Fibonacci retracement levels (e.g., 38.2%, 50%, 61.8%).
- Look for a Shooting Star pattern when the price hits a Fibonacci level.
- Short when the price breaks the low of the Shooting Star candle.
- Set the stop loss above the Fibonacci level and adjust the target price to the previous low or according to the risk-reward ratio.
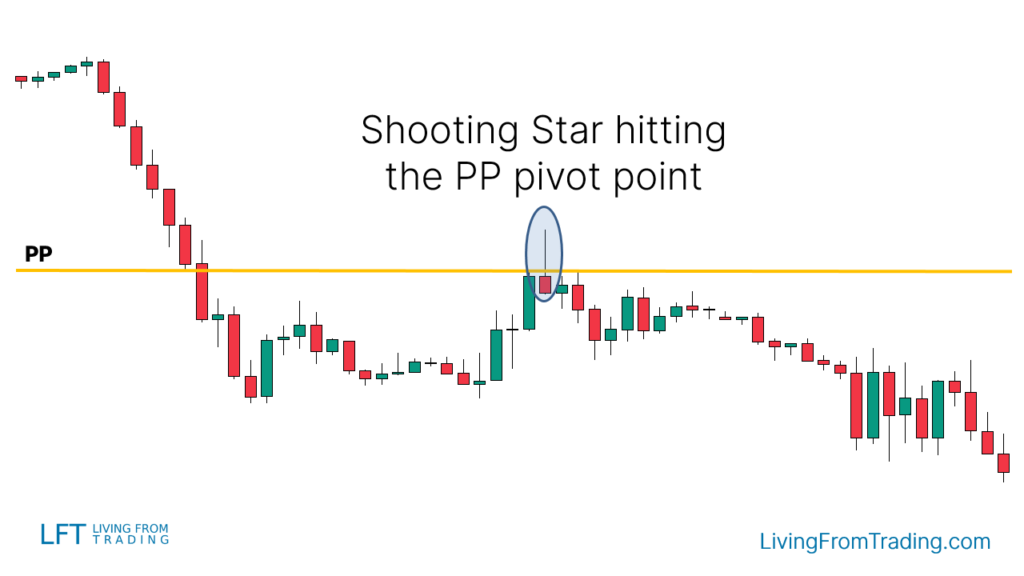
Strategy 6: Trading with Pivot Points
- Use pivot points as automatically calculated support and resistance levels.
- Activate the Pivot Points indicator on the chart (Daily, Weekly, or Monthly).
- Confirm price movement towards resistance pivot points.
- Look for a Shooting Star pattern at the resistance pivot point.
- Short when the price breaks the low of the Shooting Star candle.
- Set the stop loss above the pivot point resistance and adjust the target price to the next support level or according to the risk-reward ratio.
Summary
The Shooting Star is a single-candle bearish reversal pattern that appears after a price uptrend. Its effectiveness can be enhanced by combining it with other technical indicators and strategies, such as pullbacks, resistance levels, moving averages, RSI divergences, Fibonacci retracements, and pivot points. The success rate for the Shooting Star pattern is approximately 60%.
Disclaimer: The views in this article are from the original Creator and do not represent the views or position of Hawk Insight. The content of the article is for reference, communication and learning only, and does not constitute investment advice. If it involves copyright issues, please contact us for deletion.