Three Inside Up Candlestick Pattern - What Is And How To Trade
Learn all about the Three Inside Up candlestick pattern.What is, how to trade, and all the best trading strategies.

This article delves into the "Three Inside Up" candlestick pattern, explaining its definition, identification methods, variations, and trading strategies. The "Three Inside Up" is a crucial Japanese candlestick pattern commonly used to predict bullish market reversals.
What is the Three Inside Up Candlestick Pattern?
The "Three Inside Up" is a bullish reversal pattern, typically appearing after a price decline, indicating rejection of lower prices. This pattern suggests that the market may shift from a downtrend to an uptrend. The "Three Inside Up" is the mirror image of the "Three Inside Down" pattern.
How to Identify the Three Inside Up Candlestick Pattern
The "Three Inside Up" pattern consists of three candlesticks, identified as follows:
- The first candlestick must be bearish.
- The second candlestick must be bullish, with its close ideally above the 50% level of the first candlestick's body.
- The third candlestick should close above the first candlestick's close.
_2648505981_804.png)
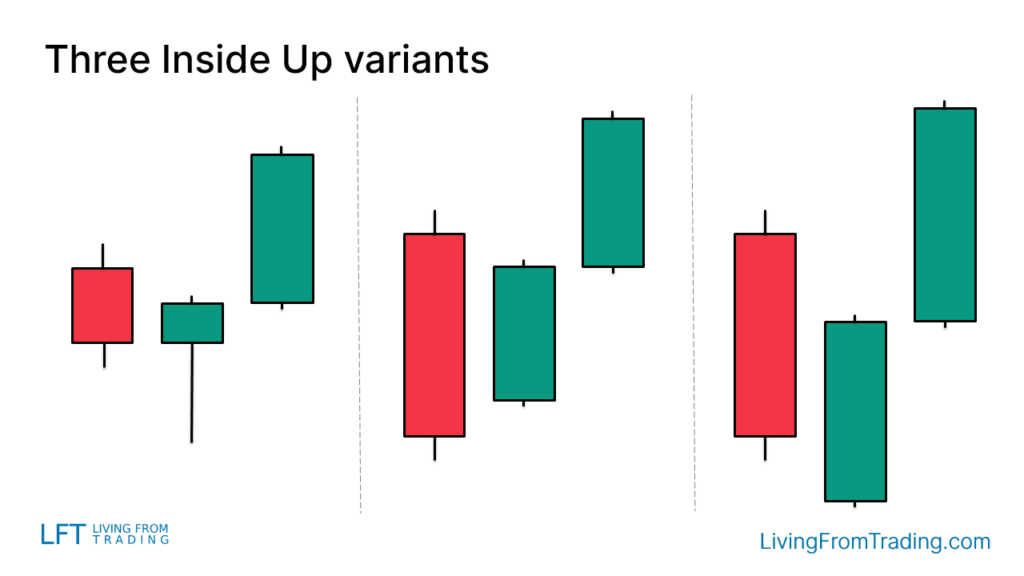
Variants of the Three Inside Up Candlestick Pattern
The "Three Inside Up" pattern may appear slightly different on various charts:
- The second candlestick may have a long lower wick.
- The second candlestick may be entirely within the body of the first candlestick.
- The second candlestick may open with a gap below the first candlestick.
How to Trade
When trading the "Three Inside Up" pattern, it is essential not only to find a pattern with the same shape but also to consider its location. A valid "Three Inside Up" pattern should appear at the bottom of a price decline.
The ideal entry point is when the high of the third candlestick is broken, signaling a potential long trade. Setting a stop loss is crucial, typically placing it on the opposite side of the pattern to protect against unexpected losses.
_2648502194_846.png)
Trading Strategies for the Three Inside Up Candlestick Pattern
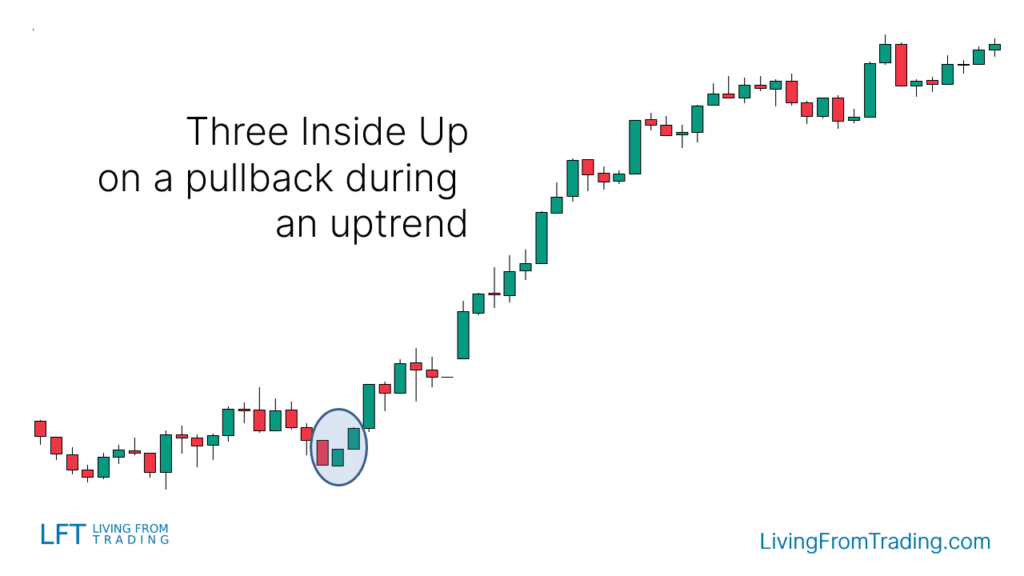
Strategy 1: Pullbacks on Naked Charts
As a bullish reversal pattern, the "Three Inside Up" is particularly noteworthy during an uptrend. First, wait for a price pullback, and then look for the appearance of the "Three Inside Up" pattern during the pullback. This often signals the end of the pullback and the start of a new upward movement.
- Execution Steps: Confirm the price is in an uptrend, wait for a pullback, observe the formation of the "Three Inside Up" pattern, and enter a long trade when the high of the third candlestick is broken.
- Applicable Markets: This strategy is suitable for markets with clear trends and significant volatility.
Strategy 2: Trading with Support Levels
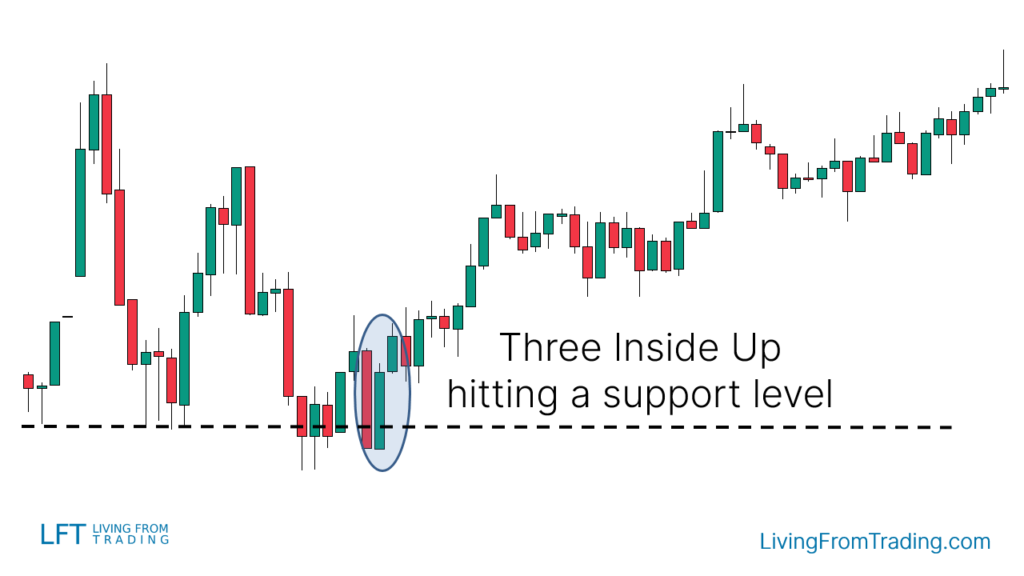
Support levels are critical areas where price reversals often occur. When the price declines and hits a support level, look for the "Three Inside Up" pattern. If the pattern appears at this level, it indicates that the support level is holding, providing a good opportunity to go long when the third candlestick’s high is broken.
- Execution Steps: Draw support levels on your chart, wait for the price to decline to the support level, check for the formation of the "Three Inside Up" pattern, and enter a long trade when the third candlestick’s high is broken.
- Applicable Markets: This strategy works well in markets with clear support and resistance levels.
Strategy 3: Trading with Moving Averages
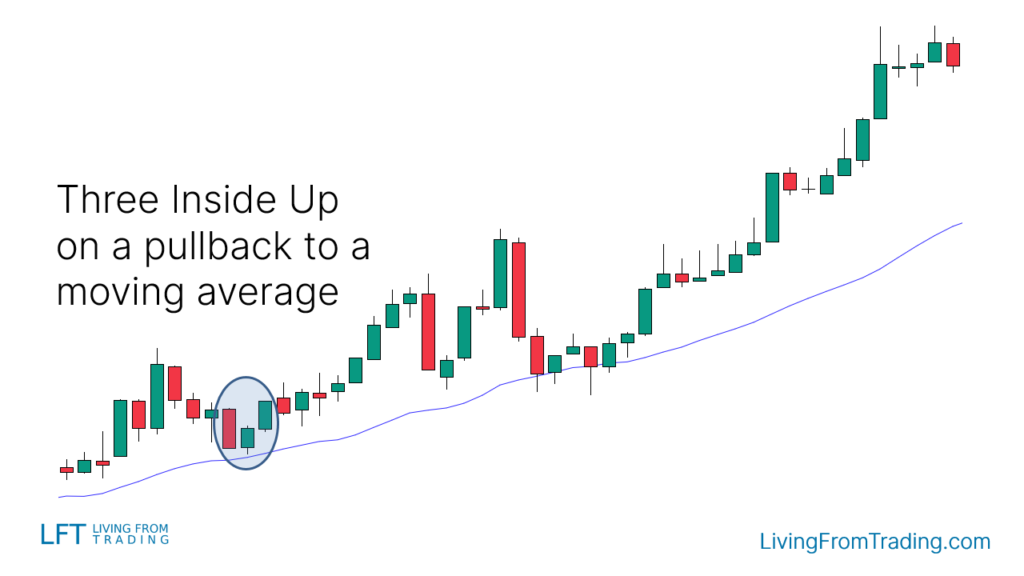
Moving averages are popular trend-following indicators. When the price is in an uptrend, moving averages often act as dynamic support levels. A potential long opportunity arises when the price pulls back to a moving average and forms a "Three Inside Up" pattern.
- Execution Steps: Confirm the market is in an uptrend and add a moving average to the chart, wait for the price to pull back to the moving average, observe the formation of the "Three Inside Up" pattern, and enter a long trade when the third candlestick’s high is broken.
- Applicable Markets: This strategy is effective in markets with a clear trend and steady volatility.
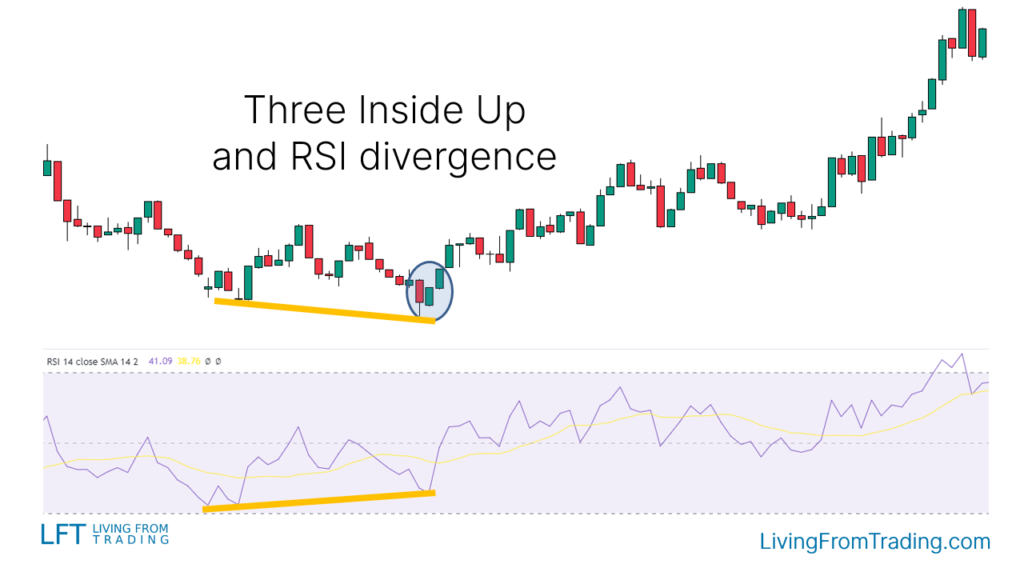
Strategy 4: Trading with RSI Divergences
Unlike other strategies, RSI divergence trading focuses on the divergence between price and the RSI indicator. In a downtrend, if the price keeps making lower lows while the RSI fails to do so, the appearance of a "Three Inside Up" pattern might signal an upcoming reversal.
- Execution Steps: Identify a market in a downtrend with continuous lower lows, observe the RSI indicator for divergence (where the price makes lower lows but the RSI does not), and if a "Three Inside Up" pattern appears, enter a long trade when the third candlestick’s high is broken.
- Applicable Markets: This strategy is suitable for markets in a downtrend with clear divergence signals.
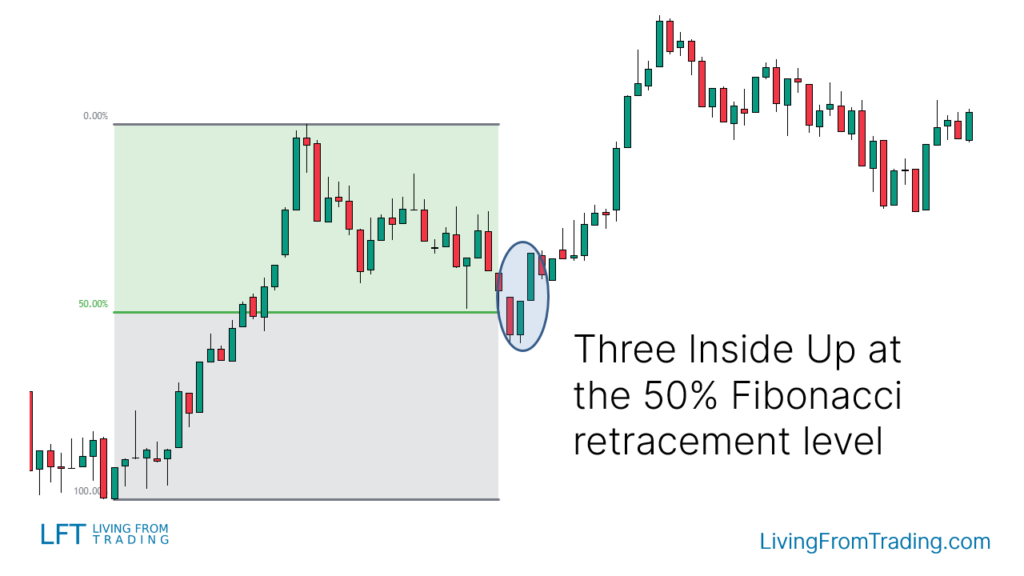
Strategy 5: Trading with Fibonacci Retracement
Fibonacci retracement is a commonly used technical analysis tool to identify price pullback levels. When the price retraces to a key Fibonacci level and forms a "Three Inside Up" pattern, it signals a long entry.
- Execution Steps: Confirm the price is in an uptrend, use the Fibonacci retracement tool to mark retracement levels, wait for the price to retrace to a Fibonacci level and observe the formation of the "Three Inside Up" pattern, and enter a long trade when the third candlestick’s high is broken.
- Applicable Markets: This strategy is ideal for volatile markets with clear trends.
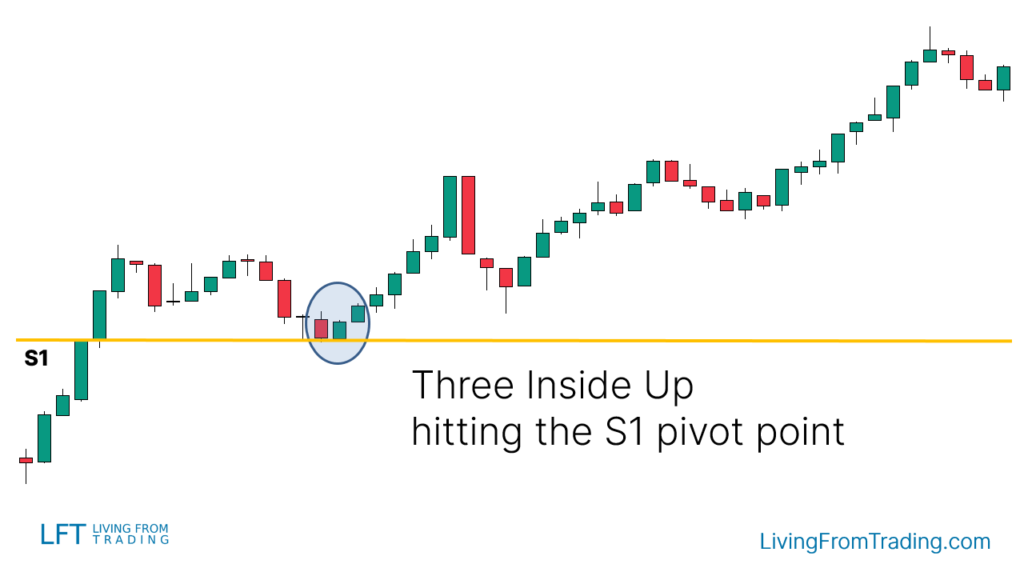
Strategy 6: Trading with Pivot Points
Pivot points are automatic support and resistance levels calculated using mathematical formulas, particularly useful for intraday trading. When the price approaches a pivot point support level, look for the "Three Inside Up" pattern to signal a potential rebound.
- Execution Steps: Activate the pivot points indicator on your chart, confirm that the price is in an uptrend or near a support level, wait for the price to decline to a pivot point support level, and observe the formation of the "Three Inside Up" pattern. Enter a long trade when the third candlestick’s high is broken.
- Applicable Markets: This strategy is effective for intraday and short-term trading, especially in markets with clear support and resistance levels.
Conclusion
The "Three Inside Up" is a bullish reversal pattern composed of three candlesticks, typically appearing after a price decline. By combining the pattern with other technical indicators such as pullbacks, support levels, and moving averages, traders can enhance the accuracy of their trades. Successful trading depends not only on identifying the pattern but also on understanding its location and the market environment.
Disclaimer: The views in this article are from the original Creator and do not represent the views or position of Hawk Insight. The content of the article is for reference, communication and learning only, and does not constitute investment advice. If it involves copyright issues, please contact us for deletion.