Mat Hold Candlestick Pattern - What Is And How To Trade
Learn all about the Mat Hold candlestick pattern.What is, how to trade, and all the best trading strategies.

The Mat Hold candlestick pattern is a continuation pattern in Japanese candlestick charting, and it comes in both bullish and bearish versions. This article delves into the definition, identification methods, and trading strategies for the Mat Hold candlestick pattern.
Introduction to the Mat Hold Candlestick Pattern
The Mat Hold pattern is a continuation pattern, with both bullish and bearish variants. The bullish Mat Hold appears after a price uptrend, indicating that the price is supported at lower levels and suggesting a continuation of the uptrend. Conversely, the bearish Mat Hold emerges after a price downtrend, showing resistance at higher levels and hinting at a continuation of the downtrend.
Identifying the Bullish Mat Hold Candlestick Pattern
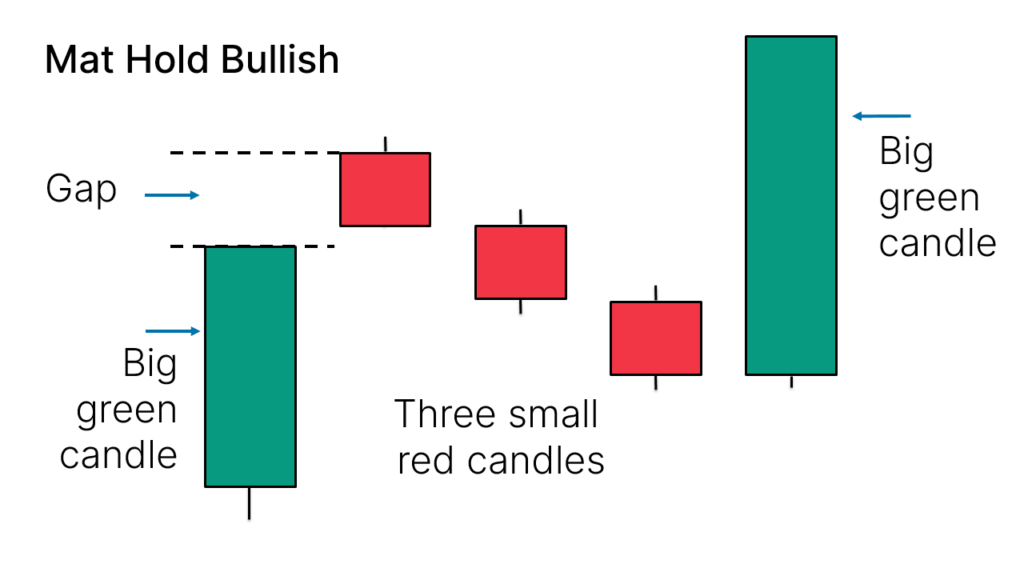
The bullish Mat Hold pattern consists of five candles and is characterized by the following features:
- Initial Big Bullish Candle: A large green candle appears first.
- Gap and Three Small Bearish Candles: A price gap follows, and three small red candles appear.
- Red Candles Do Not Breach Initial Candle's Low: The lows of these red candles do not fall below the low of the initial green candle.
- Final Big Bullish Candle: A final large green candle appears, closing above the highs of the preceding three candles.
An example chart of the bullish Mat Hold pattern is shown below:
Identifying the Bearish Mat Hold Candlestick Pattern
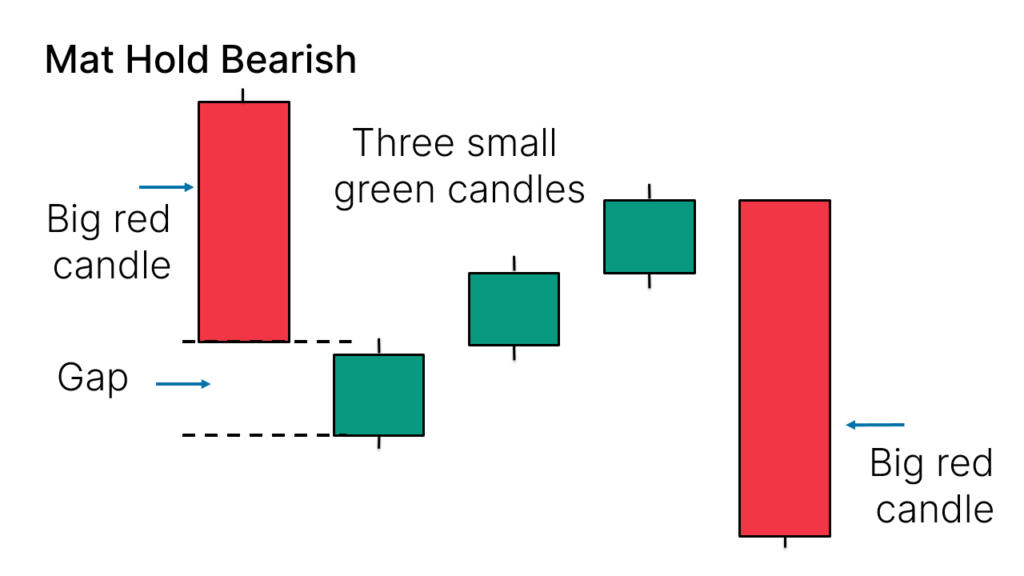
The bearish Mat Hold pattern also comprises five candles and is identified by:
- Initial Big Bearish Candle: A large red candle appears first.
- Gap and Three Small Bullish Candles: A price gap follows, and three small green candles appear.
- Green Candles Do Not Breach Initial Candle's High: The highs of these green candles do not exceed the high of the initial red candle.
- Final Big Bearish Candle: A final large red candle appears, closing below the lows of the preceding three candles.
An example chart of the bearish Mat Hold pattern is shown below:
Trading the Bullish Mat Hold Candlestick Pattern
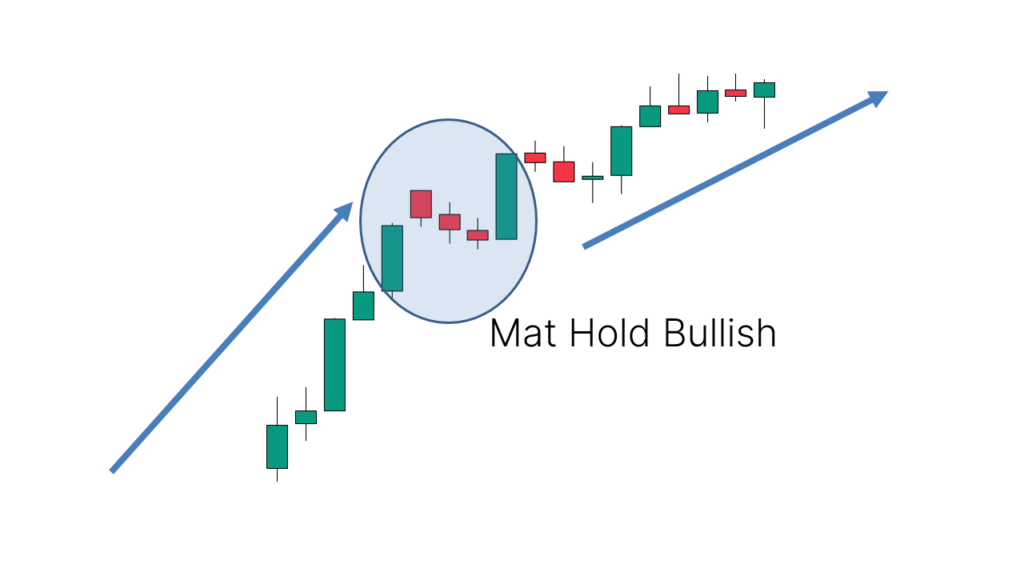
When trading the bullish Mat Hold, it's not enough to identify the pattern alone; its location is also crucial. The bullish Mat Hold should ideally form after an uptrend, signaling a potential continuation of the upward movement. The trading steps are:
- Entry Signal: Enter a long position when the high of the last candle is breached.
- Stop Loss: Place a stop loss on the other side of the pattern to manage risk.
Trading the Bearish Mat Hold Candlestick Pattern
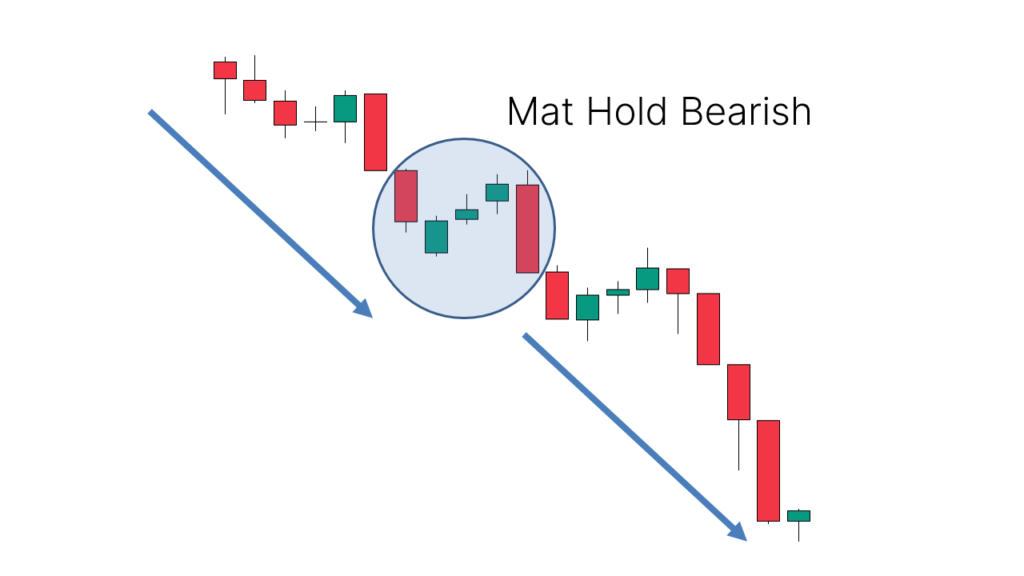
Trading the bearish Mat Hold involves similar steps to the bullish version but in the opposite direction. The trading steps are:
- Entry Signal: Enter a short position when the low of the last candle is breached.
- Stop Loss: Place a stop loss on the other side of the pattern to manage risk.
Mat Hold Candlestick Pattern Trading Strategies
To enhance trading accuracy, combining the Mat Hold pattern with other technical analysis methods or indicators is beneficial. Here are several strategies:
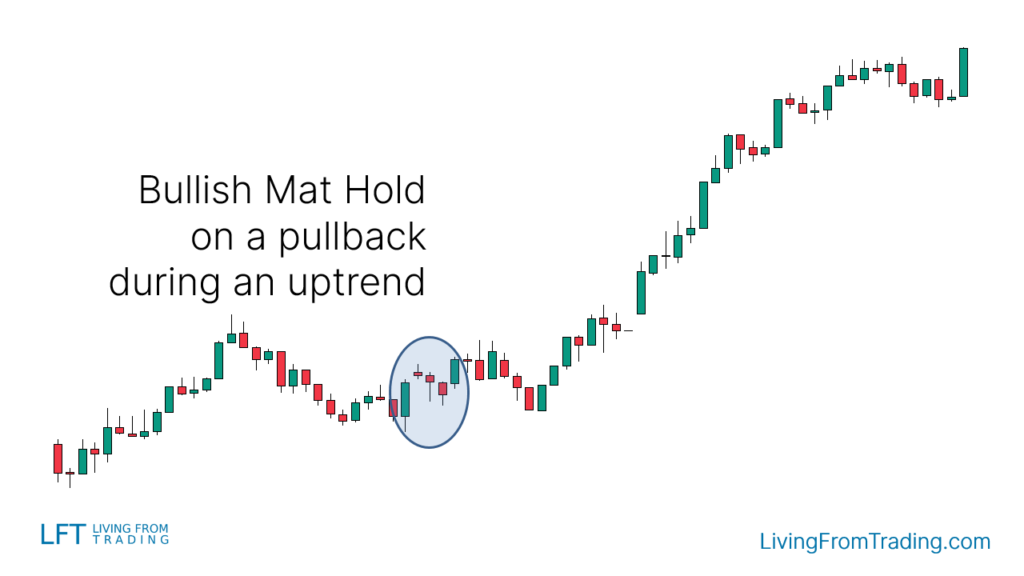
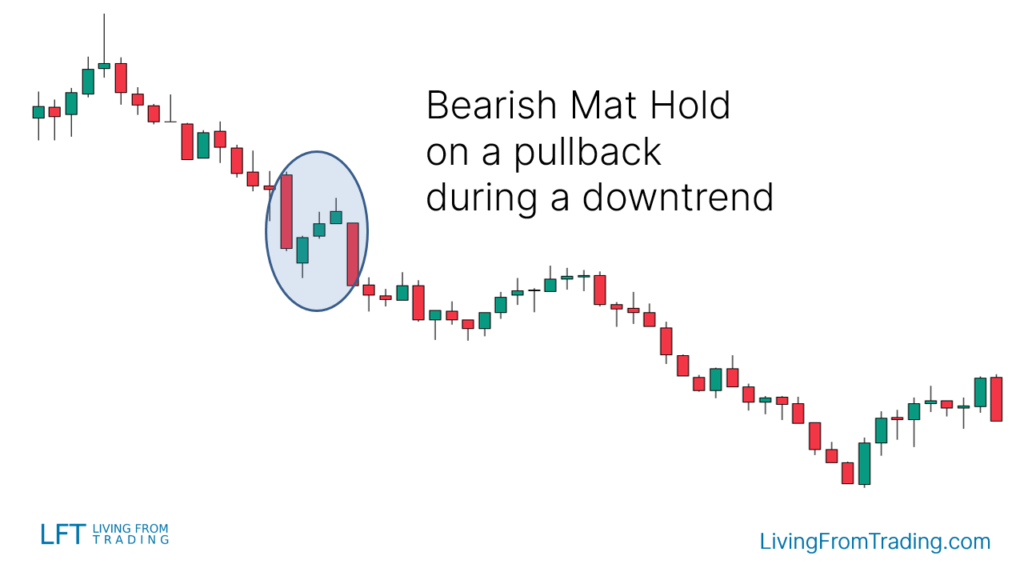
Strategy 1: Pullback on Naked Charts
Mat Hold is particularly effective during trends. This strategy involves:
- Trend Identification: Confirm whether the market is in an uptrend (bullish Mat Hold) or downtrend (bearish Mat Hold).
- Wait for Pullback: During the trend, wait for a price pullback.
- Identify Mat Hold Pattern: A Mat Hold after a pullback generally indicates trend continuation.
For example, a typical bullish Mat Hold pattern in an uptrend is shown below:
Similarly, a bearish Mat Hold pattern in a downtrend is shown below:
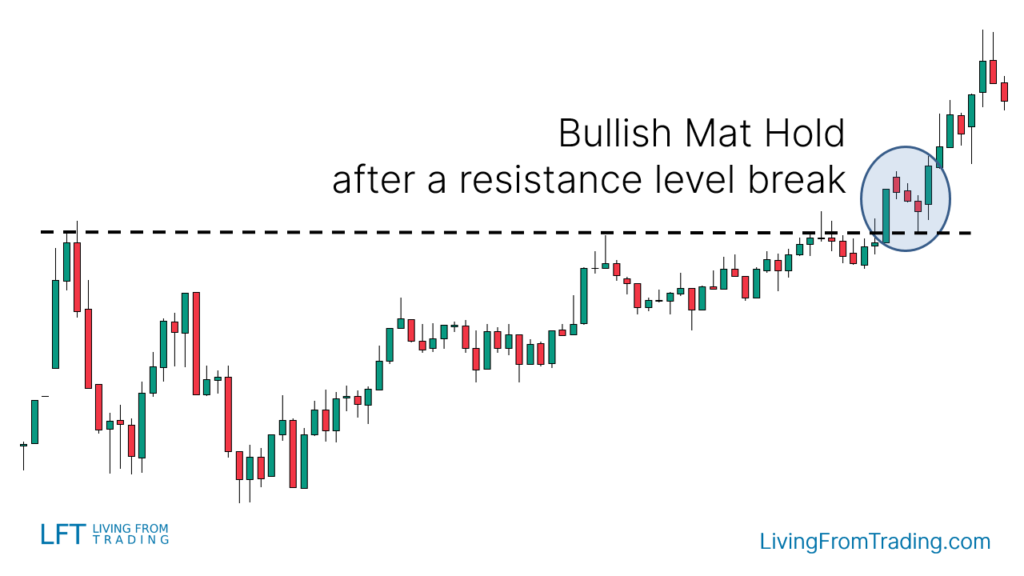
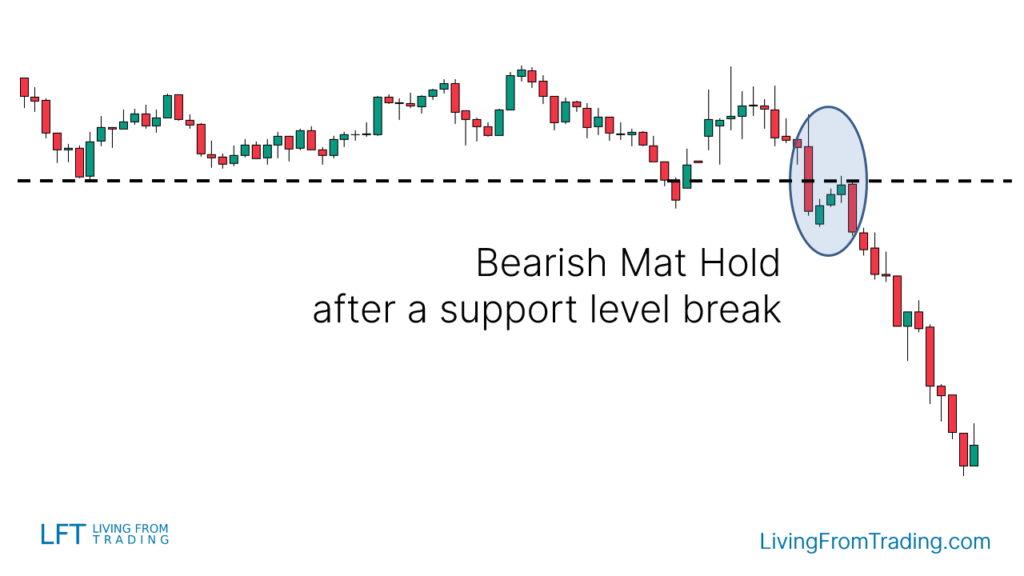
Strategy 2: Combining Support and Resistance Levels
Utilize support and resistance levels to identify entry points, trading when these levels are breached and tested along with the Mat Hold pattern.
Bullish Trades:
- Draw resistance levels on the chart.
- Wait for a breakout above resistance.
- Enter a buy position when the price pulls back to resistance and forms a Mat Hold pattern.
- Set stop loss and take profit levels, anticipating further price increase.
Bearish Trades:
- Draw support levels on the chart.
- Wait for a breakdown below support.
- Enter a sell position when the price rebounds to support and forms a bearish Mat Hold pattern.
- Set stop loss and take profit levels, anticipating further price decrease.
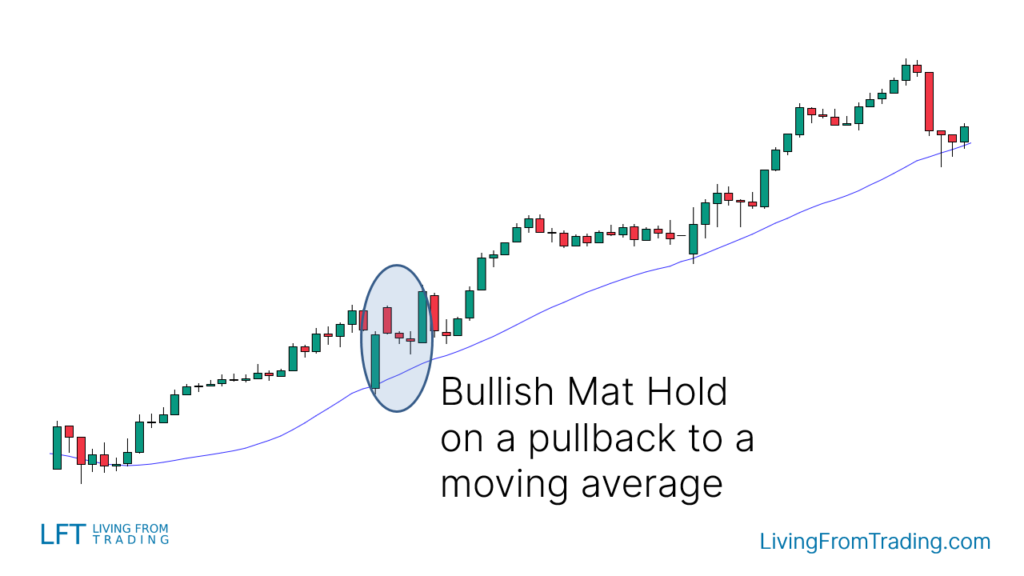
Strategy 3: Combining Moving Averages
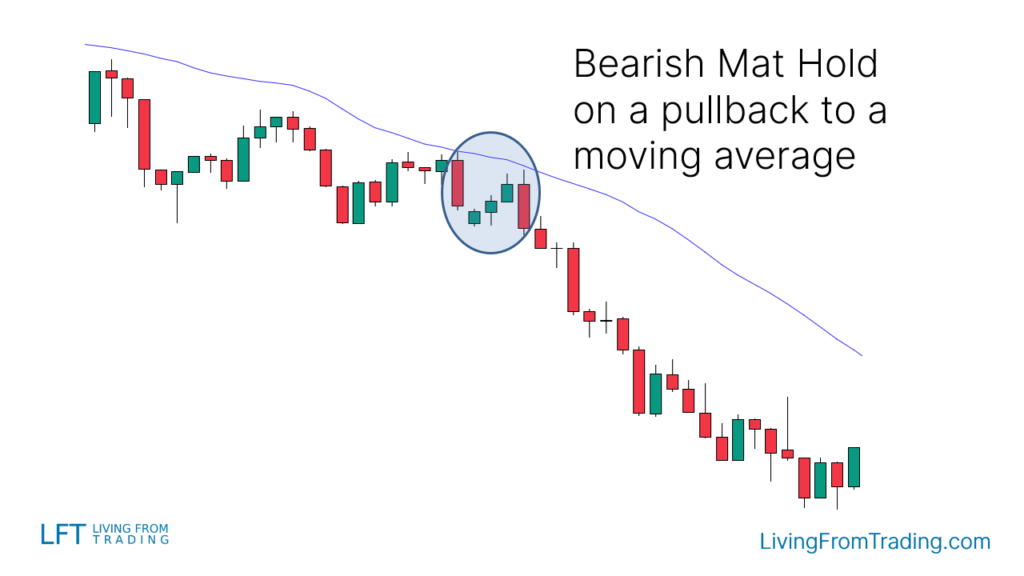
Use moving average pullbacks for trading. When the price pulls back to a moving average and forms a Mat Hold pattern, trade accordingly.
Bullish Trades:
- Identify an uptrend with the price above the moving average.
- Wait for a pullback to the moving average.
- Observe if a Mat Hold pattern forms near the moving average.
- Enter a buy position when the price breaks above the high of the last Mat Hold candle.
- Set stop loss and take profit levels, expecting further price rise.
Bearish Trades:
- Identify a downtrend with the price below the moving average.
- Wait for a price rebound to the moving average.
- Observe if a Mat Hold pattern forms near the moving average.
- Enter a sell position when the price breaks below the low of the last Mat Hold candle.
- Set stop loss and take profit levels, expecting further price decline.
Strategy 4: Combining RSI Divergence
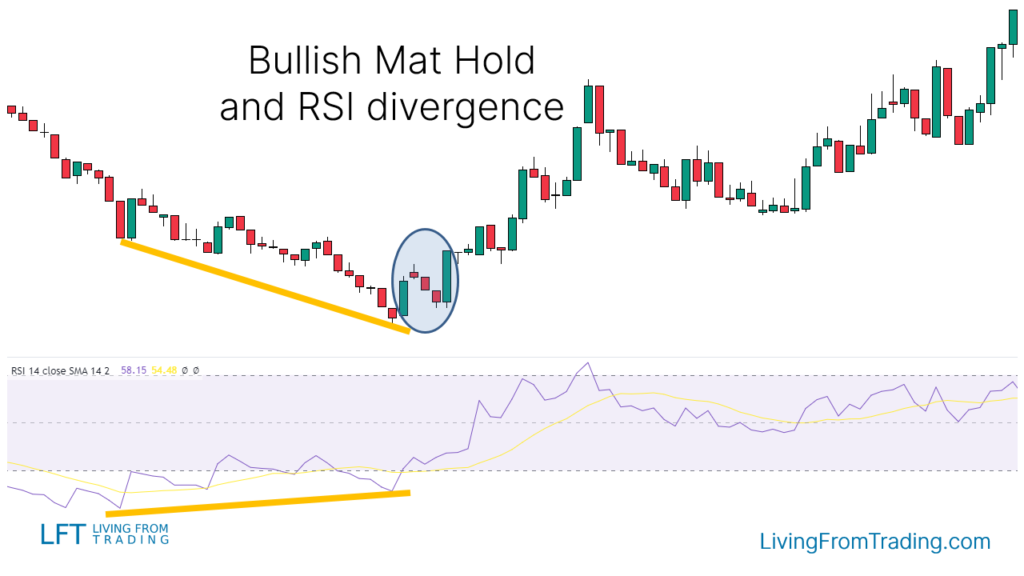
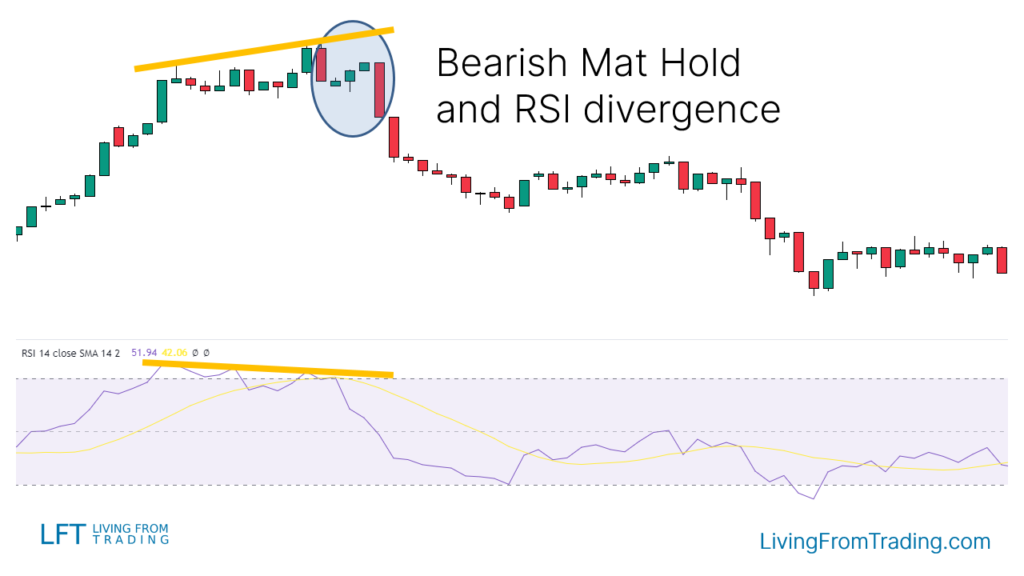
RSI divergence helps identify potential trend reversal signals. Combining it with the Mat Hold pattern can improve trading accuracy.
Bullish Divergence:
- Identify a downtrend and mark each low.
- Compare price lows with RSI lows.
- Look for bullish divergence where RSI shows higher lows while price shows lower lows.
- Enter a buy position when the Mat Hold pattern aligns with RSI divergence.
- Set stop loss and take profit levels, expecting price increase.
Bearish Divergence:
- Identify an uptrend and mark each high.
- Compare price highs with RSI highs.
- Look for bearish divergence where RSI shows lower highs while price shows higher highs.
- Enter a sell position when the Mat Hold pattern aligns with RSI divergence.
- Set stop loss and take profit levels, expecting price decrease.
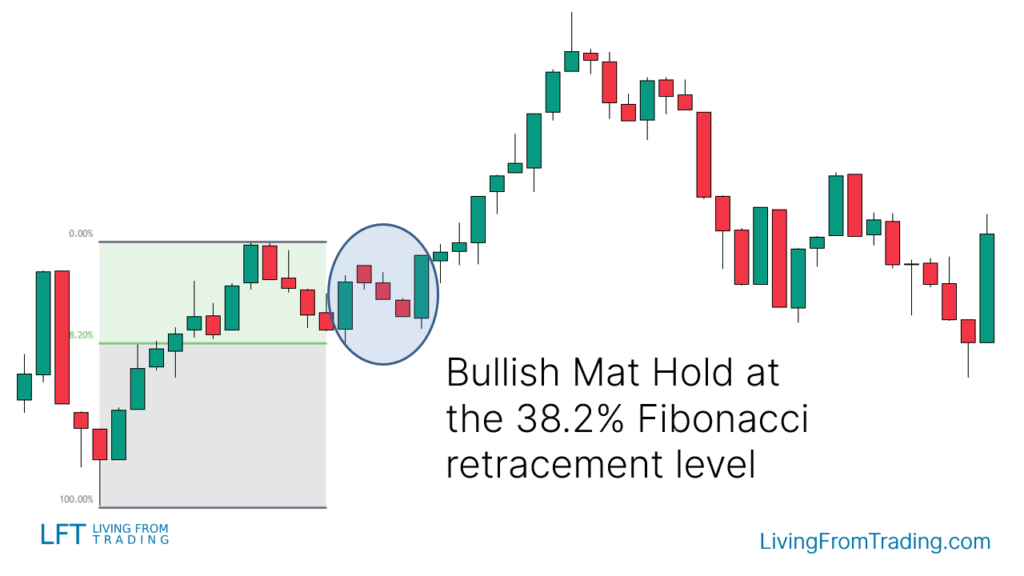
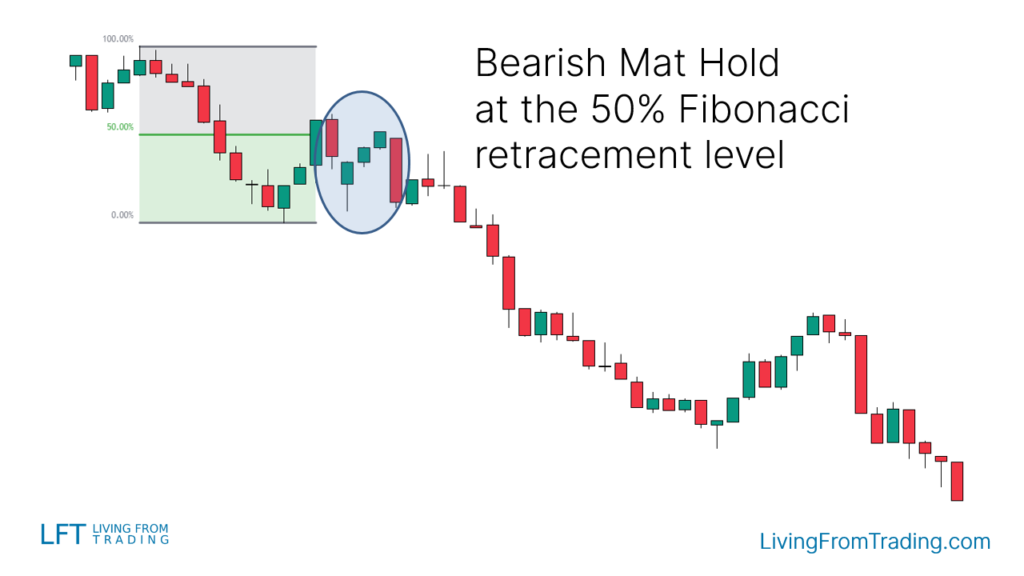
Strategy 5: Combining Fibonacci Retracements
Use Fibonacci retracement levels to find key price levels for trading when a Mat Hold pattern appears.
Bullish Trades:
- Wait for a pullback in an uptrend.
- Use Fibonacci tools to mark retracement levels.
- Enter a buy position when the price hits a Fibonacci level and forms a Mat Hold pattern.
- Set stop loss and take profit levels, expecting price increase.
Bearish Trades:
- Wait for a rebound in a downtrend.
- Use Fibonacci tools to mark retracement levels.
- Enter a sell position when the price hits a Fibonacci level and forms a Mat Hold pattern.
- Set stop loss and take profit levels, expecting price decrease.
Strategy 6: Combining Pivot Points
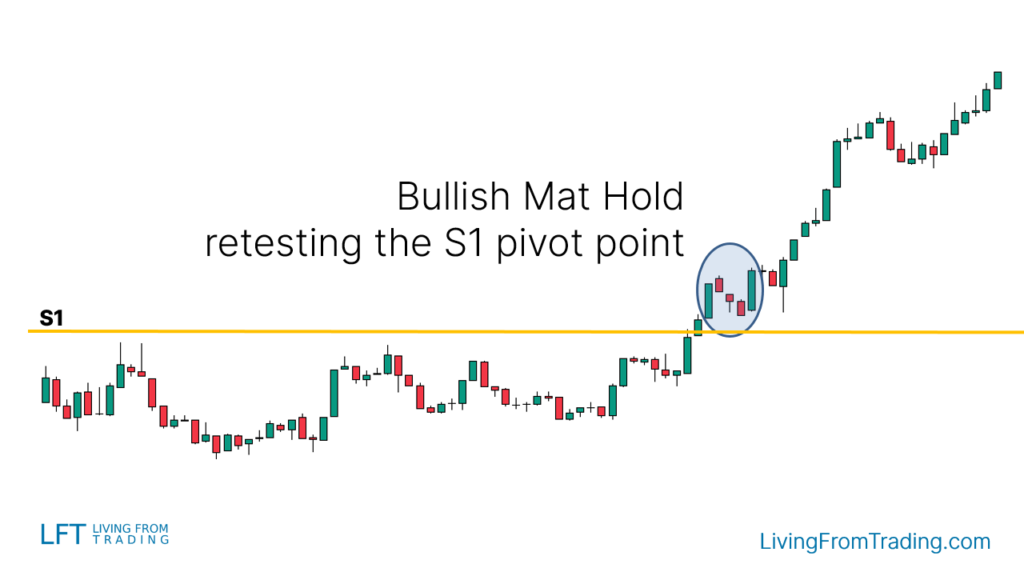
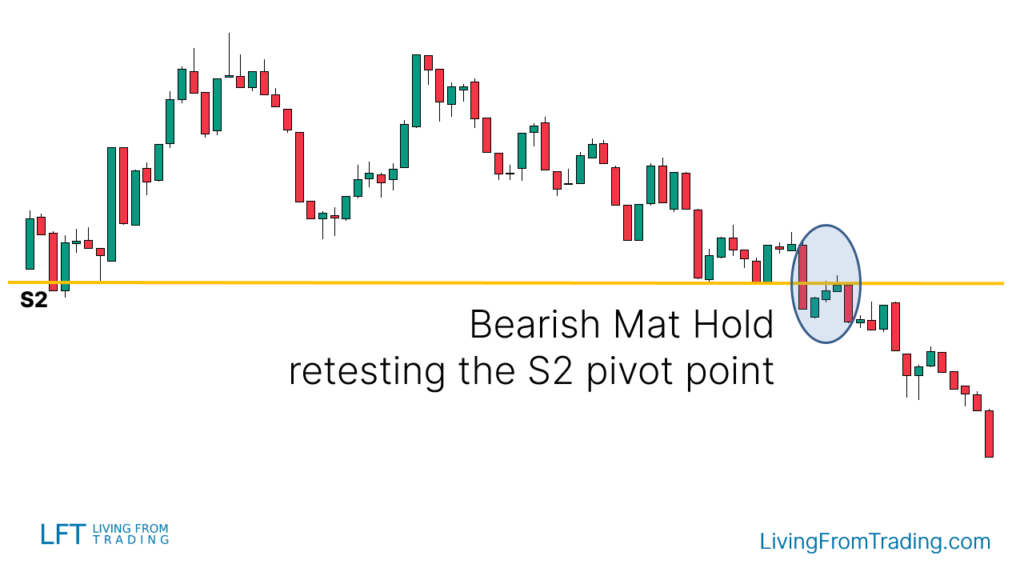
Pivot points are automatic support and resistance levels based on mathematical formulas, suitable for intraday and longer-term analysis.
Bullish Trades:
- Activate the pivot point indicator.
- Check the pivot points above the price, as these levels often act as support.
- Wait for the price to rise to and break through the pivot point.
- Enter a buy position when the Mat Hold pattern appears at this level.
- Set stop loss and take profit levels, anticipating a price increase.
Bearish Trades:
- Activate the pivot point indicator.
- Check the pivot points below the price, as these levels often act as resistance.
- Wait for the price to fall to and break through the pivot point.
- Enter a sell position when the Mat Hold pattern appears at this level.
- Set stop loss and take profit levels, anticipating a price decrease.
Conclusion
As a continuation pattern, Mat Hold effectively predicts price movement continuation. By combining it with techniques such as pullbacks, support and resistance levels, moving averages, RSI divergence, Fibonacci retracements, and pivot points, traders can significantly enhance trading accuracy. Mastering these strategies can aid in making more precise trading decisions.
Disclaimer: The views in this article are from the original Creator and do not represent the views or position of Hawk Insight. The content of the article is for reference, communication and learning only, and does not constitute investment advice. If it involves copyright issues, please contact us for deletion.